Optimization of the parameters of the permanent contract grid strategy
Author: The grass, Created: 2023-12-08 17:00:38, Updated: 2023-12-14 17:07:42
The perpetual grid strategy is a very popular classic strategy of the platform. Compared to the real-time grid, it does not use coins, can be leveraged, and is much easier than the real-time grid. However, since it is not possible to directly retest on the inventor's quantified platform, which is not conducive to filtering the currency and determining parameter optimization, this article will introduce the complete Python retest process, which includes all aspects of data collection, retesting framework, measurement functions, parameter optimization, etc., which can be tried by yourself in the juypter notebook.
The collection of data
Generally, K-line data is sufficient, for accuracy, the smaller the K-line cycle, the better, but to balance the retesting time and the amount of data, this article uses 5min to retest the data of the last two years, the final data volume exceeds 20W lines, the currency chooses DYDX. Of course, the specific currency and K-line cycle can be selected according to your interests.
import requests
from datetime import date,datetime
import time
import pandas as pd
import numpy as np
import matplotlib.pyplot as plt
import requests, zipfile, io
%matplotlib inline

def GetKlines(symbol='BTC',start='2020-8-10',end='2021-8-10',period='1h'):
    Klines = []
    start_time = int(time.mktime(datetime.strptime(start, "%Y-%m-%d").timetuple()))*1000
    end_time = int(time.mktime(datetime.strptime(end, "%Y-%m-%d").timetuple()))*1000
    while start_time < end_time:
        res = requests.get('https://fapi.binance.com/fapi/v1/klines?symbol=%sUSDT&interval=%s&startTime=%s&limit=1000'%(symbol,period,start_time))
        res_list = res.json()
        Klines += res_list
        start_time = res_list[-1][0]
    return pd.DataFrame(Klines,columns=['time','open','high','low','close','amount','end_time','volume','count','buy_amount','buy_volume','null']).astype('float')

df = GetKlines(symbol='DYDX',start='2022-1-1',end='2023-12-7',period='5m')
df = df.drop_duplicates()
Re-testing framework
ReVision continues to choose the previously commonly used framework to support USDT perpetual contract multi-currency, which is simple to use.
class Exchange:

    def __init__(self, trade_symbols, fee=0.0004, initial_balance=10000):
        self.initial_balance = initial_balance #初始的资产
        self.fee = fee
        self.trade_symbols = trade_symbols
        self.account = {'USDT':{'realised_profit':0, 'unrealised_profit':0, 'total':initial_balance, 'fee':0}}
        for symbol in trade_symbols:
            self.account[symbol] = {'amount':0, 'hold_price':0, 'value':0, 'price':0, 'realised_profit':0,'unrealised_profit':0,'fee':0}

    def Trade(self, symbol, direction, price, amount):

        cover_amount = 0 if direction*self.account[symbol]['amount'] >=0 else min(abs(self.account[symbol]['amount']), amount)
        open_amount = amount - cover_amount
        self.account['USDT']['realised_profit'] -= price*amount*self.fee #扣除手续费
        self.account['USDT']['fee'] += price*amount*self.fee
        self.account[symbol]['fee'] += price*amount*self.fee

        if cover_amount > 0: #先平仓
            self.account['USDT']['realised_profit'] += -direction*(price - self.account[symbol]['hold_price'])*cover_amount  #利润
            self.account[symbol]['realised_profit'] += -direction*(price - self.account[symbol]['hold_price'])*cover_amount

            self.account[symbol]['amount'] -= -direction*cover_amount
            self.account[symbol]['hold_price'] = 0 if self.account[symbol]['amount'] == 0 else self.account[symbol]['hold_price']

        if open_amount > 0:
            total_cost = self.account[symbol]['hold_price']*direction*self.account[symbol]['amount'] + price*open_amount
            total_amount = direction*self.account[symbol]['amount']+open_amount

            self.account[symbol]['hold_price'] = total_cost/total_amount
            self.account[symbol]['amount'] += direction*open_amount


    def Buy(self, symbol, price, amount):
        self.Trade(symbol, 1, price, amount)

    def Sell(self, symbol, price, amount):
        self.Trade(symbol, -1, price, amount)

    def Update(self, close_price): #对资产进行更新
        self.account['USDT']['unrealised_profit'] = 0
        for symbol in self.trade_symbols:
            self.account[symbol]['unrealised_profit'] = (close_price[symbol] - self.account[symbol]['hold_price'])*self.account[symbol]['amount']
            self.account[symbol]['price'] = close_price[symbol]
            self.account[symbol]['value'] = abs(self.account[symbol]['amount'])*close_price[symbol]
            self.account['USDT']['unrealised_profit'] += self.account[symbol]['unrealised_profit']
        self.account['USDT']['total'] = round(self.account['USDT']['realised_profit'] + self.initial_balance + self.account['USDT']['unrealised_profit'],6)
Grid retrieval function
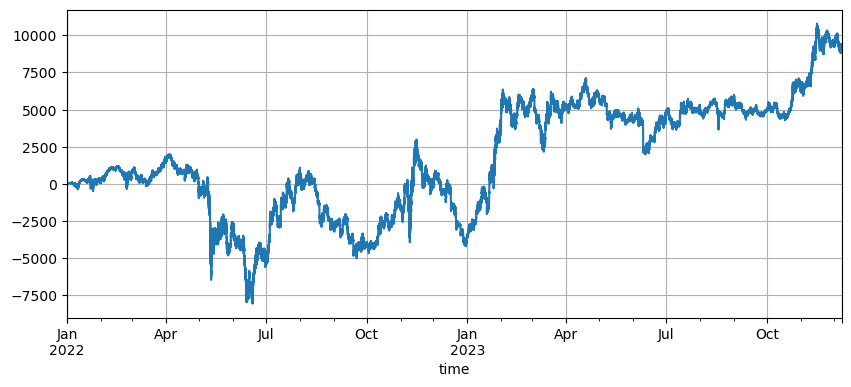
The principle of the grid strategy is very simple, it increases the sell and decreases the buy, specifically involving three parameters: initial price, grid interval, trading value. The market volatility of DYDX is very large, from the initial 8.6U low fell 1U, the recent bull market returned 3U, the default initial price of the strategy is 8.6U, which is very unfavorable for the grid strategy, but the default parameter recalls the total profit of 9200U for two years, with a loss of 7500U during this period.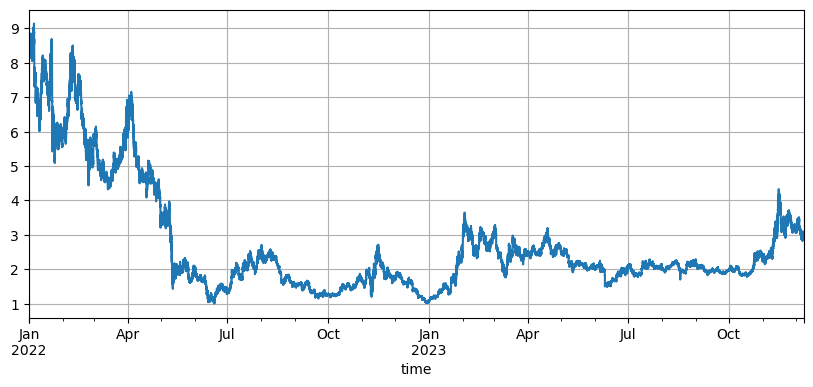
symbol = 'DYDX'
value = 100
pct = 0.01

def Grid(fee=0.0002, value=100, pct=0.01, init = df.close[0]):
    e = Exchange([symbol], fee=0.0002, initial_balance=10000)
    init_price = init
    res_list = [] #用于储存中间结果
    for row in df.iterrows():
        kline = row[1] #这样会测一根K线只会产生一个买单或一个卖单,不是特别精确
        buy_price = (value / pct - value) / ((value / pct) / init_price + e.account[symbol]['amount']) #买单价格,由于是挂单成交,也是最终的撮合价格
        sell_price = (value / pct + value) / ((value / pct) / init_price + e.account[symbol]['amount'])
        if kline.low < buy_price: #K线最低价低于当前挂单价,买单成交
            e.Buy(symbol,buy_price,value/buy_price)
        if kline.high > sell_price:
            e.Sell(symbol,sell_price,value/sell_price)
        e.Update({symbol:kline.close})
        res_list.append([kline.time, kline.close, e.account[symbol]['amount'], e.account['USDT']['total']-e.initial_balance,e.account['USDT']['fee'] ])
    res = pd.DataFrame(data=res_list, columns=['time','price','amount','profit', 'fee'])
    res.index = pd.to_datetime(res.time,unit='ms')
    return res
Effects of initial price
The initial holding of the strategy is affected by the setting of the initial price, the default initial holding price just reviewed is the initial holding price at the start, i.e. no holding at the start. And we know that the grid strategy will reap all the profits at the initial return of the price, so if the strategy is able to have the correct forecast of future trends at the start, there will be a significant increase in earnings.
However, the initial price is set at 3U, and the strategy is to hold a large number of empty stocks at the beginning, in this case directly holding a 17,000U empty bill, thus also exposing the risk to greater risk.
Set the grid spacing
The distance of the grid interval determines the distance of the order, obviously the smaller the interval, the more frequent the transaction, the lower the profit of a single transaction, the higher the transaction fee. However, it is worth noting that the grid interval becomes smaller and the value of the grid does not change, when the price changes, the total holdings increase, the risks faced are completely different.
This is clearly unrealistic, especially since the volatility of digital currencies is very high, and the smaller intervals will miss a lot of transactions in the retest compared to the real disk, and only the increased intervals have a reference value. Under this retest mechanism, the conclusions are not accurate.
for p in [0.0005, 0.001 ,0.002 ,0.005, 0.01, 0.02, 0.05]:
    res = Grid( fee=0.0002, value=value*p/0.01, pct=p, init =3)
    print(p, round(min(res['profit']),0), round(res['profit'][-1],0), round(res['fee'][-1],0))

0.0005 -8378.0 144.0 237.0
0.001 -9323.0 1031.0 465.0
0.002 -9306.0 3606.0 738.0
0.005 -9267.0 9457.0 781.0
0.01 -9228.0 13375.0 550.0
0.02 -9183.0 15212.0 309.0
0.05 -9037.0 16263.0 131.0
Net worth
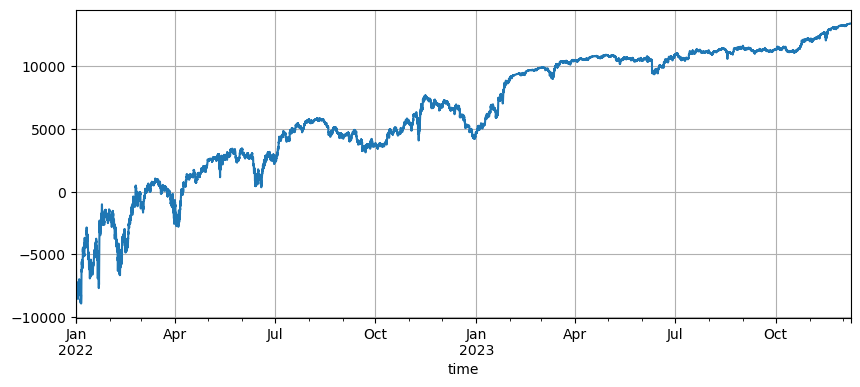
As mentioned earlier, when volatility is simultaneous, the greater the value held, the greater the risk and other proportional methods, but as long as it is not a rapid decline, 1% of total capital coupled with 1% of the grid gap should be able to cope with the vast majority of the market. In this example of DYDX, a decline of almost 90% also triggered a boom.
Variable return price
The return price is the initial price, the difference between the current price and the initial price and the size of the grid determines how many positions should be held. If the return price is set higher than the current price, the grid strategy will do more, and in turn will be empty. The default return price is the price at which the strategy starts. To reduce risk, it is recommended to do only a few grids.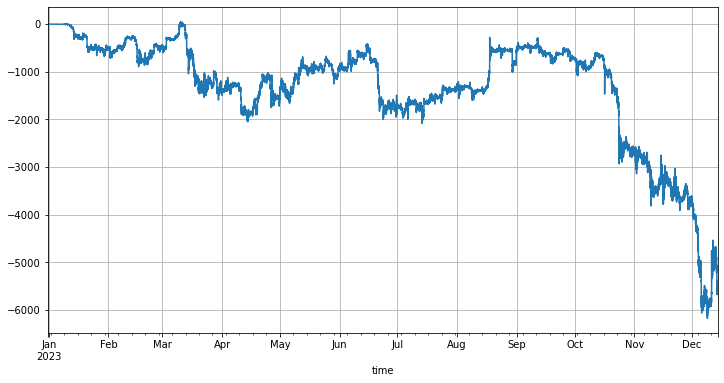
The return price is set to 1.6 times the start price when the strategy is initiated, so that the grid strategy starts holding the multiple position caused by this partial spread when the price drops from 1.6 times to the current price, and if the later price exceeds the return price/1.6, the initial price is reset, thus always maintaining at least 60% of the difference used to do more. The retest results are as follows:
Of course, if you are more optimistic about the market, you can set this ratio higher, and the final return will increase accordingly. Of course, if the market falls, this setting also increases the risk of holding.
- FMZ Quant: An Analysis of Common Requirements Design Examples in the Cryptocurrency Market (II)
- How to Exploit Brainless Selling Bots with a High-Frequency Strategy in 80 Lines of Code
- FMZ quantification: common demands on the cryptocurrency market design example analysis (II)
- How to exploit brainless robots for sale with high-frequency strategies of 80 lines of code
- FMZ Quant: An Analysis of Common Requirements Design Examples in the Cryptocurrency Market (I)
- FMZ quantification: common demands of the cryptocurrency market design instance analysis (1)
- WexApp, the FMZ Quant Cryptocurrency Demo Exchange, is Newly Launched
- Detailed Explanation of Perpetual Contract Grid Strategy Parameter Optimization
- Teach You to Use the FMZ Extended API to Batch Modify Parameters of the Bot
- Teach you how to use the FMZ Extension API to modify disk parameters in bulk
- Instructions for Installing Interactive Brokers IB Gateway in Linux Bash
- How to install the penetration security IB GATEWAY under Linux bash
- Which is More Suitable for Bottom Fishing, Low Market Value or Low Price?
- I'm not sure which is better, the low market value or the low price.
- Bayes - Decoding the Mystery of Probability, Exploring the Mathematical Wisdom Behind Decision Making
- Bayes - the mystery of decoding probability, exploring the mathematical wisdom behind decision making
- The Advantages of Using FMZ's Extended API for Efficient Group Control Management in Quantitative Trading
- Price Performance After the Currency is Listed on Perpetual Contracts
- Efficient cluster management using FMZ's extended API is an advantage in quantitative trading
- The price performance after the currency went live
EEEEWhy can't fmz directly retrieve the grid policy?