FMZ quantification: common demands of the cryptocurrency market design instance analysis (1)
Author: The Little Dream, Created: 2023-12-17 18:43:46, Updated: 2023-12-18 09:46:16
In the field of cryptocurrency asset trading, obtaining and analyzing market data, query rates, and monitoring account asset changes are key operations. Here are code cases for some common needs.
1, how do you write the currency that gained the most currency in 4 hours to get the coin in cash?
When writing a quantitative trading strategy program on FMZ, the needs encountered first need to be analyzed. So according to the needs we analyze the following:
- Design using which programming language It is planned to be implemented using Javascript.
- Real-time market data needed for all currencies
Seeing this demand, the first thing we did was to look at the Binance API documentation to see if there was any aggregate market data (the aggregate market is the best, one variety at a time).
In the meantime, I'm going to check out the aggregate market interface:
GET https://api.binance.com/api/v3/ticker/priceI'm not going to lie. On FMZ, access to the exchange's transactional interface (public interface without signing required) is usedHttpQueryThe function ≠ ∞ - Data needed to statistically calculate the four-hour rolling window cycle This is the first time that the government has been able to design the structure of the statistical process.
- Calculate the slump, sort
Thinking about the slump algorithm, whether it is:
涨跌幅百分比 =(当前价格 - 初始价格)/ 初始价格 * 100The unit is% .
After thinking about the problem and defining the solution, we started the design process.
Code design
var dictSymbolsPrice = {}

function main() {
    while (true) {
        // GET https://api.binance.com/api/v3/ticker/price
        try {
            var arr = JSON.parse(HttpQuery("https://api.binance.com/api/v3/ticker/price"))
            if (!Array.isArray(arr)) {
                Sleep(5000)
                continue
            }

            var ts = new Date().getTime()
            for (var i = 0; i < arr.length; i++) {
                var symbolPriceInfo = arr[i]
                var symbol = symbolPriceInfo.symbol
                var price = symbolPriceInfo.price

                if (typeof(dictSymbolsPrice[symbol]) == "undefined") {
                    dictSymbolsPrice[symbol] = {name: symbol, data: []}
                }
                dictSymbolsPrice[symbol].data.push({ts: ts, price: price})
            }
        } catch(e) {
            Log("e.name:", e.name, "e.stack:", e.stack, "e.message:", e.message)
        }

        // 计算涨跌幅
        var tbl = {
            type : "table",
            title : "涨跌幅",
            cols : ["交易对", "当前价格", "4小时前价格", "涨跌幅", "数据长度", "最早数据时间", "最新数据时间"],
            rows : []
        }
        for (var symbol in dictSymbolsPrice) {
            var data = dictSymbolsPrice[symbol].data
            if (data[data.length - 1].ts - data[0].ts > 1000 * 60 * 60 * 4) {
                dictSymbolsPrice[symbol].data.shift()
            }

            data = dictSymbolsPrice[symbol].data
            dictSymbolsPrice[symbol].percentageChange = (data[data.length - 1].price - data[0].price) / data[0].price * 100
        }

        var entries = Object.entries(dictSymbolsPrice)
        entries.sort((a, b) => b[1].percentageChange - a[1].percentageChange)

        for (var i = 0; i < entries.length; i++) {
            if (i > 9) {
                break
            }
            var name = entries[i][1].name
            var data = entries[i][1].data
            var percentageChange = entries[i][1].percentageChange
            var currPrice = data[data.length - 1].price
            var currTs = _D(data[data.length - 1].ts)
            var prePrice = data[0].price
            var preTs = _D(data[0].ts)
            var dataLen = data.length

            tbl.rows.push([name, currPrice, prePrice, percentageChange + "%", dataLen, preTs, currTs])
        }

        LogStatus(_D(), "\n", "`" + JSON.stringify(tbl) + "`")
        Sleep(5000)
    }
}
Code parsing
-
- The structure of the data
var dictSymbolsPrice = {}: an empty object used to store price information for each trading pair. The key is the symbol for the trading pair, the value is an object containing the name of the trading pair, the price data array and the slope information.
- The structure of the data
-
- Main function main (())
- 2.1. Infinite cycles
The program continuously monitors the price of Binance API transactions through an infinite loop.while (true) { // ... } - 2.2. Obtaining price information
Obtain information about the current price of the transaction pair through the Binance API. If the returned value is not an array, wait 5 seconds and try again.var arr = JSON.parse(HttpQuery("https://api.binance.com/api/v3/ticker/price")) - 2.3 Update the price data
Go through the obtained price information array, updating the data in dictSymbolsPrice. For each transaction pair, the current time frame and price are added to the corresponding data array.for (var i = 0; i < arr.length; i++) { // ... } - 2.4. Treatment of abnormalities
Captures anomalies and records anomalous information to ensure that the program can continue to execute.} catch(e) { Log("e.name:", e.name, "e.stack:", e.stack, "e.message:", e.message) } - 2.5. Calculation of the slump
Go through the dictSymbolsPrice, calculate the price drop for each trading pair, and delete the earliest data if the data is longer than 4 hours.for (var symbol in dictSymbolsPrice) { // ... } - 2.6. Sort and generate tables
Sort the pair of trades from high to low in order of decline and generate a table containing information about the pair of trades.var entries = Object.entries(dictSymbolsPrice) entries.sort((a, b) => b[1].percentageChange - a[1].percentageChange) for (var i = 0; i < entries.length; i++) { // ... } - 2.7. Log output and delays
The table and the current time are output in the form of logs, and the next round is followed after 5 seconds.LogStatus(_D(), "\n", "`" + JSON.stringify(tbl) + "`") Sleep(5000)
The program obtains real-time price information about the trading pair through the Binance API, then calculates the price drop, and outputs it to the logs in the form of tables. The program provides real-time monitoring of the price of the transaction by continuously looping execution. Note that the program includes exception handling to ensure that the execution is not interrupted due to an exception when obtaining price information.
Running tests on the disk
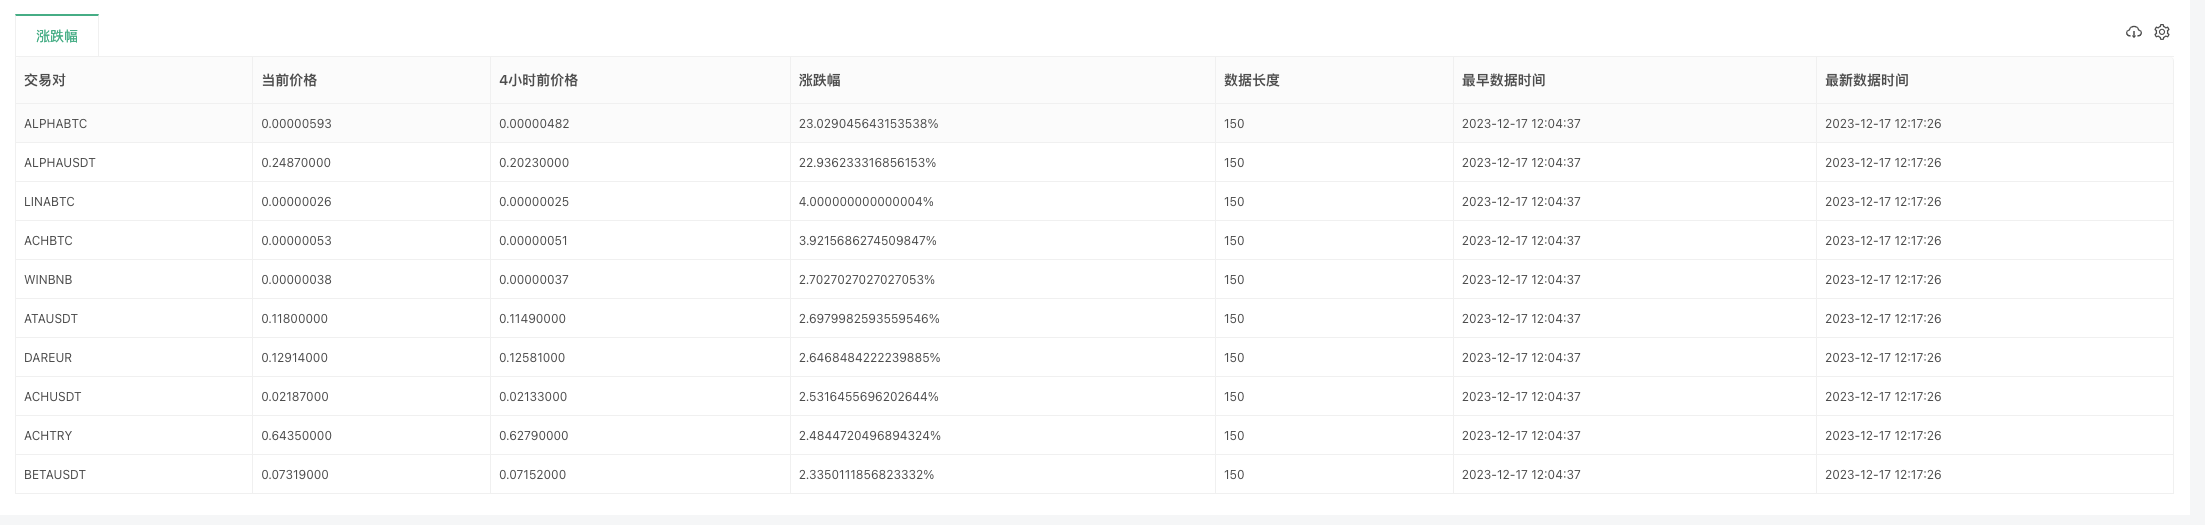
Since data can only be collected one bit at a time at the beginning, it is impossible to calculate the slump when not collecting enough data for 4 hours. So the starting time is calculated with an initial price as a benchmark, after collecting enough data for 4 hours, the oldest data is successively erased to maintain the 4-hour window period.
2, check the full range of funding rates for Binance U-Byte contracts
The first thing you need to do is to look at the API documentation of Binance to find the interface for the exchange rate. Binance has several interfaces to query the exchange rate, here we use the U-bit contract interface:
GET https://fapi.binance.com/fapi/v1/premiumIndex
Code Implemented
We are in the top 10 of the largest exporters of capital due to the large number of contracts.
function main() {
while (true) {
// GET https://fapi.binance.com/fapi/v1/premiumIndex
try {
var arr = JSON.parse(HttpQuery("https://fapi.binance.com/fapi/v1/premiumIndex"))
if (!Array.isArray(arr)) {
Sleep(5000)
continue
}
arr.sort((a, b) => parseFloat(b.lastFundingRate) - parseFloat(a.lastFundingRate))
var tbl = {
type: "table",
title: "U本位合约资金费率前十",
cols: ["合约", "资金费率", "标记价格", "指数价格", "当期费率时间", "下期费率时间"],
rows: []
}
for (var i = 0; i < 9; i++) {
var obj = arr[i]
tbl.rows.push([obj.symbol, obj.lastFundingRate, obj.markPrice, obj.indexPrice, _D(obj.time), _D(obj.nextFundingTime)])
}
LogStatus(_D(), "\n", "`" + JSON.stringify(tbl) + "`")
} catch(e) {
    Log("e.name:", e.name, "e.stack:", e.stack, "e.message:", e.message)
}
Sleep(1000 * 10)
}
}
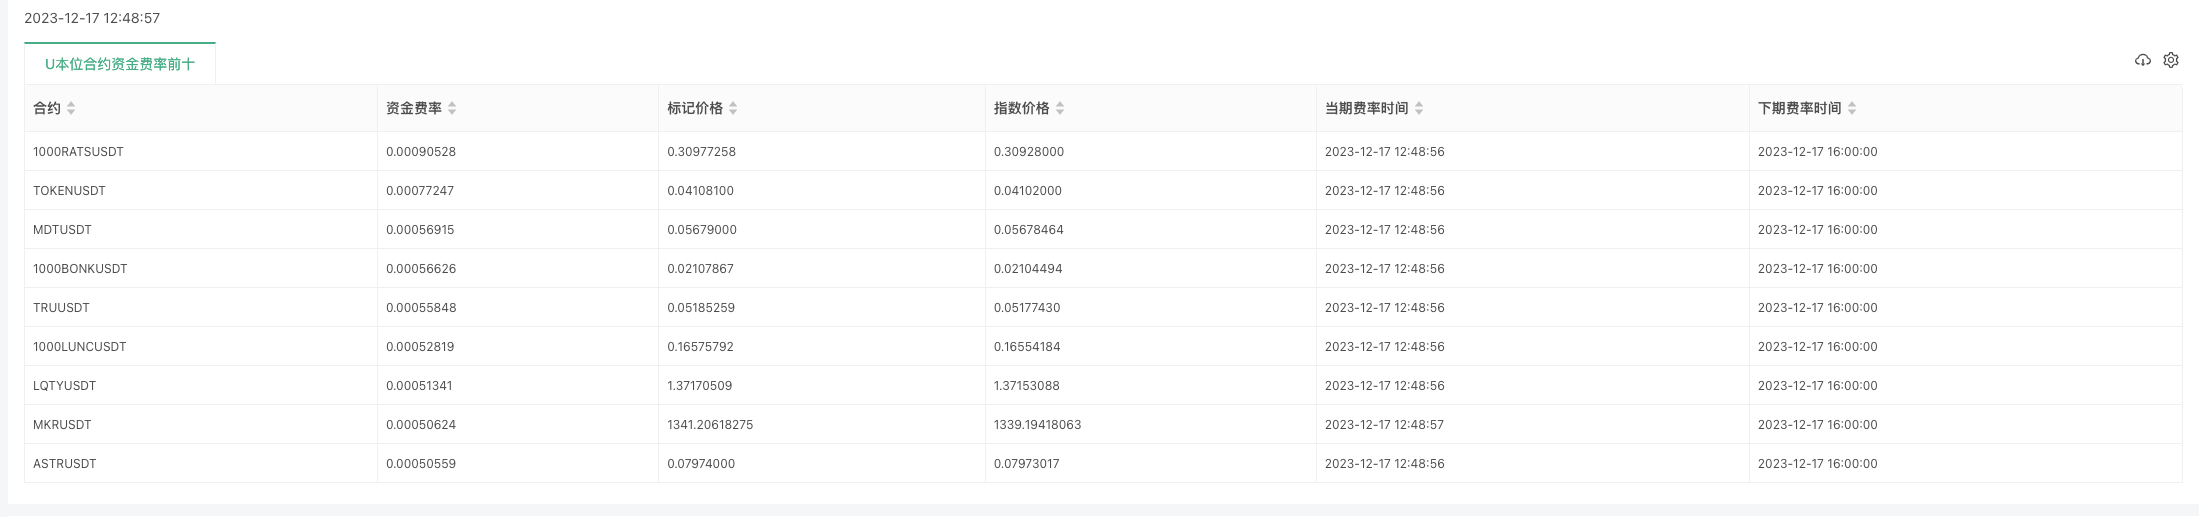
The data structure returned is as follows: Last Funding Rate is the funding rate we want to see in the Binance documentation.
{
    "symbol":"STMXUSDT",
    "markPrice":"0.00883606",
    "indexPrice":"0.00883074",
    "estimatedSettlePrice":"0.00876933",
    "lastFundingRate":"0.00026573",
    "interestRate":"0.00005000",
    "nextFundingTime":1702828800000,
    "time":1702816229000
}
This is a test run on a real disk:
Python version of the OKX exchange for access to contract funding rates
Some users have suggested an example of a Python version, and it's OKX.
https://www.okx.com/priapi/v5/public/funding-rate-all?currencyType=1The data returned by the interface:
{
    "code":"0",
    "data":[
        {
            "fundingTime":1702828800000,
            "fundingList":[
                {
                    "instId":"BTC-USDT-SWAP",
                    "nextFundingRate":"0.0001102188733642",
                    "minFundingRate":"-0.00375",
                    "fundingRate":"0.0000821861465884",
                    "maxFundingRate":"0.00375"
                } ...
The specific code:
import requests
import json
from time import sleep
from datetime import datetime

def main():
    while True:
        # https://www.okx.com/priapi/v5/public/funding-rate-all?currencyType=1
        try:
            response = requests.get("https://www.okx.com/priapi/v5/public/funding-rate-all?currencyType=1")
            arr = response.json()["data"][0]["fundingList"]
            Log(arr)
            if not isinstance(arr, list):
                sleep(5)
                continue

            arr.sort(key=lambda x: float(x["fundingRate"]), reverse=True)

            tbl = {
                "type": "table",
                "title": "U本位合约资金费率前十",
                "cols": ["合约", "下期费率", "最小", "当期", "最大"],
                "rows": []
            }

            for i in range(min(9, len(arr))):
                obj = arr[i]
                row = [
                    obj["instId"],
                    obj["nextFundingRate"],
                    obj["minFundingRate"],
                    obj["fundingRate"],
                    obj["maxFundingRate"]
                ]
                tbl["rows"].append(row)

            LogStatus(_D(), "\n", '`' + json.dumps(tbl) + '`')

        except Exception as e:
            Log(f"Error: {str(e)}")

        sleep(10)
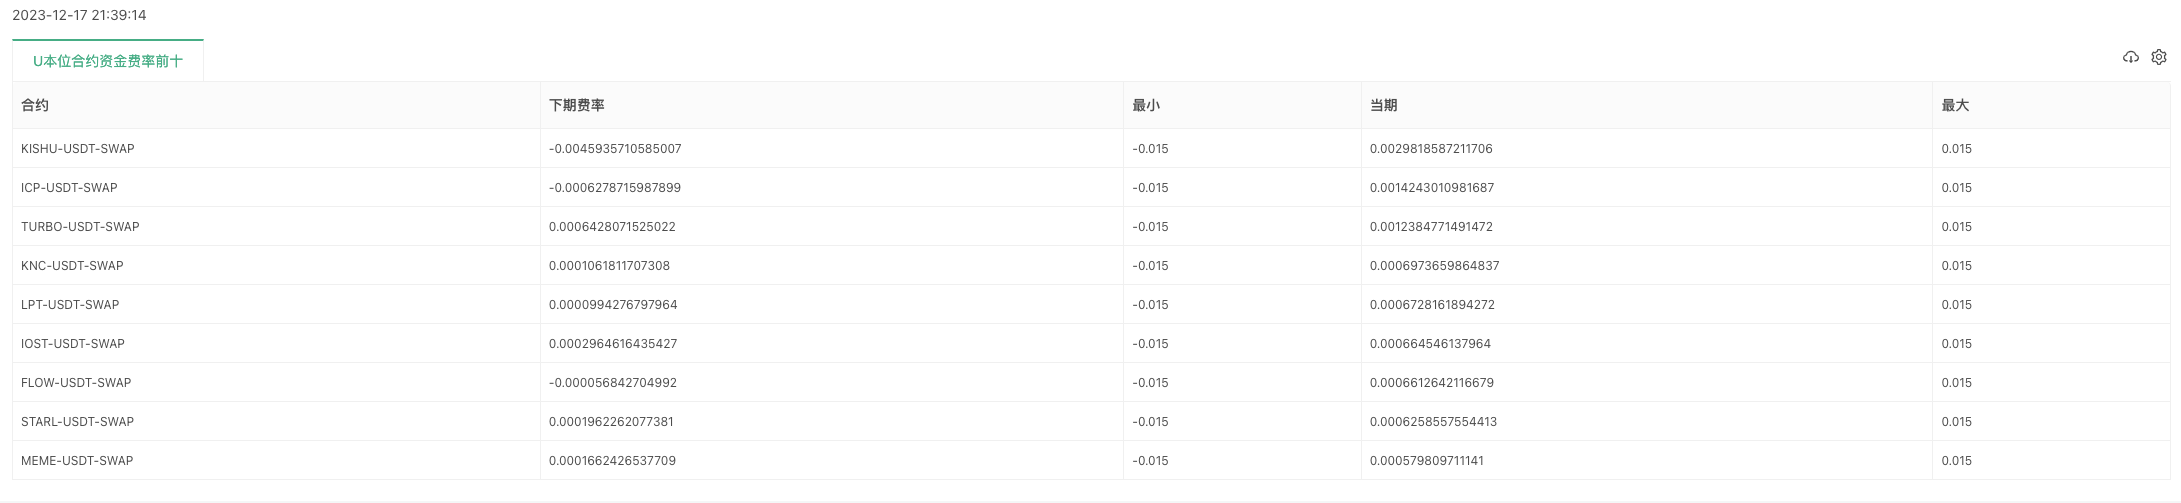
This is a test run on a real disk:
END
These examples provide basic design ideas, callbacks, and practical projects that may need to be modified and extended according to specific needs. Hopefully, these codes will help you better meet the various needs of cryptocurrency digital asset trading.
- Quantifying Fundamental Analysis in the Cryptocurrency Market: Let Data Speak for Itself!
- Quantified research on the basics of coin circles - stop believing in all kinds of crazy professors, data is objective!
- The inventor of the Quantitative Data Exploration Module, an essential tool in the field of quantitative trading.
- Mastering Everything - Introduction to FMZ New Version of Trading Terminal (with TRB Arbitrage Source Code)
- Get all the details about the new FMZ trading terminal (with the TRB suite source code)
- FMZ Quant: An Analysis of Common Requirements Design Examples in the Cryptocurrency Market (II)
- How to Exploit Brainless Selling Bots with a High-Frequency Strategy in 80 Lines of Code
- FMZ quantification: common demands on the cryptocurrency market design example analysis (II)
- How to exploit brainless robots for sale with high-frequency strategies of 80 lines of code
- FMZ Quant: An Analysis of Common Requirements Design Examples in the Cryptocurrency Market (I)
- WexApp, the FMZ Quant Cryptocurrency Demo Exchange, is Newly Launched
- Detailed Explanation of Perpetual Contract Grid Strategy Parameter Optimization
- Teach You to Use the FMZ Extended API to Batch Modify Parameters of the Bot
- Teach you how to use the FMZ Extension API to modify disk parameters in bulk
- Optimization of the parameters of the permanent contract grid strategy
- Instructions for Installing Interactive Brokers IB Gateway in Linux Bash
- How to install the penetration security IB GATEWAY under Linux bash
- Which is More Suitable for Bottom Fishing, Low Market Value or Low Price?
- I'm not sure which is better, the low market value or the low price.
- Bayes - Decoding the Mystery of Probability, Exploring the Mathematical Wisdom Behind Decision Making
98K-band tracking _LongWe are looking forward to seeing a case of @monitoringaccount asset change as soon as possible.
98K-band tracking _LongPraise and worship
The Little DreamWell, that's in the plan.