The inventor of the Quantitative Data Exploration Module, an essential tool in the field of quantitative trading.
Author: Inventors quantified, Created: 2024-02-23 17:16:03, Updated: 2024-03-22 00:40:00
In today's highly competitive financial markets, quantitative trading as a trading strategy based on data analysis and algorithmic models is becoming an increasingly popular choice for investors and traders. In the field of quantitative trading, the value of data is becoming more prominent, and therefore an efficient and reliable set of quantitative data exploration tools has become one of the essential keys to achieving successful trading.
In this age of increasingly data-driven decision-making, inventors have come up with the idea of a quantitative data exploration module. As one of the essential tools in the field of quantitative trading, it is not just an ordinary data analysis software, but a revolutionary innovation that provides investors with unique data analysis and mining capabilities to help them seize opportunities and reduce risks in complex and volatile financial markets.
FMZ Quantitative as a professional quantitative trading platform, with a wide range of quantitative trading tools supported. Currently, FMZ Quantitative platform "Data Exploration" module has been integrated into the services of the datadata platform, users have more advantages in multidimensional data analysis, mining, visualization of data, exploration of trading strategies, etc. FMZ Quantitative self-researched datadata platform is a quantitative financial data platform.
FMZ quantified data exploration module
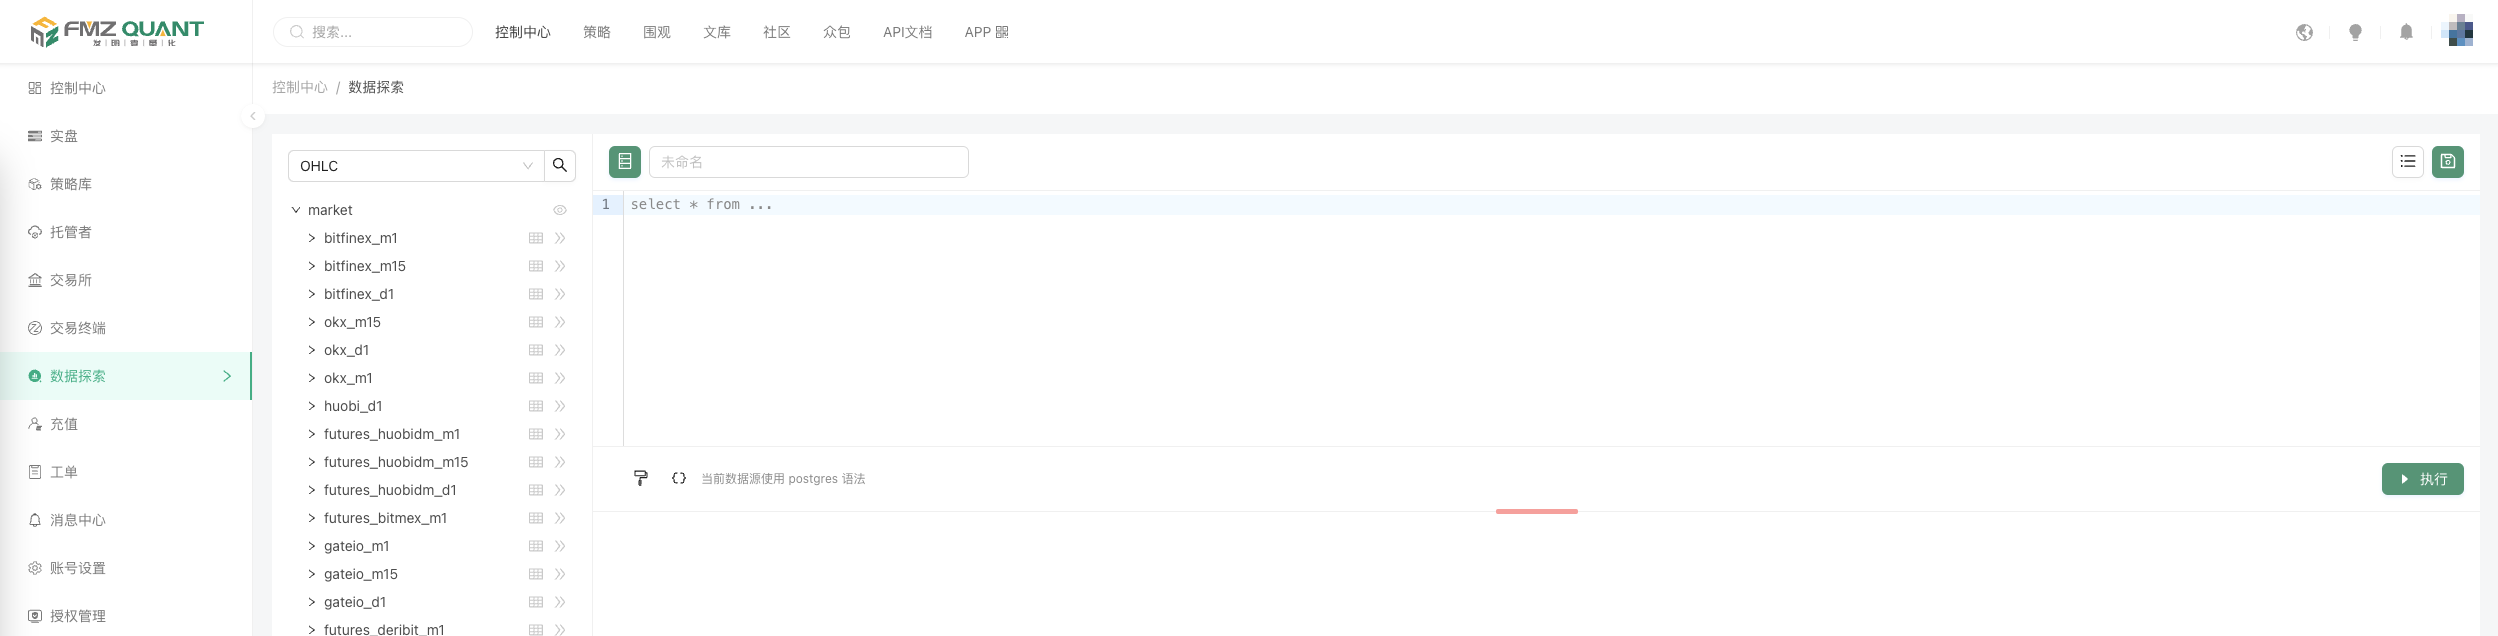
First of all, let's get familiar with the FMZ quantization.Searching for dataModules, used as on datadata. For each FMZ platform user, we do not need to re-register the datadata platform and can directly use the functions of the datadata platform.
-
1 data area The list on the left shows the data content that is currently supported online, currently supported by the various exchanges (platforms) for K-line data (OHLC), Tick data; subsequently, more types and dimensions of data will be supported. This data is constantly updated in real-time, so you are always aware of the market dynamics.
For example, we select "OHLC", and then we select
market->bitfinex_m1Click open and you can see the "field names" in this table object.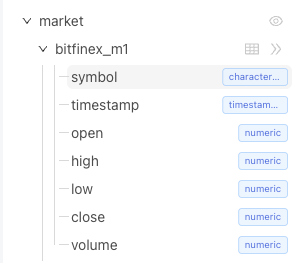
Click on the chart of the form to preview some of the data.
The platform also supports uploading your own data by clicking the "Upload Data" button at the bottom of the list.
Upload CSV files from your device to the server The file size should be no more than 10 MB, with a maximum of 10000 lines and 128 columns.
-
2, SQL statement editing area
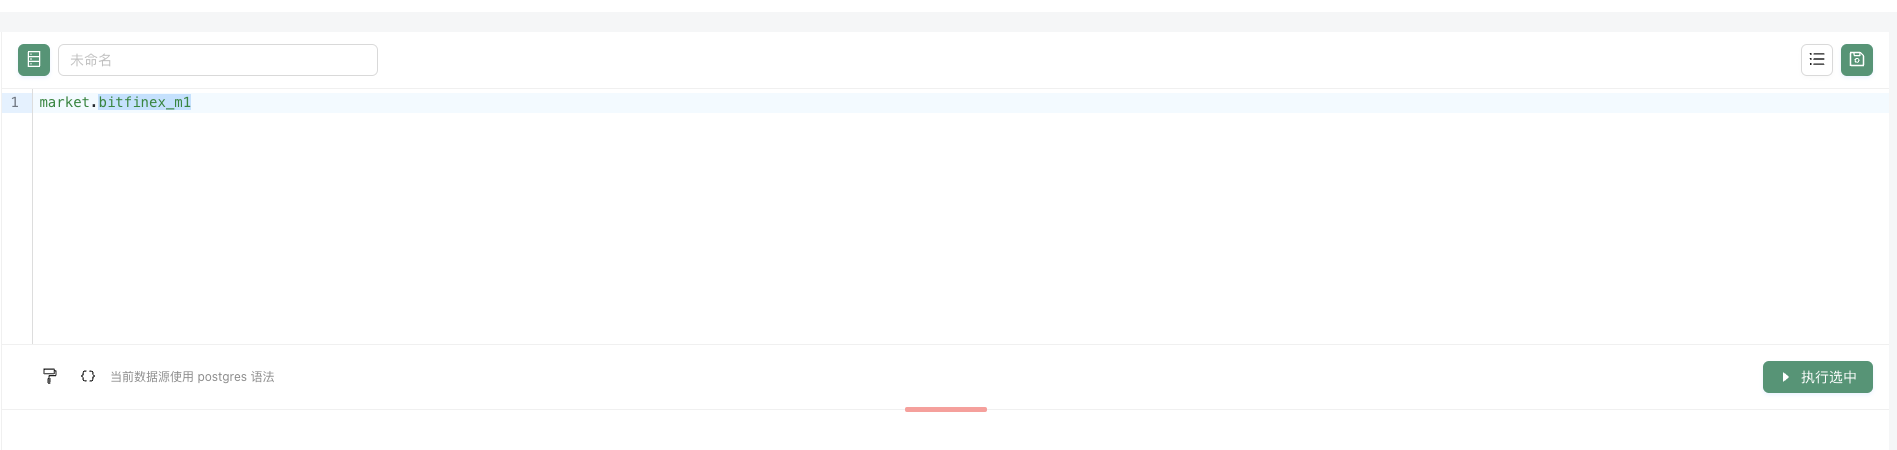
This is the edit box for writing specific query statements, and we'll show you two interesting examples later, before we get into the other features.

There are two control buttons, the first for easy formatting of SQL statements. The second button is used to insert variables used in SQL statements, similar to adding a real-time modifiable parameter to a SQL query (without having to hard-code some of the query conditions in SQL statements). For example:
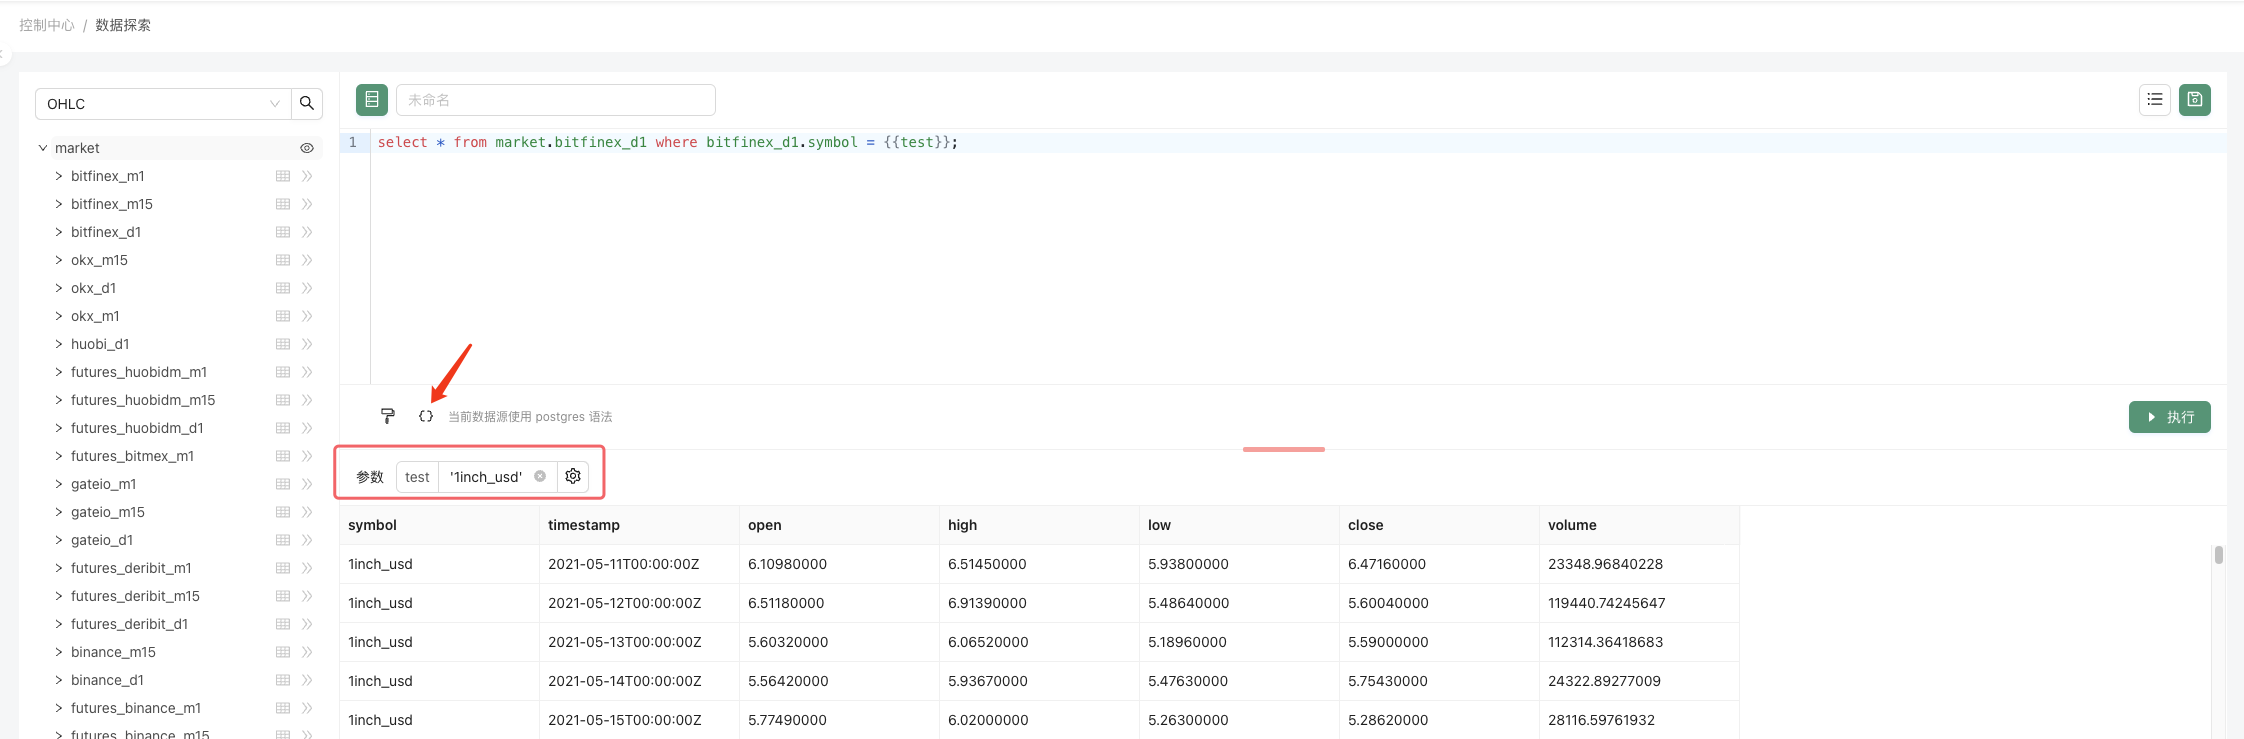
Enter in the parameter test
'1inch_usd'Then click on the "Execute" button on the right to query all the data for this 1inch_usd variety. The query data can also be exported and downloaded locally: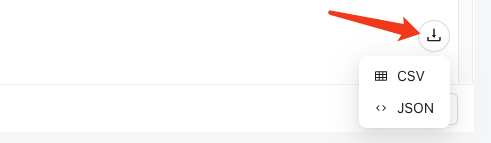
It supports JSON, CSV and other formats.
If you want to save the record of this SQL query, you can click the "Save" button in the top right corner to save this SQL query to the resource list of the current FMZ account "Data Search" (the resource list button is on the left side of the Save button) for later use.
The interface we've seen so far is concise, the functionality is simple, but you'll experience the powerful use of this tool when you actually use it.
Variable ranking
SELECT
    UPPER(REPLACE(symbol, '_usdt.swap', '')) as symbol,
    ((MAX(high) - MIN(low)) / AVG((high + low) / 2)) AS volatility_percentage
FROM
    market.futures_binance_d1
WHERE
    timestamp >= CURRENT_DATE - INTERVAL '{{days}} day' and symbol like '%.swap'
GROUP BY
    symbol
ORDER BY
    volatility_percentage {{rank}}
LIMIT
    {{limit}};
This SQL code is used to extract the percentage of volatility of a transaction against a qualified volatility from the table
This SQL statement is explained as follows:
1、使用了两个表达式进行计算,一个是将 "symbol" 列中的 '_usdt.swap' 替换为空字符串,并将结果转换为大写,另一个是计算 (MAX(high) - MIN(low)) / AVG((high + low) / 2)。
第一个表达式使用了 REPLACE 函数将符合条件的字符串进行替换,然后使用 UPPER 函数将结果转换为大写。
第二个表达式计算了最高价与最低价的差值除以最高价与最低价的平均值,以计算波动率百分比。

2、FROM 子句:
指定了要查询的数据表为 "market.futures_binance_d1"。

3、WHERE 子句:
使用了两个筛选条件:timestamp >= CURRENT_DATE - INTERVAL '{{days}} day' 和 symbol like '%.swap'。
第一个条件筛选出最近 {{days}} 天内的数据。
第二个条件筛选出 "symbol" 列以 '.swap' 结尾的交易对。

4、GROUP BY 子句:
根据 "symbol" 列进行分组。

5、ORDER BY 子句:
根据波动率百分比进行排序,可以选择升序(ASC)或降序(DESC),根据 {{rank}} 参数而定。

6、LIMIT 子句:
限制输出结果的数量,可以根据 {{limit}} 参数进行设置。
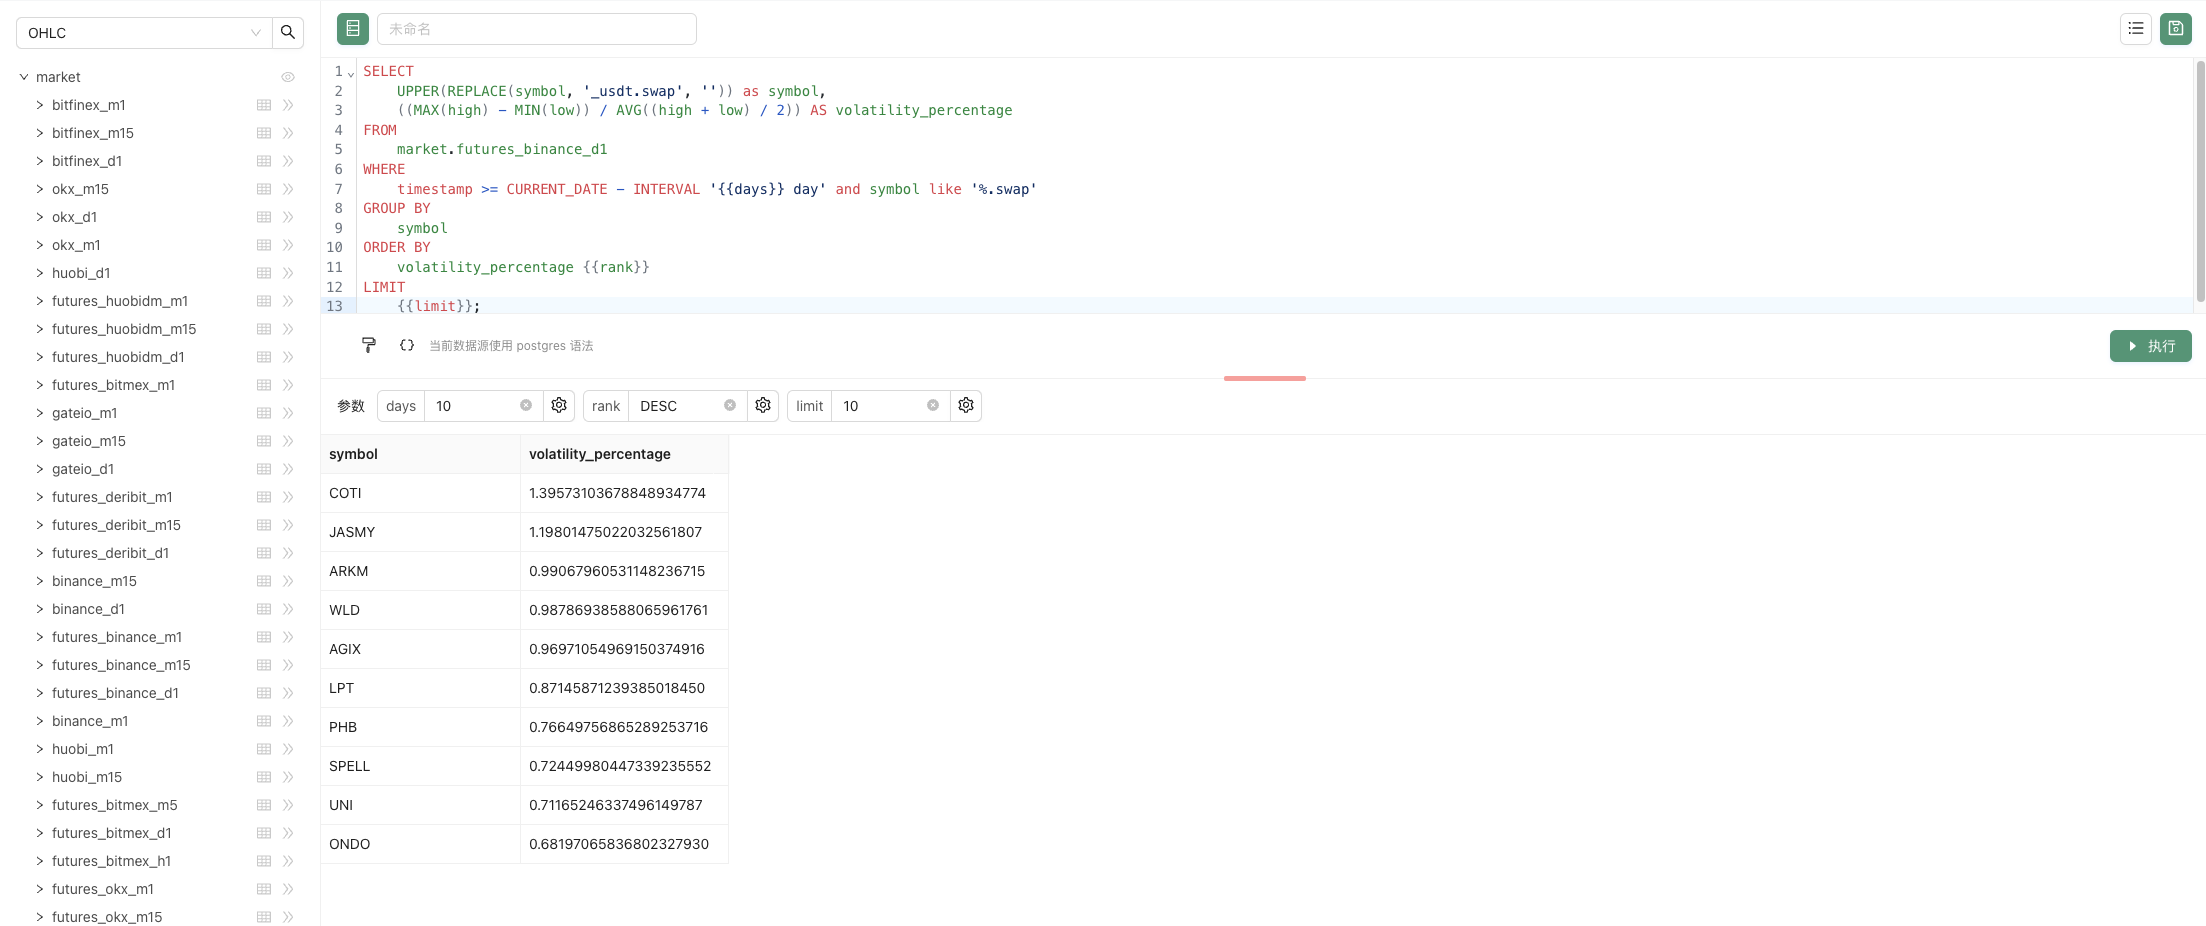
When we enter the parameters: days: 10, rank: DESC, limit: 10 Click the "Execute" button to execute the SQL statement and query the result.
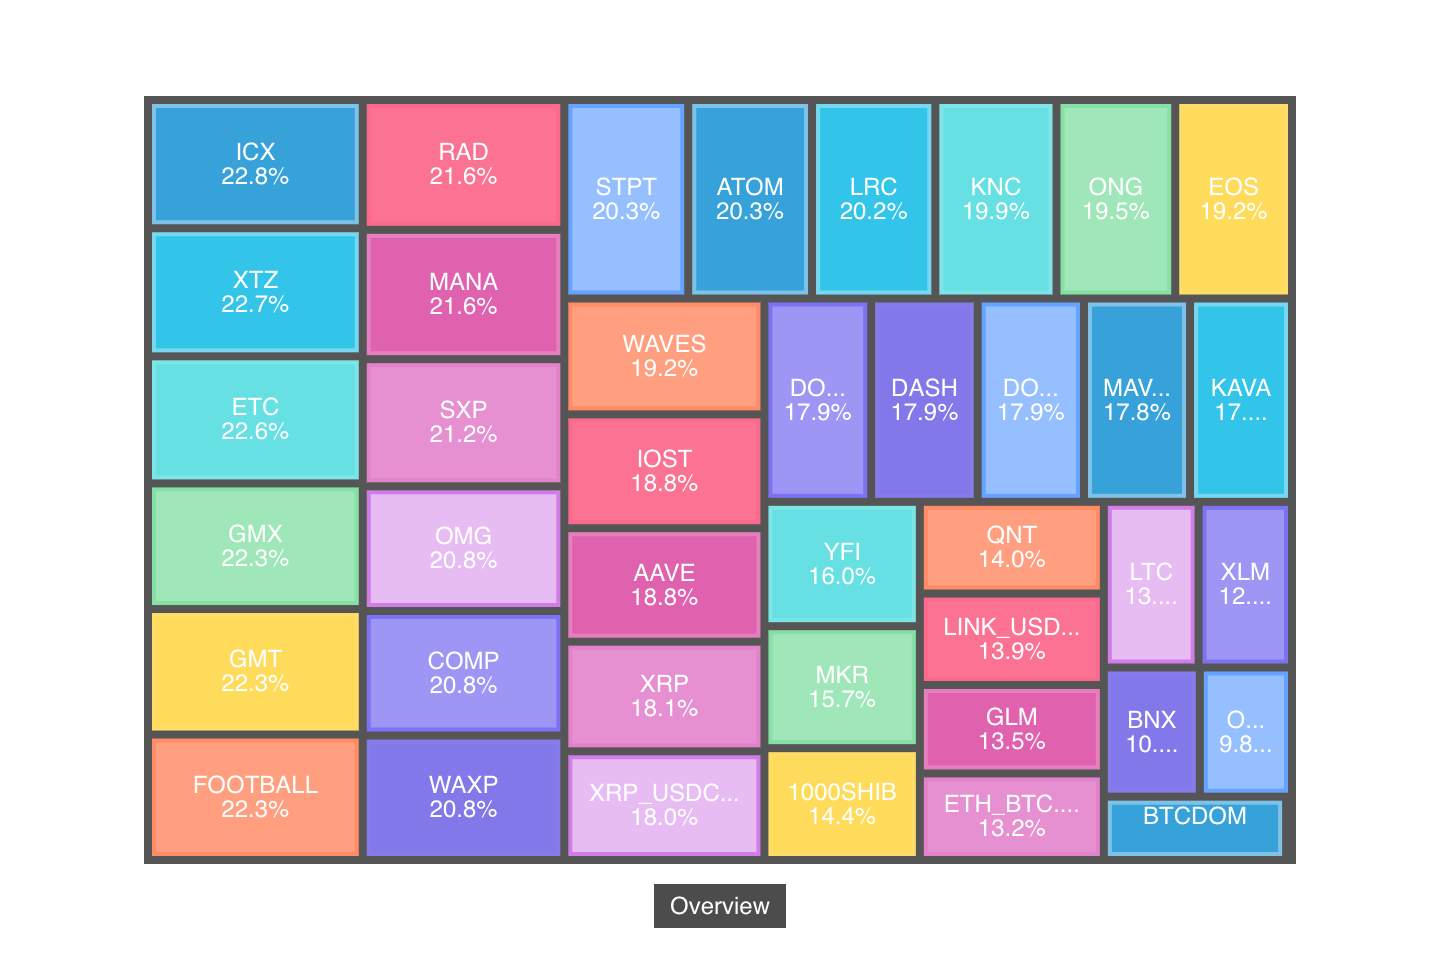
Data can be presented in a variety of visualizations in addition to the form of tables, and the data can be presented in a more vivid way after setting some relevant settings for visualization.
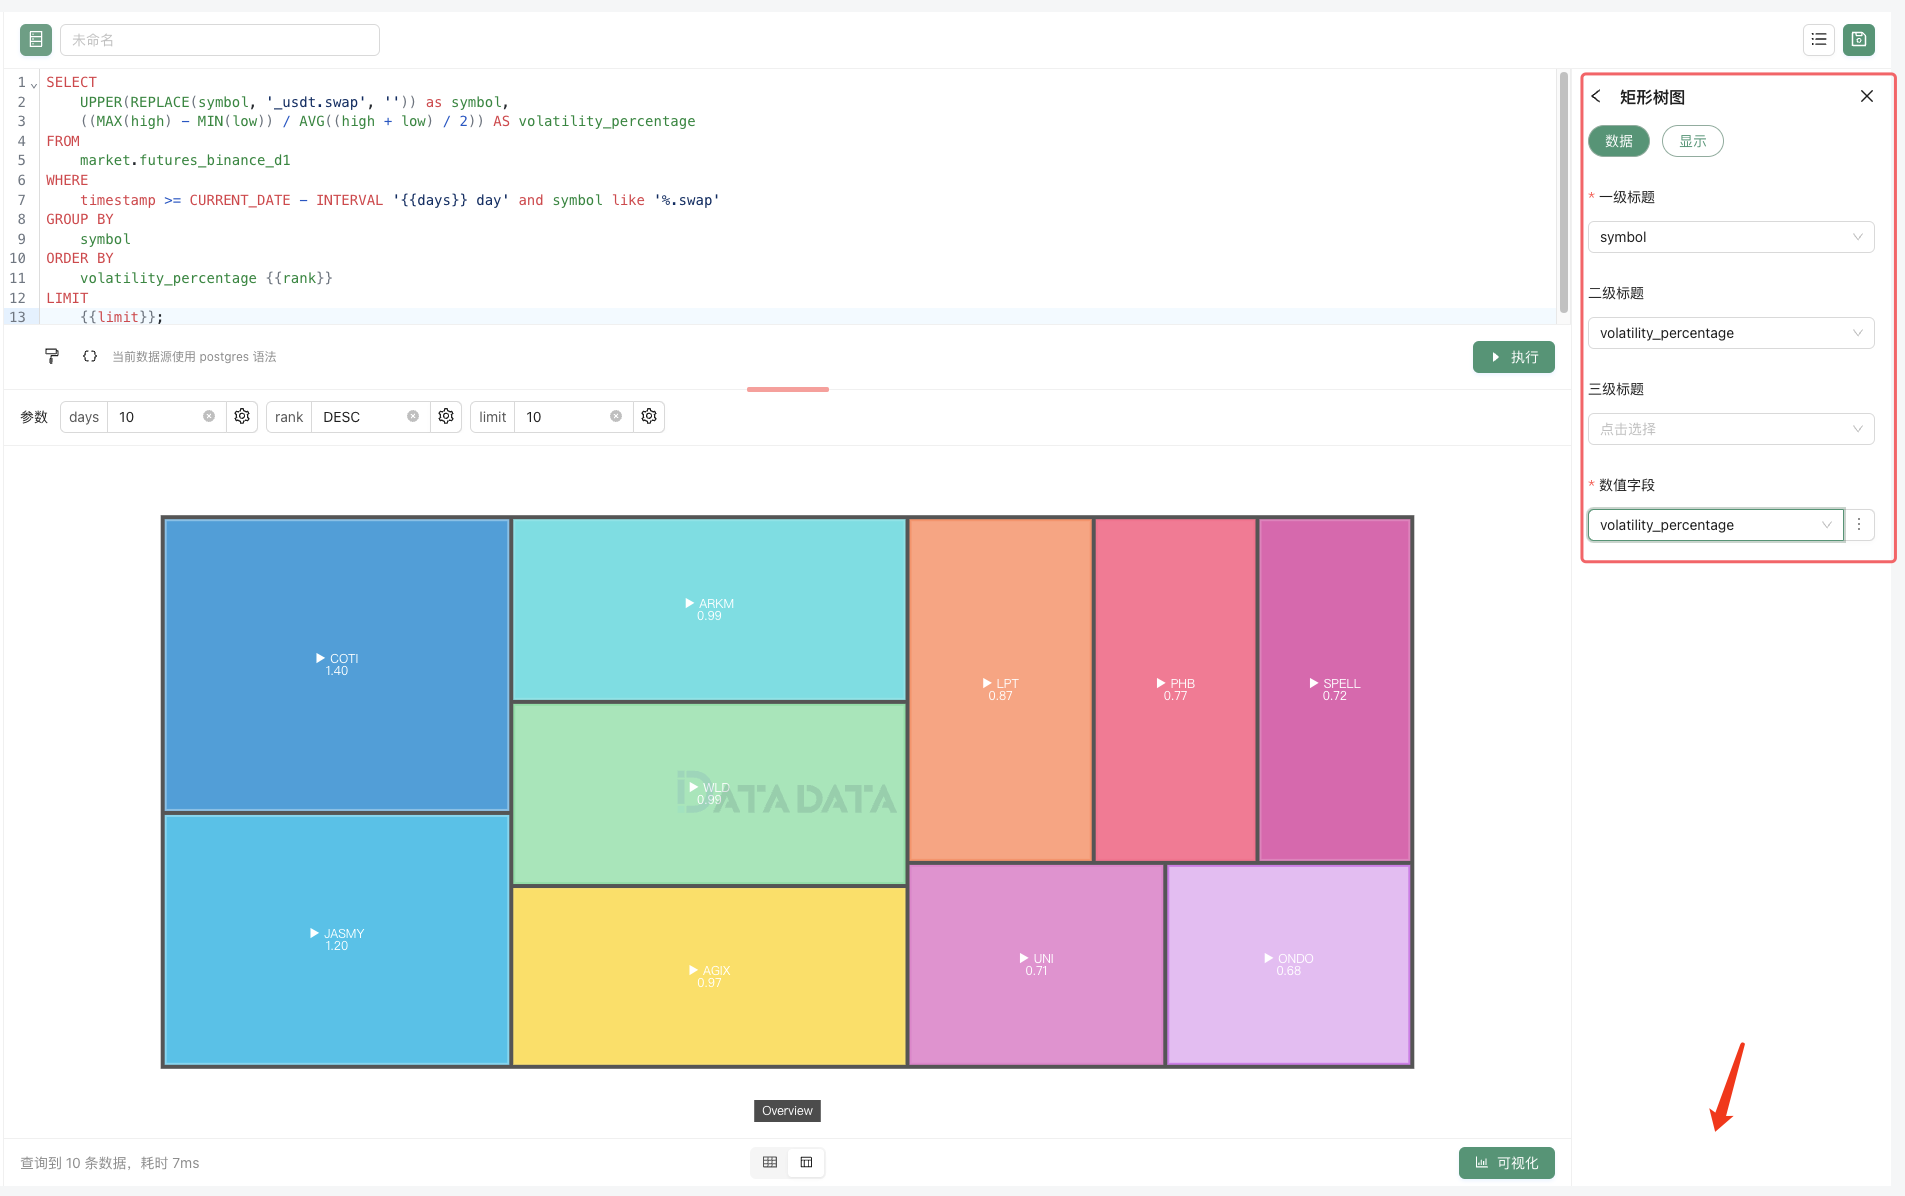
The query created can also generate connections for easy sharing, and can also modify parameters, update queries (here you can try to modify parameters update queries).
Deep playback
Next, we'll learn an example of a market microscope, which is a great tool for studying the details of high-frequency trading.
select * from market.binance where symbol = lower('{{symbol}}') order by timestamp desc limit 2000
Use the above SQL statement to query a variety of Tick-level market data.

The SQL query in this example is very simple, simply querying Tick data from a variety of binance exchanges (as specified by the parameter symbol).
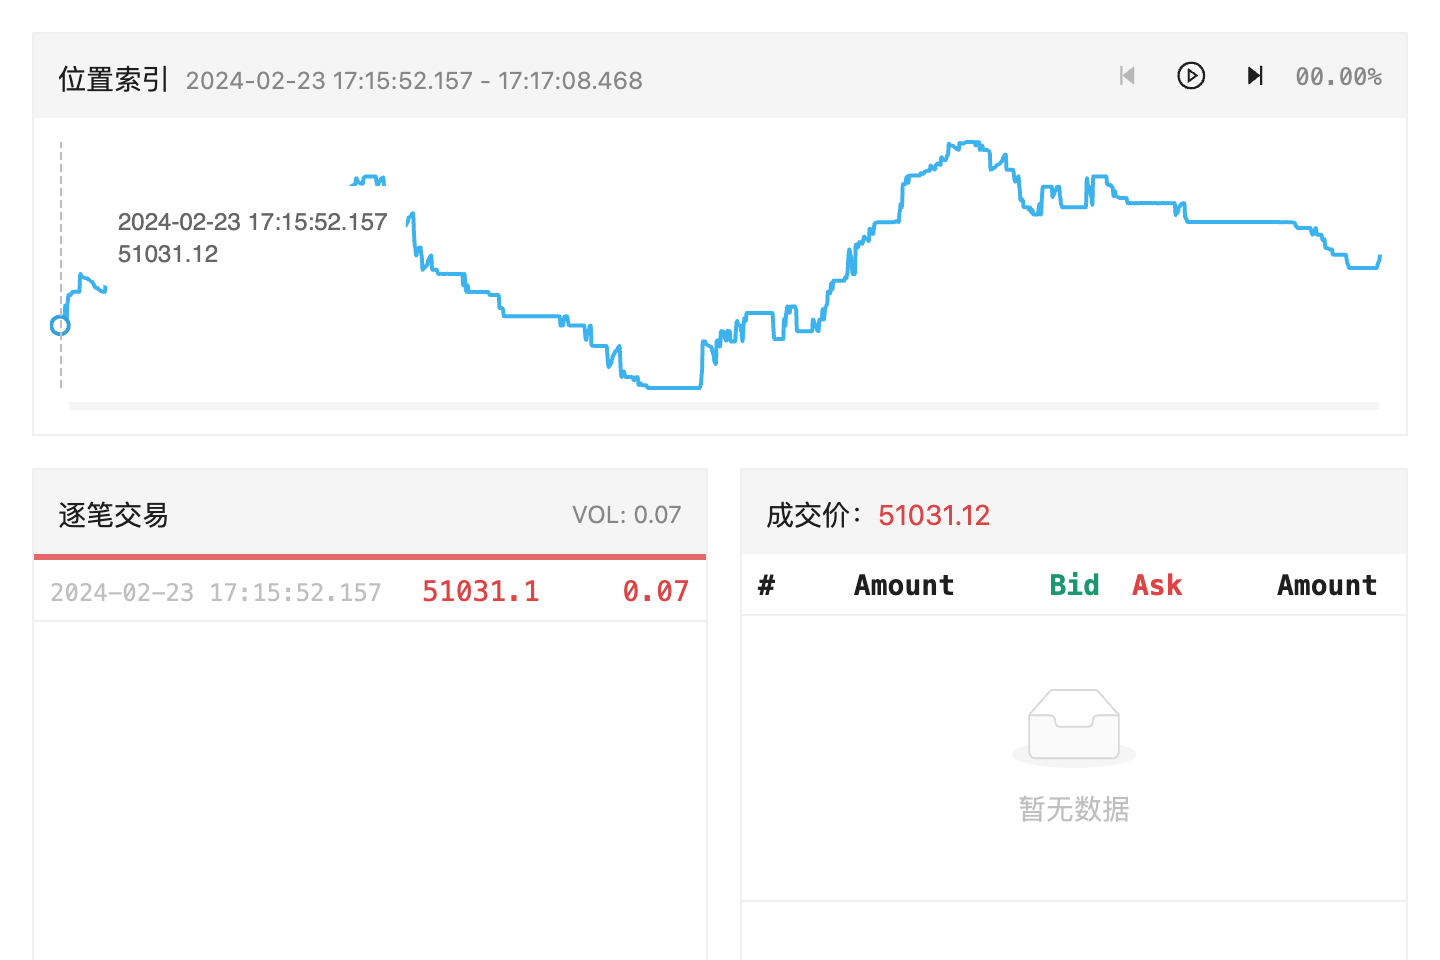
The main thing is to play the data in real disk form, in chronological order, and show it in multiple graphs:
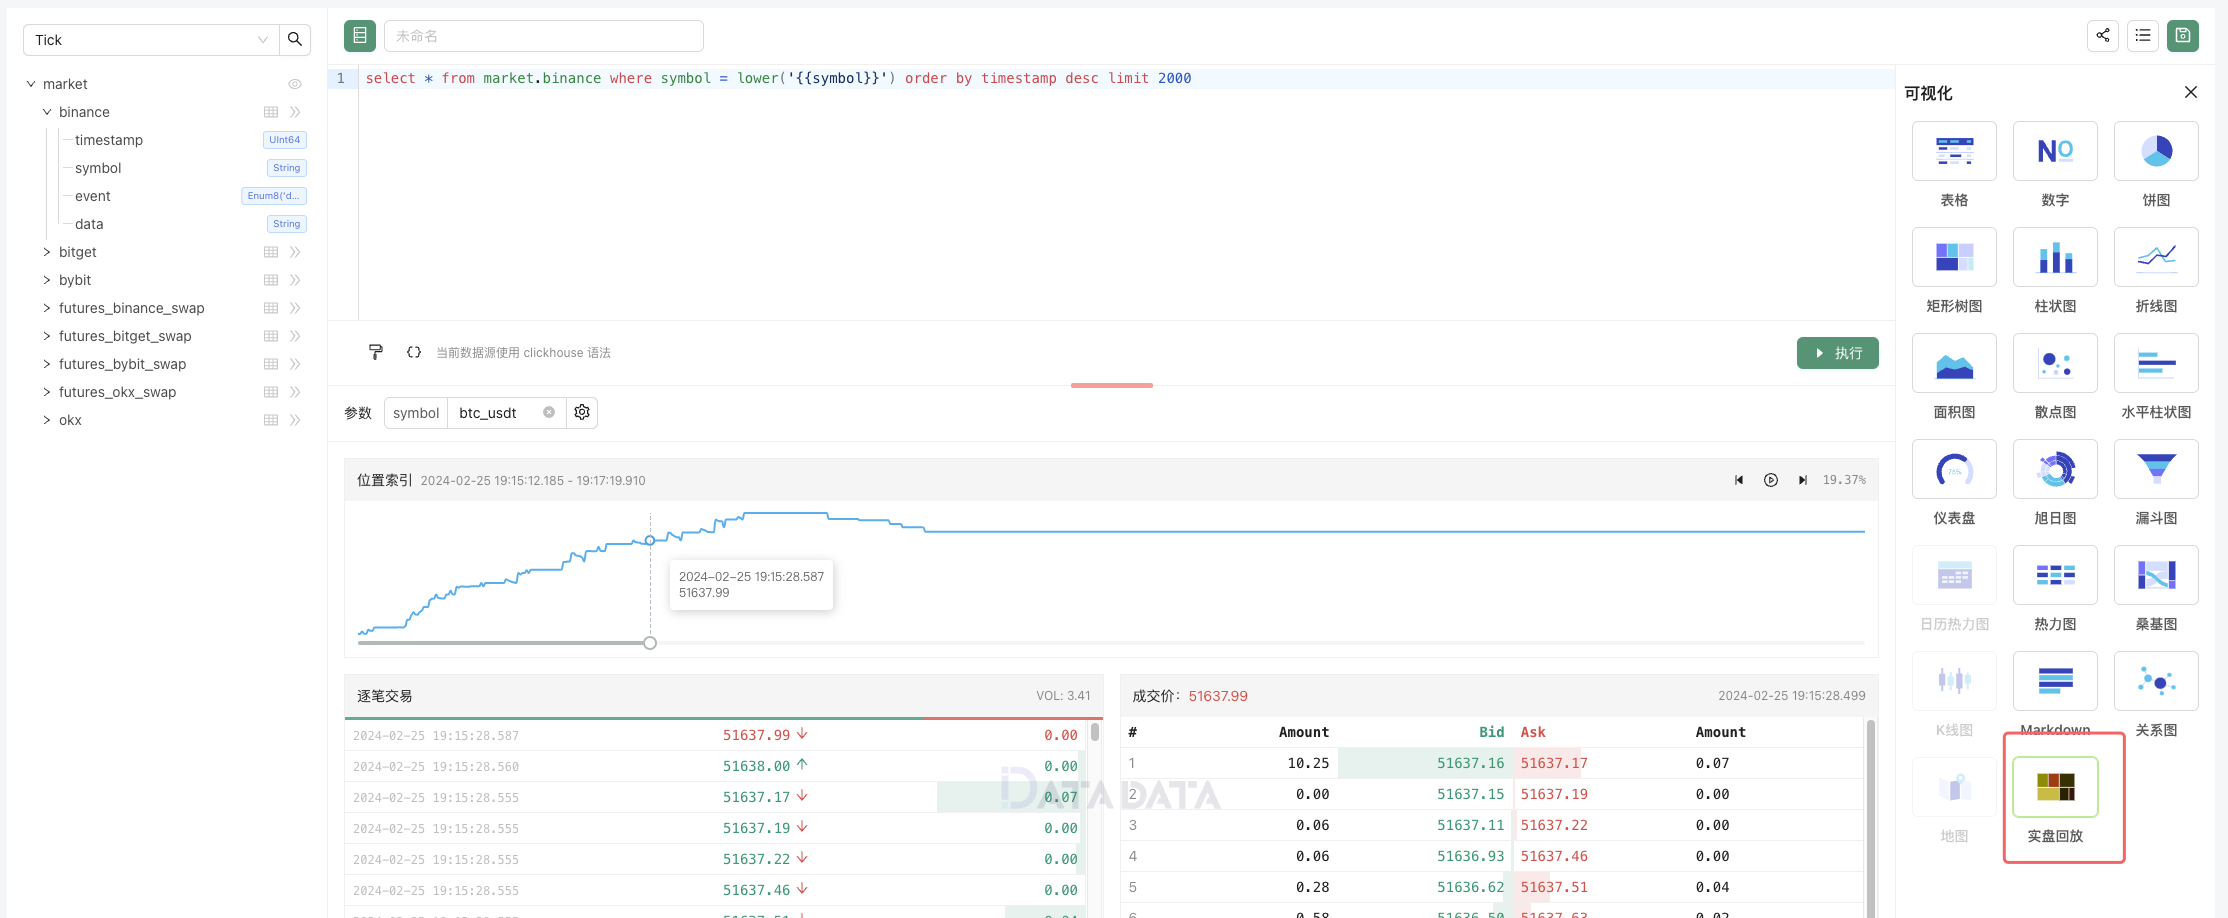
Is it convenient to study the details of the dishes?
Next we'll see how to share our research, and you can click on the share icon in the top right corner.
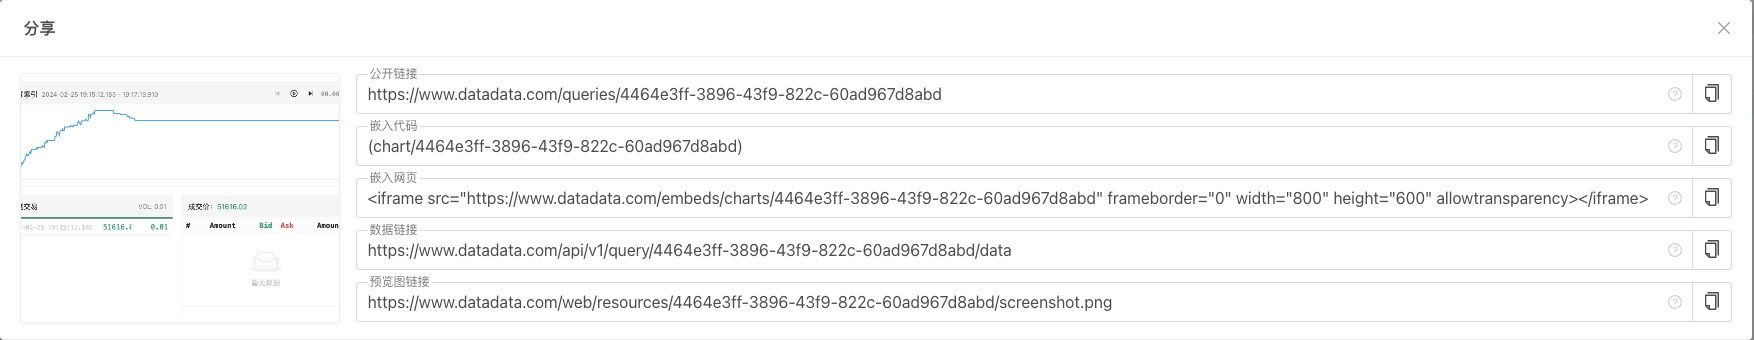
These shared codes, links, can be embedded in FMZ's community posts, articles, web pages, and can be transferred to other communities, forums, etc. They can also be shared directly with anyone.
What are you waiting for, this powerful quantitative trading tool? Hurry up and try to mine data, analyze data.
- Quantifying Fundamental Analysis in the Cryptocurrency Market: Let Data Speak for Itself!
- Quantified research on the basics of coin circles - stop believing in all kinds of crazy professors, data is objective!
- Mastering Everything - Introduction to FMZ New Version of Trading Terminal (with TRB Arbitrage Source Code)
- Get all the details about the new FMZ trading terminal (with the TRB suite source code)
- FMZ Quant: An Analysis of Common Requirements Design Examples in the Cryptocurrency Market (II)
- How to Exploit Brainless Selling Bots with a High-Frequency Strategy in 80 Lines of Code
- FMZ quantification: common demands on the cryptocurrency market design example analysis (II)
- How to exploit brainless robots for sale with high-frequency strategies of 80 lines of code
- FMZ Quant: An Analysis of Common Requirements Design Examples in the Cryptocurrency Market (I)
- FMZ quantification: common demands of the cryptocurrency market design instance analysis (1)
- WexApp, the FMZ Quant Cryptocurrency Demo Exchange, is Newly Launched
- Detailed Explanation of Perpetual Contract Grid Strategy Parameter Optimization
fmzeroIt's too strong!
lijingxfdjExcellent and improving