Calculation and application of DMI indicators
Author: The Little Dream, Created: 2019-07-03 14:03:53, Updated: 2023-10-25 20:00:58
Calculation and application of DMI indicators
Indicators
DMI指标又叫动向指标或趋向指标,其全称叫“Directional Movement Index,简称DMI”,
也是由美国技术分析大师威尔斯·威尔德(Wells Wilder)所创造的,是一种中长期股市技术分析(Technical Analysis)方法。
DMI指标是通过分析股票价格在涨跌过程中买卖双方力量均衡点的变化情况,
即多空双方的力量的变化受价格波动的影响而发生由均衡到失衡的循环过程,从而提供对趋势判断依据的一种技术指标。
-
Calculation of indicators
Recently, a number of friends in the quantitative circle have asked me how to use the DMI indicator on the inventor's quantitative trading platform. I started thinking it was a simple problem, and I opened the API documentation to search for this indicator function. I found out that the omnipotent talib indicator library does not have this indicator. It was found that this indicator is made up of a combination of four indicators, the algorithm is not very complex, just write it according to the algorithm in the data.
Example address:https://www.fmz.com/strategy/154050
-
Please post the indicator source code.
// 指标函数 function ADX(MDI, PDI, adx_period) { if(typeof(MDI) == "undefined" || typeof(PDI) == "undefined"){ return false } if(MDI.length < 10 || PDI.length < 10){ return false } /* DX = abs(DIPlus-DIMinus) / (DIPlus+DIMinus)*100 ADX = sma(DX, len) */ var dx = [] for(var i = 0; i < MDI.length; i++){ if(!MDI[i] || !PDI[i]){ continue } var dxValue = Math.abs((PDI[i] - MDI[i])) / (PDI[i] + MDI[i]) * 100 var obj = { Close : dxValue, } dx.push(obj) } if(dx.length < adx_period){ return false } var adx = talib.SMA(dx, adx_period) return adx } function DMI(records, pdi_period, mdi_period, adxr_period, adx_period) { var recordsHLC = [] for(var i = 0; i < records.length ; i++){ var bar = { High : records[i].High, Low : records[i].Low, Close : records[i].Close, } recordsHLC.push(bar) } var m_di = talib.MINUS_DI(recordsHLC, mdi_period) var p_di = talib.PLUS_DI(recordsHLC, pdi_period) var adx = ADX(m_di, p_di, adx_period) // ADXR=(当日的ADX+前n日的ADX)÷2 var n = 0 var adxr = [] for (var j = 0 ; j < adx.length; j++) { if (typeof(adx[j]) == "number") { n++ } if (n >= adxr_period) { var currAdxr = (adx[j] + adx[j - adxr_period]) / 2 adxr.push(currAdxr) } else { adxr.push(NaN) } } return [m_di, p_di, adx, adxr] } -
The contrast
Using the inventor's quantized drawing line library, it is easy to draw a graph that can be compared to other DMI on the graph below
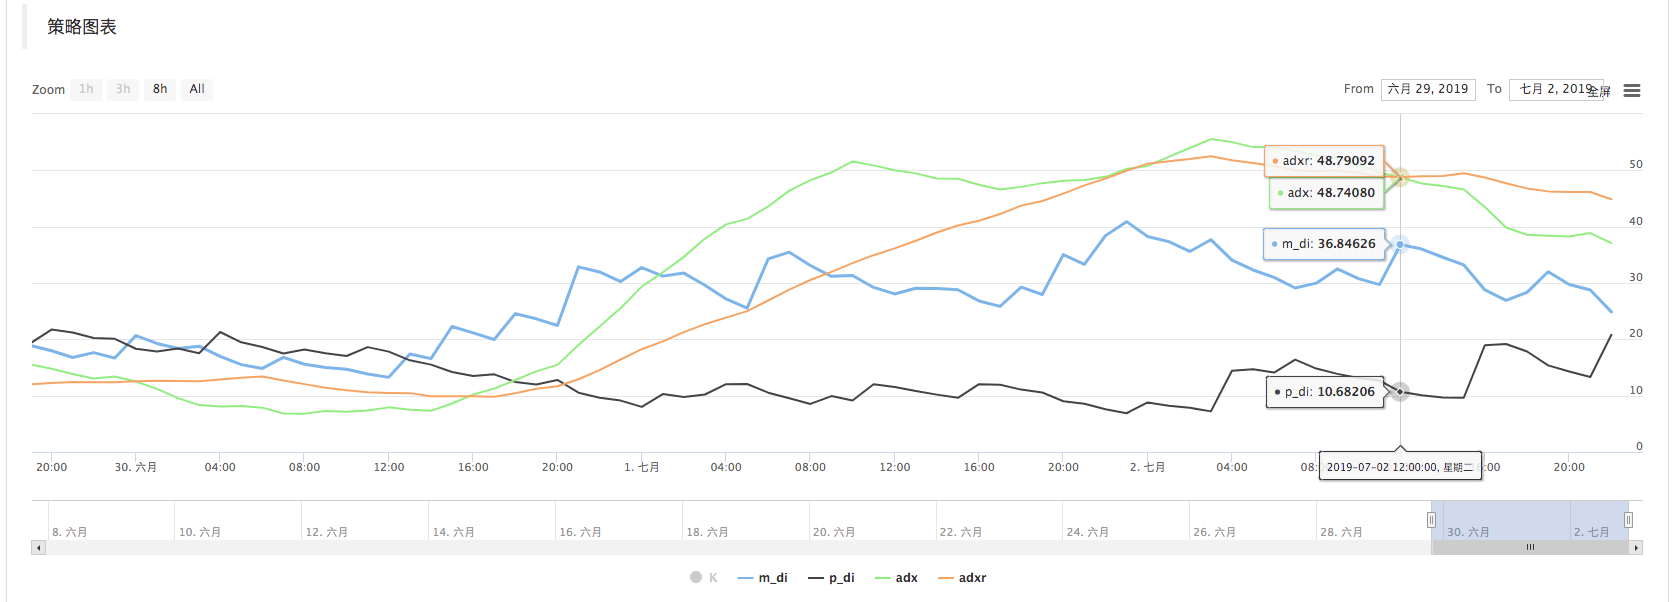
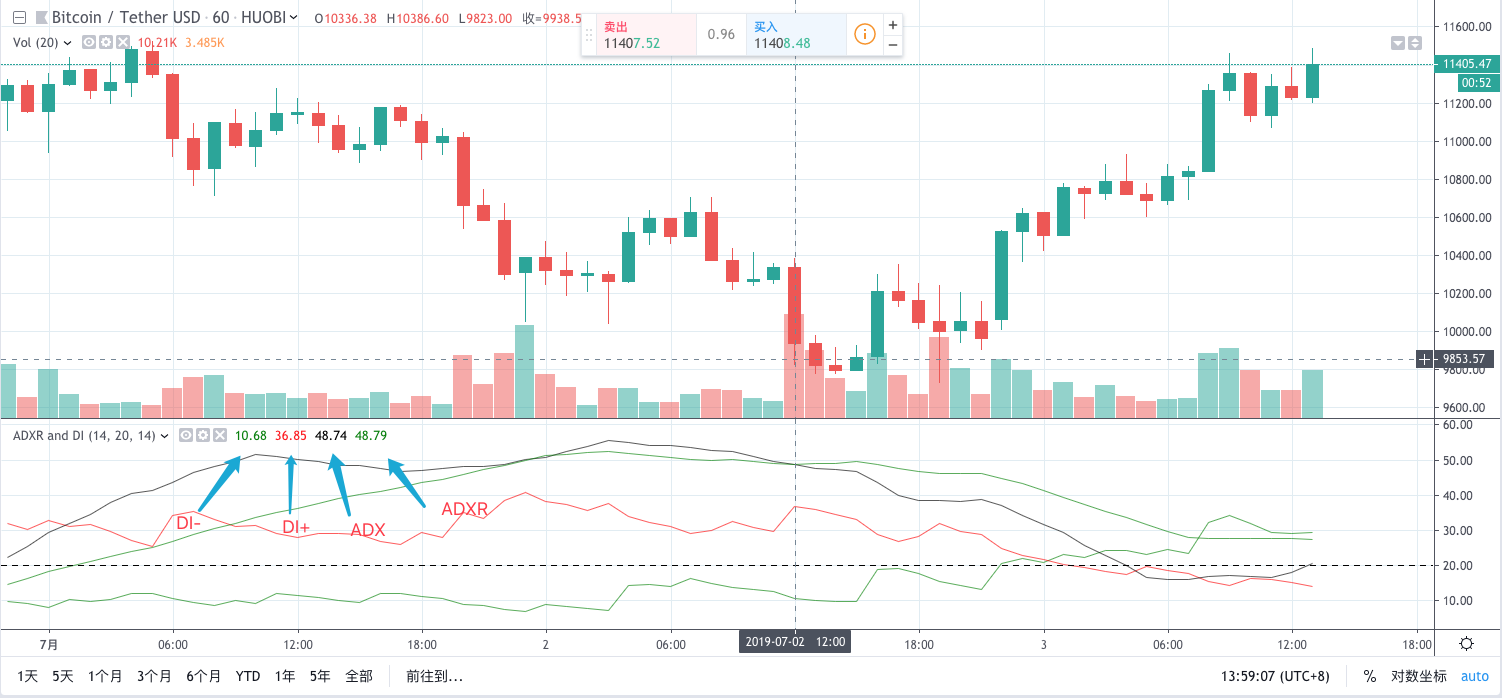
Comparing the indicator values on several Kbars, the values are basically the same (a slight four-fifths deviation).
-
Use
Directly using the DMI function (e.g. how to call the main function in the example), the K-line data is transmitted, and the indicator parameter is set, usually 14. The function returns a two-dimensional array of data representing four lines.
- DI- : m_di,
- DI+ : p_di,
- ADX : adx,
- ADXR: adxr,
In the DMI indicator, these four lines, of which DI-, DI+ are multi-space indicators, represent the strength of both multi-space indicators. ADX and ADXR are a pair of indicator lines used as a trend indicator, reflecting the current market trends and directions.
The higher the value of DI+, the stronger the current market, and the weaker the current market. DI-, indicator is opposite. DI+, DI- are often intertwined, and the closer the numbers are, the more likely the market is in a stalemate.
-
The signal
1, search for the bottom.
After a long-term decline, if the following conditions are met in the short-term, the short-term bottom has been identified and there may be a rebound or reversal of the over-fall.
-
1, the DI+ line, representing the multihead force, is below 10, at the over-drop position and the upward curve, and the DI+ line is at the high position.
-
2, the ADX line representing the trend is at a higher position above 65 and bends downward and forms a dead fork with the ADXR line.
2, the dome
After a long-term uptrend, a short-term peak has been identified and a short-term adjustment or reversal may occur if the following conditions are met in the short-term:
-
1, the DI line, which represents the head force, is below 10, is low and curves up, and the DI+ line is high.
-
2, the ADX line representing the trend is at a higher position above 65 and bends downward and forms a dead fork with the ADXR line.
3 The Rise
After a period of fluctuation, the four DMI indicator lines wrap around each other at low levels, and then suddenly a long k-line with a gain of more than 5% of the volume appears. The DI+ line passes through the DI-line, ADX line and ADXR line consecutively for two days, representing a new uptrend.
-
- Quantifying Fundamental Analysis in the Cryptocurrency Market: Let Data Speak for Itself!
- Quantified research on the basics of coin circles - stop believing in all kinds of crazy professors, data is objective!
- The inventor of the Quantitative Data Exploration Module, an essential tool in the field of quantitative trading.
- Mastering Everything - Introduction to FMZ New Version of Trading Terminal (with TRB Arbitrage Source Code)
- Get all the details about the new FMZ trading terminal (with the TRB suite source code)
- FMZ Quant: An Analysis of Common Requirements Design Examples in the Cryptocurrency Market (II)
- How to Exploit Brainless Selling Bots with a High-Frequency Strategy in 80 Lines of Code
- FMZ quantification: common demands on the cryptocurrency market design example analysis (II)
- How to exploit brainless robots for sale with high-frequency strategies of 80 lines of code
- FMZ Quant: An Analysis of Common Requirements Design Examples in the Cryptocurrency Market (I)
- FMZ quantification: common demands of the cryptocurrency market design instance analysis (1)
- Industry giant reveals algorithmic trading: inventors quantify platforms as market strategy
- An intraday trading strategy using the mean value return between SPY and IWM
lonelymanAs if we knew each other
wuzhenyuvCan you write a trend-judging strategy based on DMI?
The Little DreamWell, there is time to write an example.