Digital currency adaptive even-line trading system and KAMA algorithm solver based inventor-based quantitative trading software
Author: , Created: 2019-07-06 16:21:15, Updated: 2023-10-24 21:42:44[TOC]

Adaptation to the medium line KAMA
As the name implies, the KAMA belongs to the category of moving averages, but unlike traditional moving averages, it is very smart. We know that the average average has many disadvantages, such as: short-term averages are close to price movements, very sensitive, but easy to generate false signals; long-term averages are very accurate in trend judgments, but often the market has gone a step, it reacts only.
KAMA's brilliance lies in its ability to adjust its sensitivity to the current market conditions, i.e. the volatility rate. Its manifestation is that KAMA slows down significantly in a volatile market and reacts quickly when a trend comes up.
KAMA in the graph
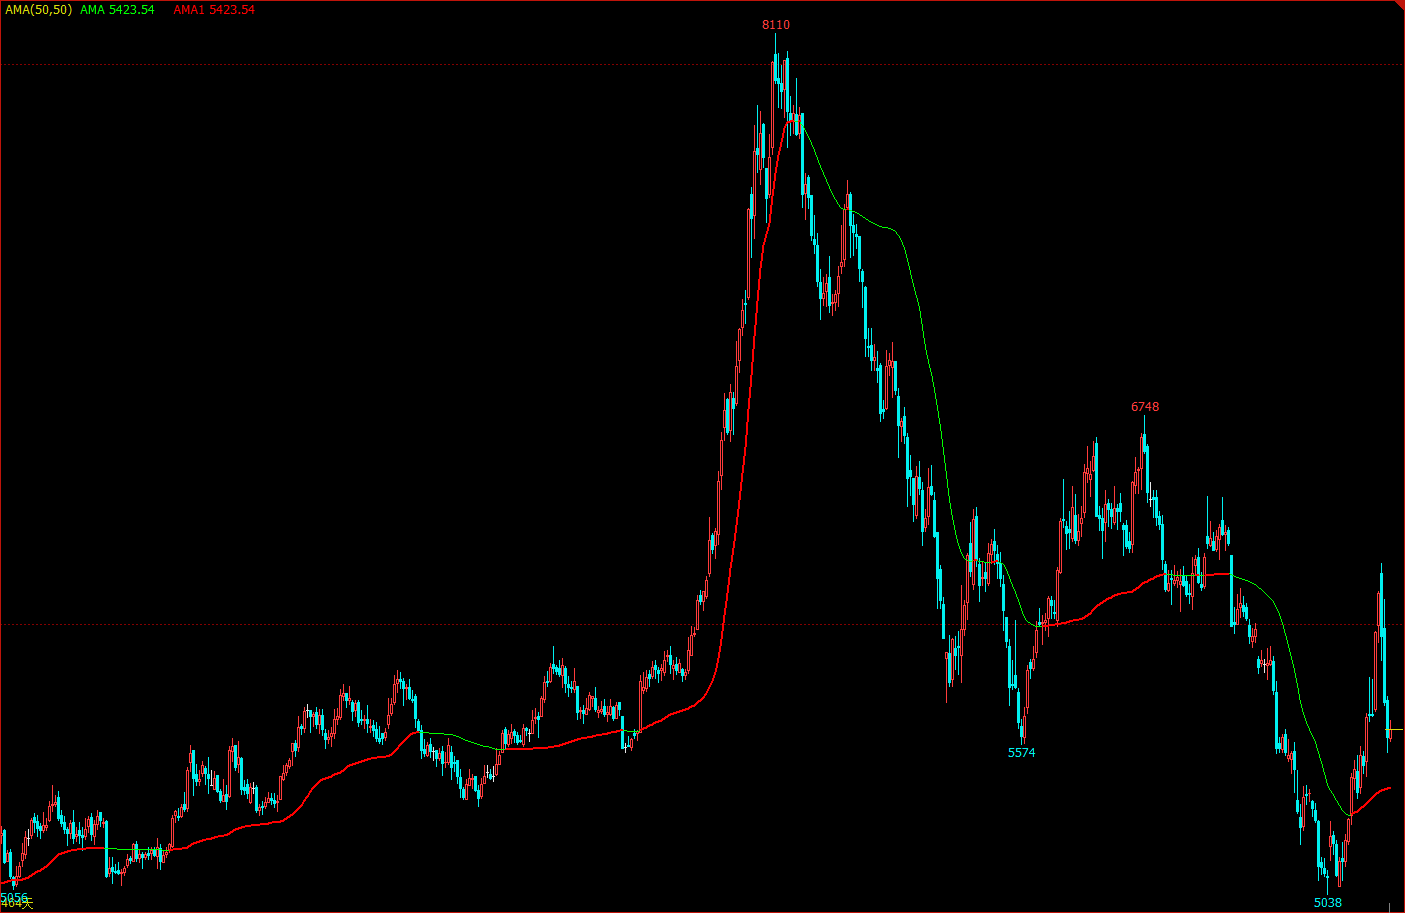
The calculation method of KAMA
- Direction ((DIR) = closing price - closing price before n days
- Volatility rate ((VIR) = sum ((abs ((closing price - closing price of the previous trading day), n)
- Efficiency (ER) = direction / rate of fluctuation
- So fast is equal to 2 over (n1 + 1)
- Slowing is equal to 2 over (n2 + 1)
- Smoothness (CS) = efficiency * (fast - slow) + slow
- Coefficient ((CQ) = smooth * smooth
- KAMA = index-weighted average ((dynamic moving average ((closing price, coefficient), 2)
In these, n, n1, n2 are the periodic parameters, where by default n is 10, n1 is the short-term periodic number, and n2 is the long-term periodic number 30. This is also a set of parameters identified by KAMA author Perry Kaufman.
The calculation method of KAMA is: first calculate the direction (DIR) and the volatility (VIR), then calculate the efficiency in proportion to both. Efficiency (ER) is a measure of the degree of price change, and the calculation method is simple: direction/volatility. The result is between 0 and 1, with the closer the ER value to 0 indicating that the market is in a state of volatility, and the closer the ER value to 1 indicating that the market is in a state of trend.
When calculating efficiency (ER), we can combine the fast averages and the slow averages to derive the smooth constant (CS): efficiency * (fast - slow) + slow speed. CS represents the speed at which the trend is running, and according to the calculation formula of CS, we can find that the change in CS is always proportional to the change in ER.
The coefficient (CQ) is then calculated based on the smooth multiplier, with the aim of making the slow cycle parameter play a more important role in the calculation, which is also a more conservative approach. The final smoothness of KAMA is determined by the coefficient (CQ), which in KAMA's calculation determines the last two equally smooth cycle parameters, i.e. the index-weighted average (DMA), the closing price, the coefficient, and 2);
How to use KAMA
Although the calculation method of KAMA is very complex, its use is similar to that of a normal average line, and in practical applications, it can be used not only to judge the market trend, but also to accurately buy and sell points. Since it is very clever, it can be used in many trading strategies, even in digital currencies.
- When the price is higher than KAMA, and KAMA is higher, a multi-head position is opened.
- When the price is less than KAMA and KAMA is down, the short is opened.
- When the price is lower than KAMA, or KAMA is downward, a multi-head placement occurs.
- When the price is higher than KAMA, or higher than KAMA, the blank heads.
Build trading strategies based on KAMA
Step one: Calculate KAMANote! In the upper left corner, select the programming language:My语言│KAMA is already available in the talib library, but it has only one external parameter ((n) cycle, n1 and n2 are already defaulted to 2 and 30│ the strategy in this article is only for direct use of the drop-down bar, and a handy partner can also write haha himself│ then in My language it can also be directly mixed with JavaScript language, note the following code:
%%  // My语言内JavaScript的标准格式
scope.KAMA = function() {
    var r = _C(exchange.GetRecords);  // 获取K线数组
    if (r.length > 140) {  // 过滤K线长度
        var kama = talib.KAMA(r, 140);  // 调用talib库计算KAMA
        return kama[kama.length - 2];  // 返回KAMA的具体数值
    }
    return;
}
%%  // My语言内JavaScript的标准格式
Step 2: Calculate the terms of the transaction and place an order
%%
scope.KAMA = function() {
    var r = _C(exchange.GetRecords);
    if (r.length > 140) {
        var kama = talib.KAMA(r, 140);
        return kama[kama.length - 2];
    }
    return;
}
%%

K^^KAMA;  // 把KAMA打印到图表上
A:CLOSE;  // 把收盘价打印到图表上

K > REF(K, 1) && CLOSE > K,BK;  // 开多
K < REF(K, 1) && CLOSE < K,SK;  // 开空
K < REF(K, 1) || CLOSE < K,SP;  // 平多
K > REF(K, 1) || CLOSE > K,BP;  // 平空
Step 3: Set up a policy for filtering signals
%%
scope.KAMA = function() {
    var r = _C(exchange.GetRecords);
    if (r.length > 140) {
        var kama = talib.KAMA(r, 140);
        return kama[kama.length - 2];
    }
    return;
}
%%

K^^KAMA;
A:CLOSE;

K > REF(K, 1) && CLOSE > K,BK;
K < REF(K, 1) && CLOSE < K,SK;
K < REF(K, 1) || CLOSE < K,SP;
K > REF(K, 1) || CLOSE > K,BP;

AUTOFILTER;  // 启用一开一平信号过滤机制
Strategic retesting
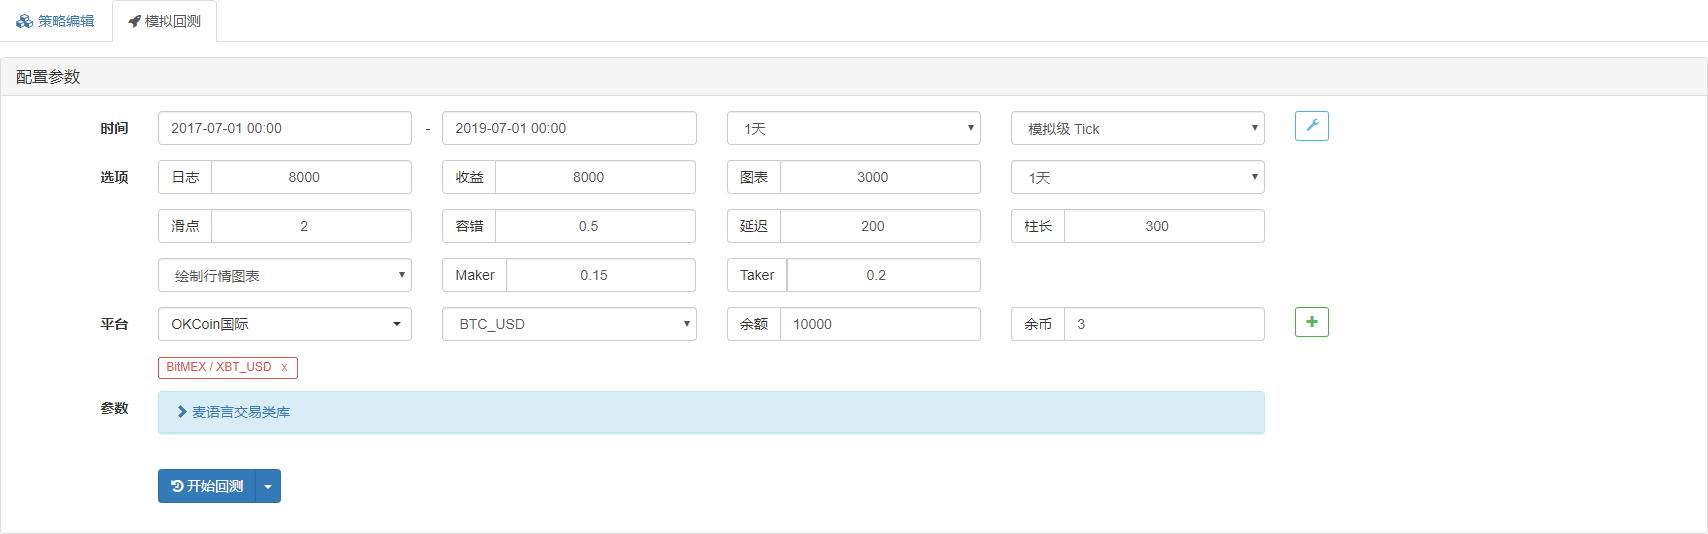
In order to get closer to the real trading environment, we used the slider at each of the 2 jumps to test the stress test in the retesting environment as follows:
- The exchange: BitMEX
- The following is a list of all the different ways XBTUSD is credited in the database:
- Trade varieties: XBTUSD
- Time: July 01, 2017 to July 01, 2019
- K-line cycle: dayline
- Slide point: 2 jumps to the open position
Testing environment
 Benefits are clear
 The funding curve
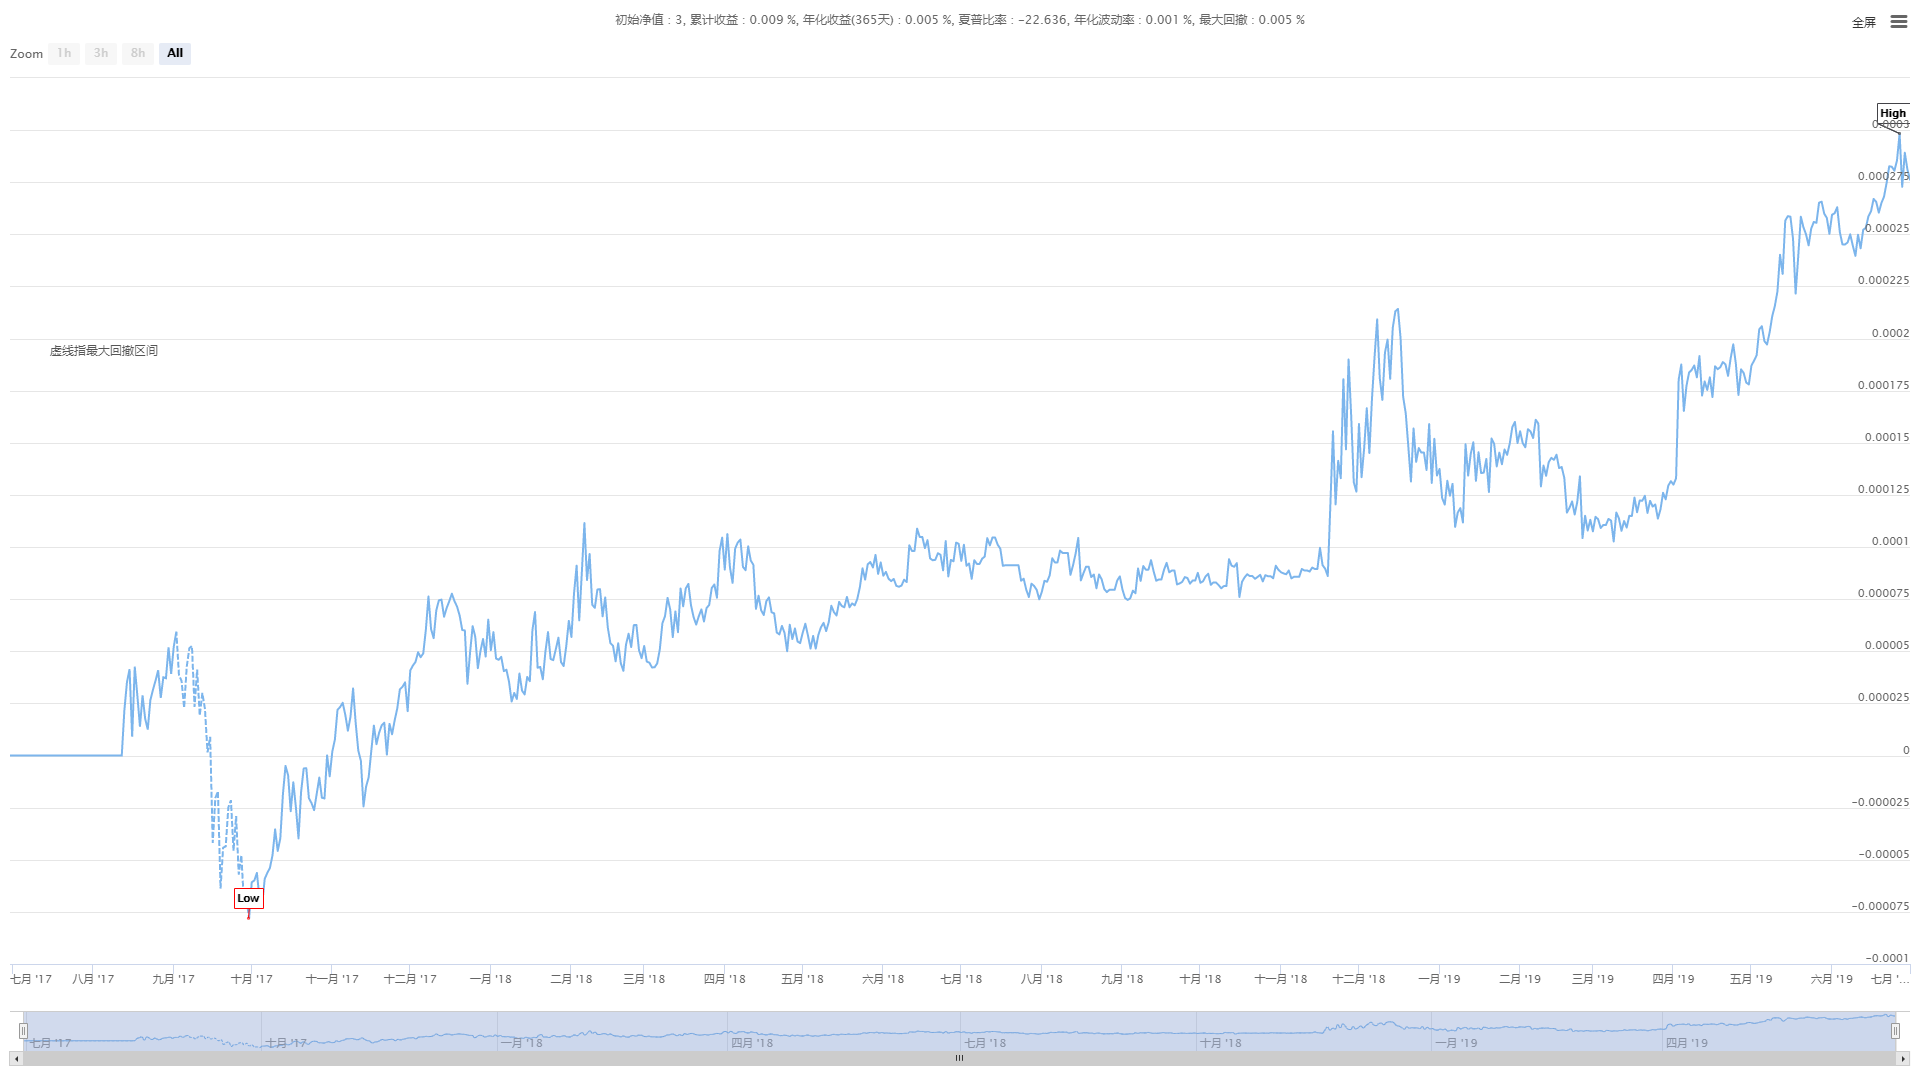
Judging from the above retrospective results, this simple KAMA strategy is certainly not promising, even in the digital currency's 2018 super bear market, the capital curve did not show a major pullback, and the market was in a long period of turmoil, and did not come back and flatten positions, causing unnecessary losses.
Policy source code
Summary
A good real-time strategy must be refined, and there is plenty of room for improvement, such as adding certain filtering conditions, proactive stop-loss conditions, etc. As a straight line, KAMA inherits the advantages and disadvantages of the normal straight line, while also raising it. In a volatile market, it is difficult to adapt to future trends even to fix the best parameter, so this random, randomly changing market change approach may be a better option.
- Quantifying Fundamental Analysis in the Cryptocurrency Market: Let Data Speak for Itself!
- Quantified research on the basics of coin circles - stop believing in all kinds of crazy professors, data is objective!
- The inventor of the Quantitative Data Exploration Module, an essential tool in the field of quantitative trading.
- Mastering Everything - Introduction to FMZ New Version of Trading Terminal (with TRB Arbitrage Source Code)
- Get all the details about the new FMZ trading terminal (with the TRB suite source code)
- FMZ Quant: An Analysis of Common Requirements Design Examples in the Cryptocurrency Market (II)
- How to Exploit Brainless Selling Bots with a High-Frequency Strategy in 80 Lines of Code
- FMZ quantification: common demands on the cryptocurrency market design example analysis (II)
- How to exploit brainless robots for sale with high-frequency strategies of 80 lines of code
- FMZ Quant: An Analysis of Common Requirements Design Examples in the Cryptocurrency Market (I)
- FMZ quantification: common demands of the cryptocurrency market design instance analysis (1)
- Visualizing modules to build trading strategies - a basic understanding
- FMZ inventors quantify platform feedback
xaifer48God, please tell me, how do you write the code for the last step of kama? Kama = index-weighted average (moving average) (closing price, coefficient), 2) is this. I searched and some say it is written as Kama = previous Kama + coefficient * (current price - previous Kama).