KENTNA channel upgraded version of the KENTNA kingkeltner strategy
Author: , Created: 2019-07-27 16:14:26, Updated: 2023-10-23 17:33:36[TOC]

How to get to Kintana
The Keltner channel is a trading system invented by Chester W. Keltner in the 1960s, with the central idea of linear equations. The system has achieved remarkable results over a very long period of time. Although the original Keltner channel system was not as effective when it first appeared, its core ideas have had a profound impact on the trading world to this day.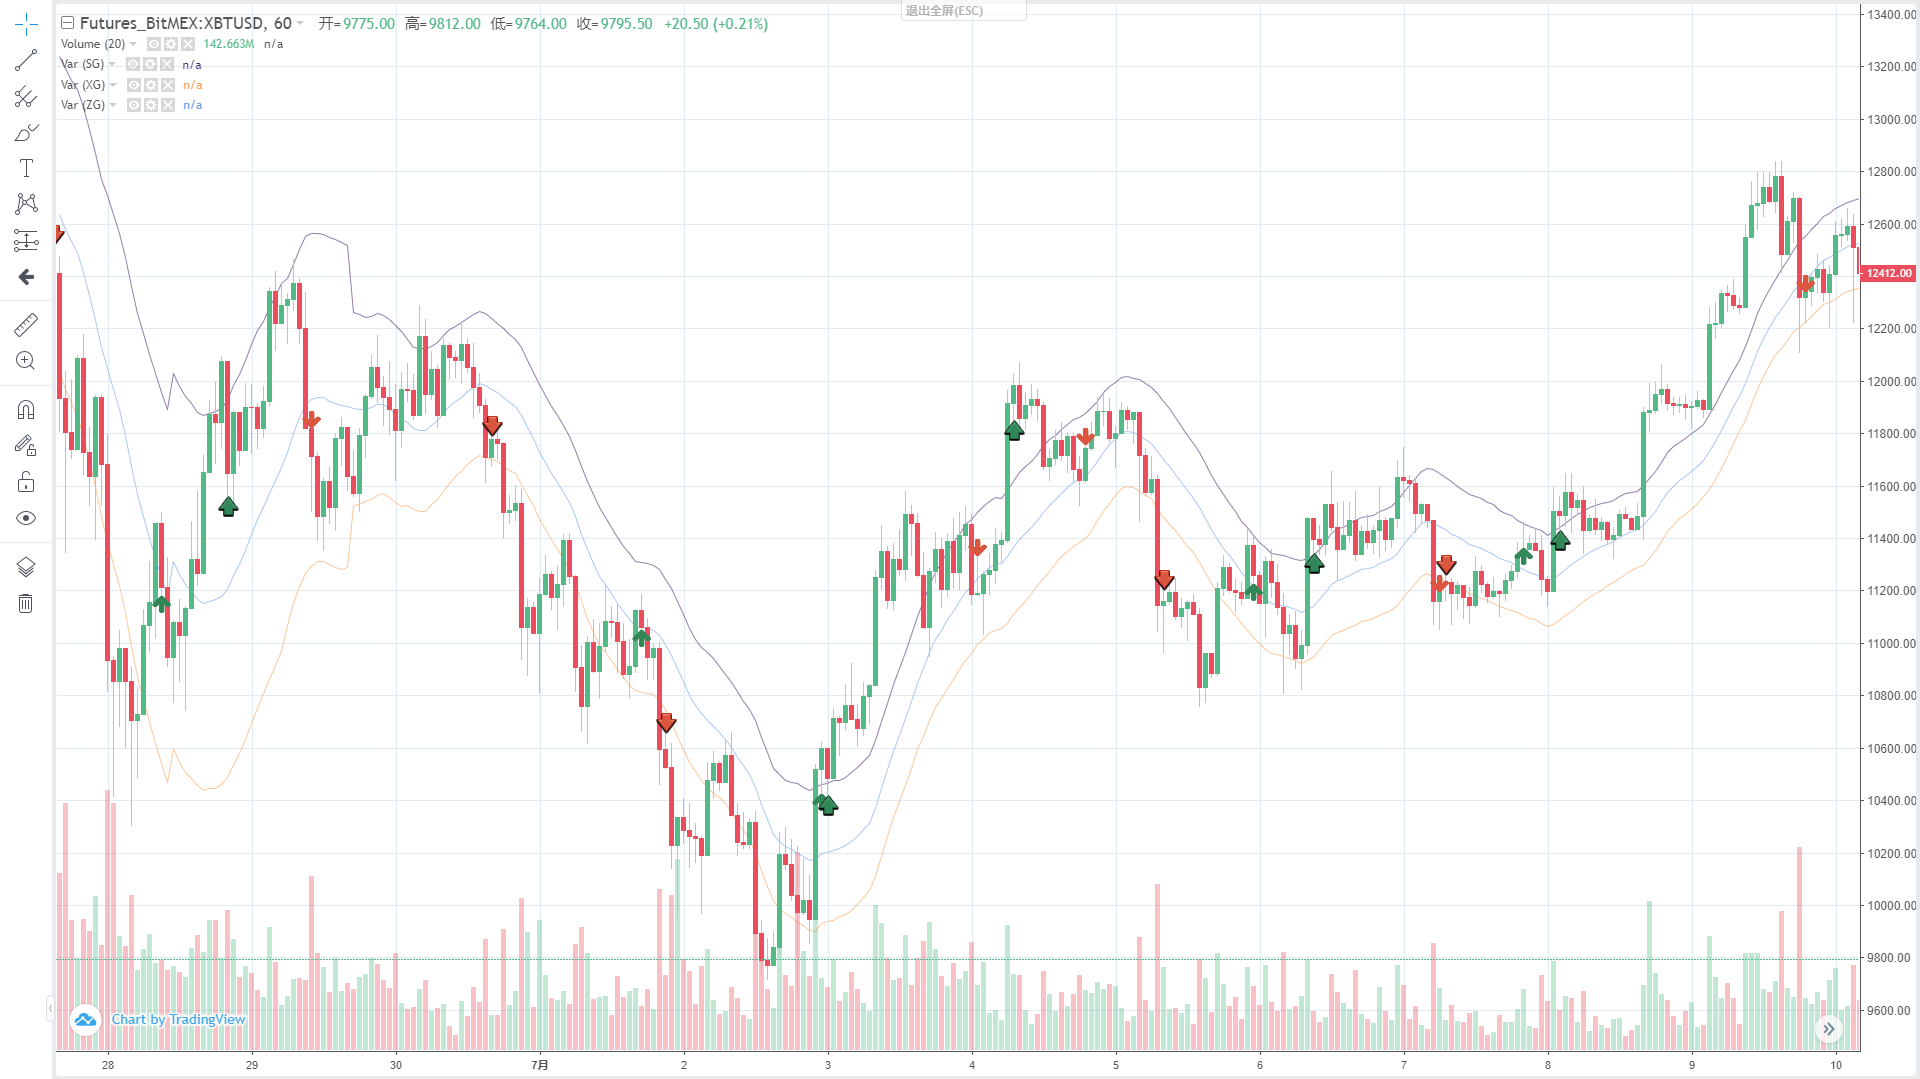
The principle of the Kenta Tunnel
When it comes to channel strategies, one might think of the famous Boll line, but the difference is that the Kenta line uses the average of the highest, lowest, and closing prices as a base price, and then calculates the N-cycle average of this base price, which is the mean of the Kenta line.
So, how does this amplitude of volatility be calculated? That is, the N-cycle average of the "highest price - lowest price", multiplied by a certain multiple. This way, you will find that it is similar to the Boll line, with a price trajectory and an upward trajectory calculated based on the price trajectory.
Calculation of the Cantonal Tunnel
- Base price: (highest price + lowest price + closing price) / 3
- Mid-track: N-cycle moving average of the underlying price
- The range of the fluctuation: highest price - lowest price
- On track: mid-track + amplitude of oscillation * multiples
- Lower track: mid-track - amplitude of oscillation * multiples
The upgraded version of King Kentner
Later, the Kettner channel was improved by Linda Raschke. Linda Raschke is a well-known American commodity futures trader and president of LBR Asset Management. The original Kettner trajectory was an ordinary straight line, changed to an index average.
- Base price: (highest price + lowest price + closing price) / 3
- Mid-track: N-cycle moving average of the underlying price
- Variable amplitude: mean true amplitude (ATR)
- Upper track: mid-track + amplitude of oscillation
- Downstream: Midstream - amplitude of the fluctuation
Kenta channel trading strategy
We know that prices don't always operate in a trend or turbulent way, but rather in a way that the trend and turbulence do not alternate completely randomly. So Kentner uses the channel as a dividing line to separate the trend and turbulent markets. When prices operate between up and down the track, we can think of it as a turbulent market.
The entrance
- The price of the train is going up, and the price is going up, and more orders are coming in.
- The price is falling, and the price is falling, and the order is empty.
The appearance
- The price drops below the mid-range when holding multiple orders, and the price drops when holding multiple orders.
- When holding a blank order, the price rises above the mid-range, flat the blank order;
Kim Kentner's strategy for my language
Using the above trading logic, we can build this strategy on the inventor's quantized trading platform.fmz.com> Login > Control Center > Policy library > Create new policies > Click the drop-down box in the upper-left corner to select My language to start writing the policy, see the notes in the code below.
// 参数
MAN:=20;
ATRN:=50;

JG:=(HIGH+LOW+CLOSE)/3;  // 基础价格
ZG:MA(JG,MAN);  // 中轨
TRUEHIGH1:=IF(HIGH>REF(C,1),HIGH,REF(C,1));
TRUELOW1:=IF(LOW<=REF(C,1),LOW,REF(C,1));
TRUERANGE1:=IF(ISLASTBAR,H-L,TRUEHIGH1-TRUELOW1);  // 计算真实波动幅度
SG:ZG+MA(TRUERANGE1,ATRN);  // 上轨
XG:ZG-MA(TRUERANGE1,ATRN);  // 下轨

ZG>REF(ZG,1)&&C>SG,BK;  // 中轨向上,并且价格升破上轨,开多单
C<ZG,SP;  // 持有多单时,价格跌破中轨,平多单
ZG<REF(ZG,1)&&C<XG,SK;  // 中轨向下,并且价格跌破下轨,开空单
C>ZG,BP;  // 持有空单时,价格升破中轨,平空单
AUTOFILTER;  // 设置信号过滤方式
King Kentner's strategy is reviewed
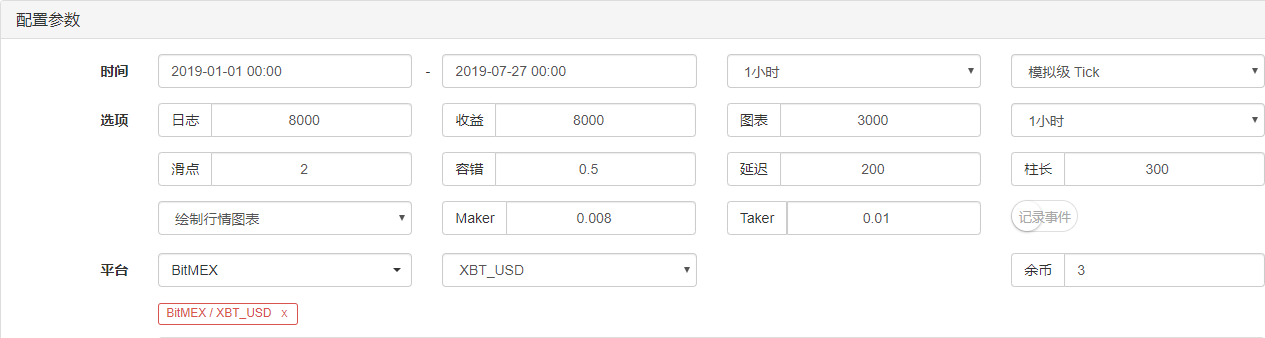
In order to get closer to the real trading environment, we used a stress test with 2 jumps in the open position and 2 times the transaction fees in the retest, testing the environment as follows:
- The exchange: BitMEX
- Trade varieties: XBTUSD
- Time: January 01, 2019 to July 27, 2019
- Cycle: One hour
- Slide point: 2 jumps to the open position
- Fee: Exchange doubled
Testing environment
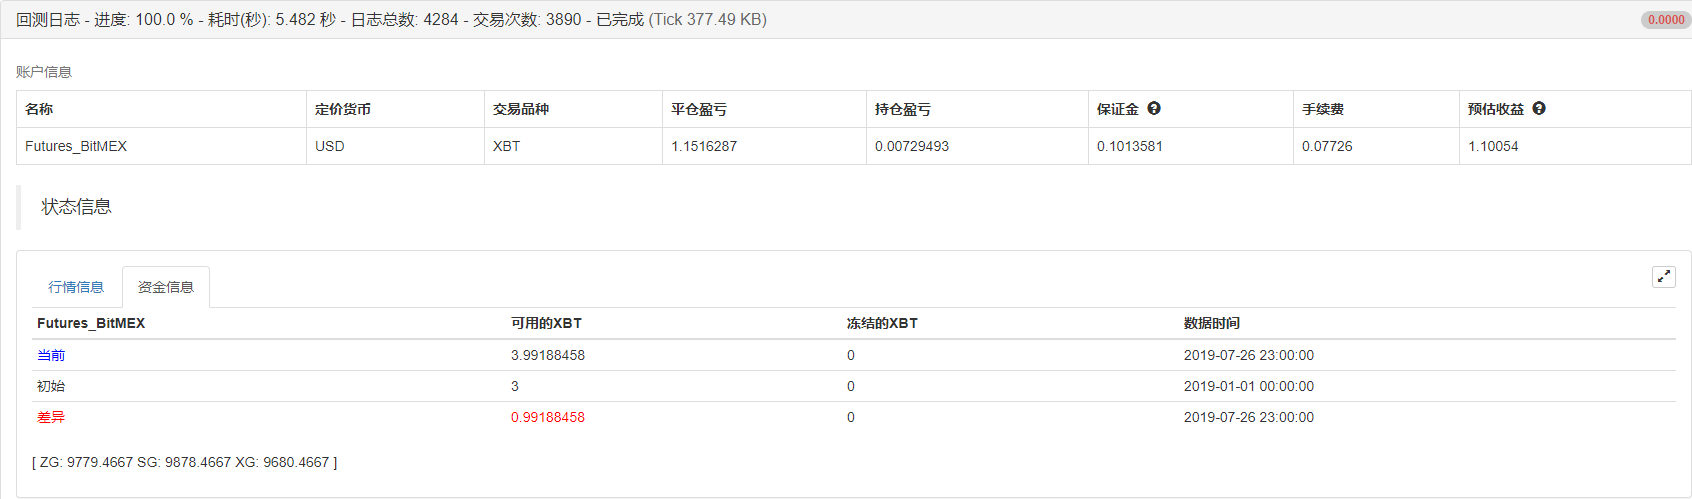
 Benefits are clear
 The funding curve
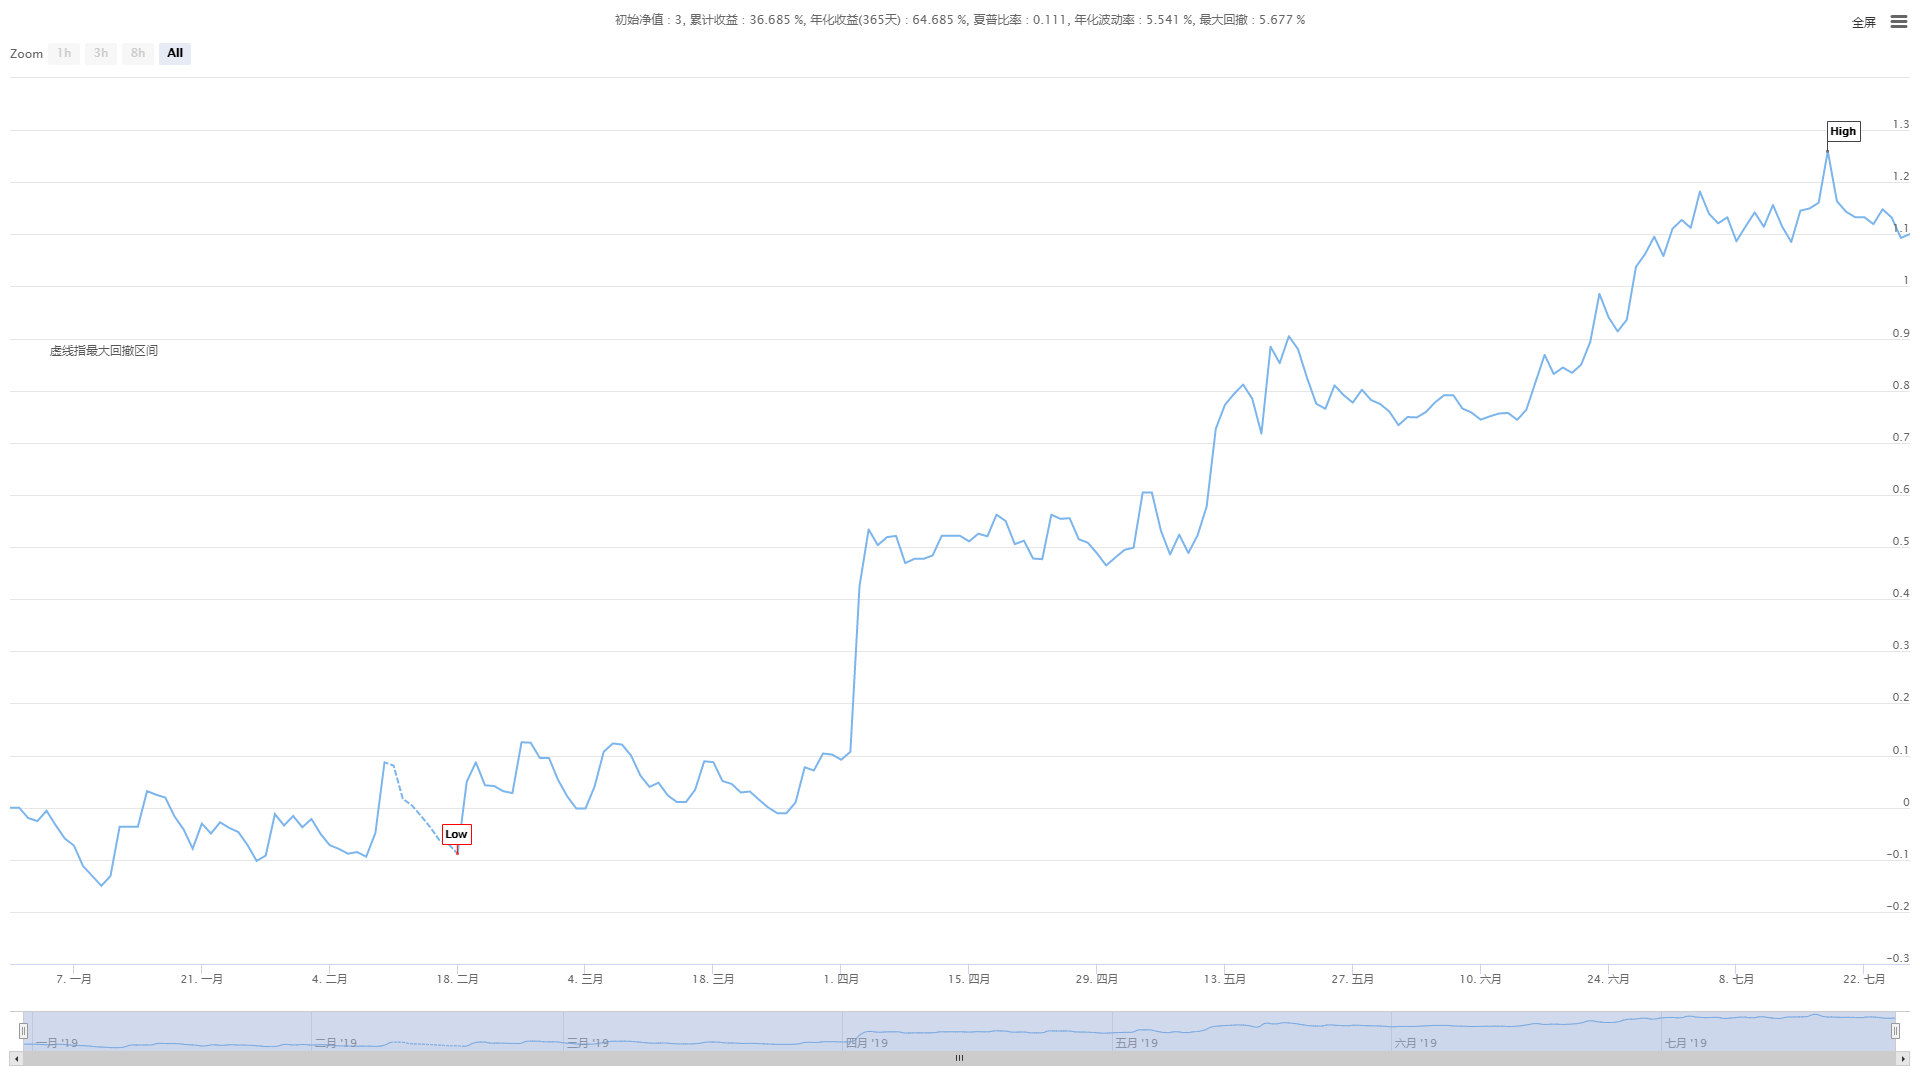 The above graphs are a retrospective of the XBTUSD perpetual contract on the BitMEX exchange, which has maintained its effectiveness in the trending market, although the efficiency is not too high, but overall the capital curve is up, even when the market trend retreated in July 2019, the net value curve did not retreat much.
Policy source code
Click to copy the full policy source code
Summary
Although Kenta is an old trading method, we have restored and improved it with code, which proves that the strategy is still effective today. Especially in the medium and low frequency CTA strategy, Kenta still has something worth learning, which is to cut losses and let profits run!
It can be said that most of the successful trading methods are based on the idea of losing a little when you make a loss, making a little more money when you make a loss, and then constantly implementing this idea. So, as a long-term trading strategy, short-term losses are inevitable costs, short-term profits are not our goal.
- Quantifying Fundamental Analysis in the Cryptocurrency Market: Let Data Speak for Itself!
- Quantified research on the basics of coin circles - stop believing in all kinds of crazy professors, data is objective!
- The inventor of the Quantitative Data Exploration Module, an essential tool in the field of quantitative trading.
- Mastering Everything - Introduction to FMZ New Version of Trading Terminal (with TRB Arbitrage Source Code)
- Get all the details about the new FMZ trading terminal (with the TRB suite source code)
- FMZ Quant: An Analysis of Common Requirements Design Examples in the Cryptocurrency Market (II)
- How to Exploit Brainless Selling Bots with a High-Frequency Strategy in 80 Lines of Code
- FMZ quantification: common demands on the cryptocurrency market design example analysis (II)
- How to exploit brainless robots for sale with high-frequency strategies of 80 lines of code
- FMZ Quant: An Analysis of Common Requirements Design Examples in the Cryptocurrency Market (I)
- FMZ quantification: common demands of the cryptocurrency market design instance analysis (1)