The experience of developing trading strategies
Author: The Little Dream, Created: 2019-08-06 17:15:13, Updated: 2023-10-20 20:06:49
The experience of developing trading strategies
The purpose of this article is to share some experiences in strategy development, as well as a few tricks that will give readers a quick insight into trading strategy development. When faced with similar details in the design of a strategy, a reasonable solution can be devised immediately. The inventor's quantitative trading platform is a platform for teaching, testing, and practice. The following is a list of the programming languages that are used in JavaScript: Trading markets: Blockchain asset markets (BTC, ETH and others)
-
Access and processing of data
It is usually possible to use several different interfaces to obtain market data, depending on the strategy logic, since the trading logic of the strategy is usually driven by market data.
-
GetTicker: Get real-time ticking of the market. It is commonly used to quickly access the current latest price, buy one price, sell one price.
-
GetDepth: Obtaining orders from the deepest markets. It is commonly used to obtain prices, order quantities, etc. It is used for hedging strategies, market strategies, etc.
-
GetTrade: Get the most recent transaction records on the market. It is commonly used to analyze market behavior in a short period of time, to analyze microscopic changes in the market. It is often used for high-frequency strategies, algorithmic strategies.
-
GetRecords: Get the market K-line data. It is commonly used as a trend tracking strategy. This is a very useful tool for calculating indicators.
-
Let it go.
When designing a strategy, beginners often overlook errors, intuitively assuming that the outcome of the operation of each link in the strategy is a given. However, this is not the case, and unexpected situations can occur when requesting market data during the operation of a strategy program. For example, some industry interfaces returned abnormal data:
var depth = exchange.GetDepth()

// depth.Asks[0].Price < depth.Bids[0].Price      卖一价格低于了买一价格,这种情况不可能存在于盘面上,
//                                                因为卖出的价格低于买入的价格,必定已经成交了。
// depth.Bids[n].Amount = 0                       订单薄买入列表第n档,订单量为0
// depth.Asks[m].Price = 0                        订单薄卖出列表第m档,订单价格为0
GetDepth (()) returns a null value.
There are a lot of strange situations like this. This is why it is necessary to deal with these foreseeable problems in a way that is called error tolerance.
The usual error tolerance approach is to discard the data and retrieve it.
For example:
function main () {
    while (true) {
        onTick()
        Sleep(500)
    }
}

function GetTicker () {
    while (true) {
        var ticker = exchange.GetTicker()
        if (ticker.Sell > ticker.Buy) {       // 以 检测卖一价格是不是小于买一价这个错误的容错处理为例,
                                              // 排除这个错误,当前函数返回 ticker 。
            return ticker
        }
        Sleep(500)
    }
}

function onTick () {
    var ticker = GetTicker()                  // 确保获取到的 ticker 不会存在 卖一价格小于买一价格这种数据错误的情况。
    // ...  具体的策略逻辑
}
Other foreseeable error handling can be used in a similar way. The design principle is that it is absolutely impossible to give wrong data to drive strategic logic.
-
Use of K-line data
K-line data is obtained by calling:
var r = exchange.GetRecords()The resulting K-line data is an array, for example, like this:
[
    {"Time":1562068800000,"Open":10000.7,"High":10208.9,"Low":9942.4,"Close":10058.8,"Volume":6281.887000000001},
    {"Time":1562072400000,"Open":10058.6,"High":10154.4,"Low":9914.5,"Close":9990.7,"Volume":4322.099},
    ...
    {"Time":1562079600000,"Open":10535.1,"High":10654.6,"Low":10383.6,"Close":10630.7,"Volume":5163.484000000004}
]
You can see each parenthesis.
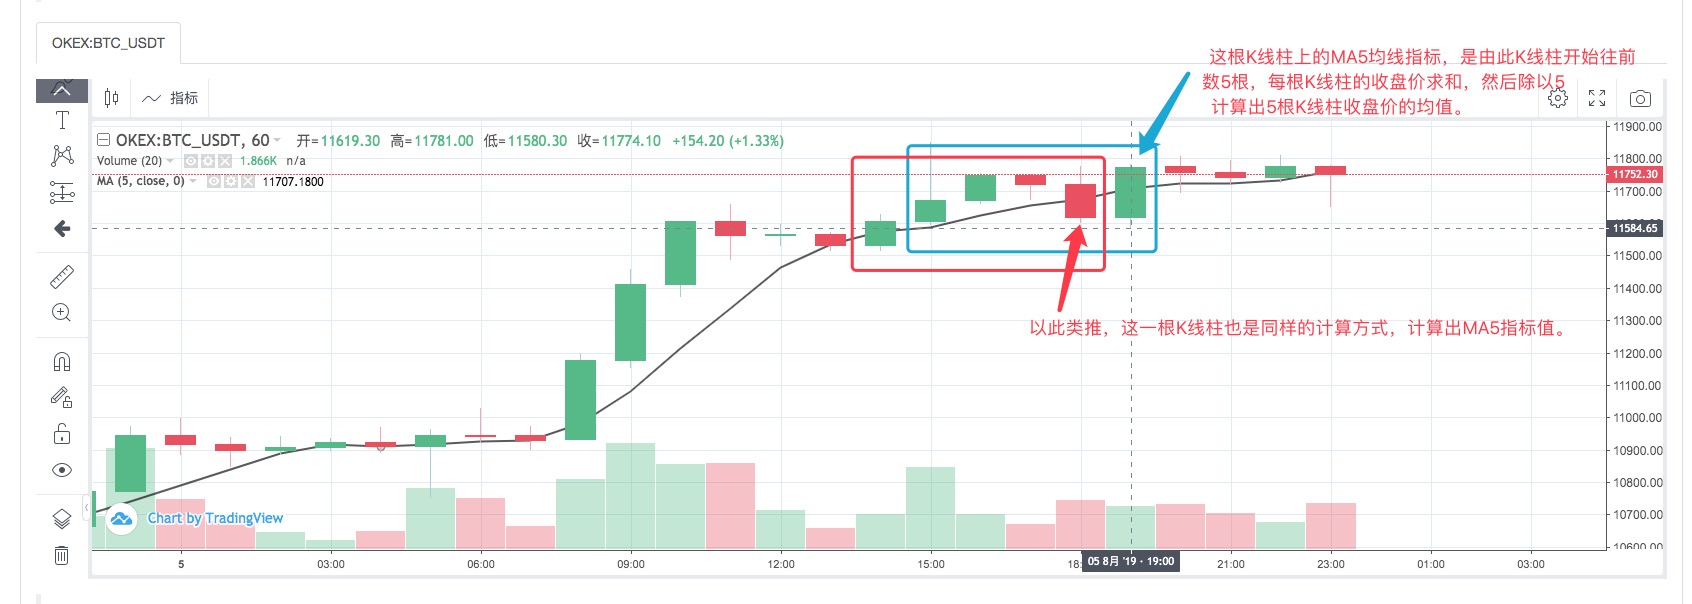
{}The middle includes time, open, high, low, close, volume. This is a K-line column. Generally, K-line data is used to calculate indicators, such as: MA average, MACD, etc. Enter the K-line data as a parameter (raw data), set the indicator parameter, and calculate the function of the indicator data, which we call the indicator function. There are many indicator functions on the inventor's quantitative trading platform.For example, we calculate a mean linearity indicator based on the cycle of the K-line data we are passing, and the mean of the corresponding cycle is calculated. For example, if the K-line data (a K-line column represents a day) is transmitted, the calculated mean is the mean of the day. Similarly, if the K-line data of the mean-line indicator function is transmitted for a period of 1 hour, the calculated mean is the mean of 1 hour.
There is a problem that is often overlooked when we calculate the indicator, if I am going to calculate the 5-day average, then we first prepare the daily K-line data:
var r = exchange.GetRecords(PERIOD_D1)  // 给GetRecords 函数传入参数 PERIOD_D1就是指定获取日K线,
                                        // 具体函数使用可以参看:https://www.fmz.com/api#GetRecords
With the K-day data, we can calculate the mean line indicator, and if we want to calculate the 5-day mean line, then we have to set the indicator parameter of the indicator function to 5.
var ma = TA.MA(r, 5)        // TA.MA() 就是指标函数,用来计算均线指标,第一个参数设置刚才获取的日K线数据r,
                            // 第二个参数设置5,计算出来的就是5日均线,其它指标函数同理。
We overlooked a potential problem, if there are fewer than 5 K-line columns in the r-day K-line data, what if we can calculate an effective 5-day average? The answer is no. Because the average line indicator is the average of the closing prices for a certain number of K-line columns.
So before using the K-line data, it is necessary to determine whether the number of K-line columns in the K-line data satisfies the conditions for the calculation of the indicator (the indicator parameter).
So before calculating the 5-day average, let's judge, the full code is as follows:
function CalcMA () {
    var r = _C(exchange.GetRecords, PERIOD_D1)     // _C() 是容错函数,目的就是避免 r 为 null , 具体可以查询文档:https://www.fmz.com/api#_C
    if (r.length > 5) {
        return TA.MA(r, 5)                         // 用均线指标函数 TA.MA 计算出均线数据,做为函数返回值,返回。
    }

    return false
}

function main () {
    var ma = CalcMA()
    Log(ma)
}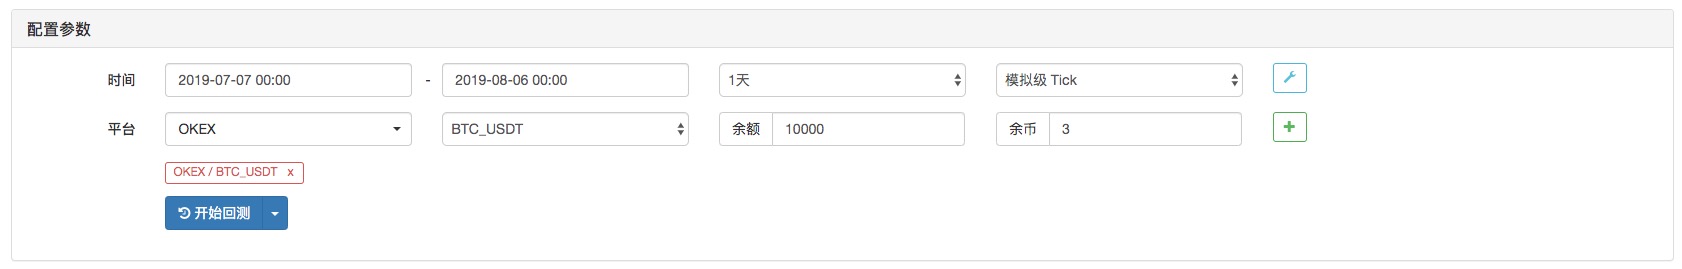
The results showed: [null, null, null, null, 4228.7, 4402.9400000000005,...] This is the first time I've ever seen this.
You can see the calculated 5-day mean line indicator, the first 4 are zero, because the number of K-line columns is less than 5, the mean value cannot be calculated.
-
A little trick to determine if the K-line is updated
There is often a scenario where we write some policy and we have to deal with some operation at the end of each K-line cycle, or print some logs. For beginners with no programming experience, you might not know what mechanism to use, but here we give you the tips straight away.
We determine that a K-line column cycle is complete, and we can start from the time attribute in the K-line data, and each time we obtain a K-line data, we determine whether the value of the Time attribute has changed in the data of the last K-line column of this K-line data, if it has changed, it represents that there is a new K-line column (proves that the previous K-line column cycle of the new K-line column is completed), if there is no change, it represents that no new K-line column produces the last current one (the K-line cycle is not yet completed).
So we want to have a variable that records the time of the last K-line column of the K-line data.
var r = exchange.GetRecords()
var lastTime = r[r.length - 1].Time       // lastTime 用来记录最后一根K线柱的时间。
In practice, the structure is usually as follows:
function main () {
    var lastTime = 0
    while (true) {
        var r = _C(exchange.GetRecords)
        if (r[r.length - 1].Time != lastTime) {
            Log("新K线柱产生")
            lastTime = r[r.length - 1].Time      // 一定要更新 lastTime ,这个至关重要。

            // ... 其它处理逻辑
            // ...
        }

        Sleep(500)
    }
}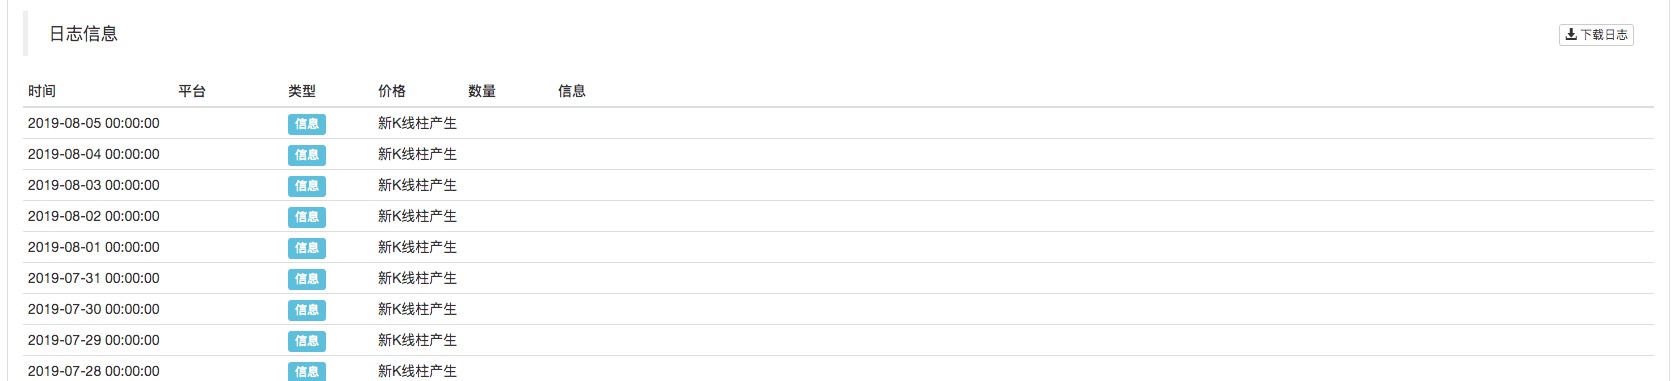
As you can see in the retest, the K-line cycle is set to day (exchange.GetRecords does not specify parameters when the function is called, it is the default parameter according to the K-line cycle set in the retest) and a log is printed whenever a new K-line column appears.
-
-
Numerical computation
-
Calculate the time it takes to access the exchange interface
If you want to have a certain display or control over the time it takes for the interface to access the policy exchange, you can use the following code:
function main () {
    while (true) {
        var beginTime = new Date().getTime()
        var ticker = exchange.GetTicker()
        var endTime = new Date().getTime()

        LogStatus(_D(), "GetTicker() 函数耗时:", endTime - beginTime, "毫秒")
        Sleep(1000)
    }
}
Simply put, the time stamp recorded after the GetTicker function is called minus the time stamp before it is called is used to calculate the milliseconds experienced, i.e. the time taken by the GetTicker function from execution to return of the result.
-
Use Math.min / Math.max to limit the upper and lower limits of the numeric values
If you want a value to have a limit, you usually use the Math.min limit.
For example, in the process of selling orders, the number of units sold must not be greater than the number of coins on the account. If the number of coins available in the account is greater than the number of coins available in the account, the order will be returned with an error.
This is usually controlled by: For example, a 0.2 coin order is planned for sale.
var planAmount = 0.2
var account = _C(exchange.GetAccount)
var amount = Math.min(account.Stocks, planAmount)
This ensures that the amount to be ordered does not exceed the number of coins available in the account.
Similarly, Math.max is used to ensure the lower bound of a numerical value. What kind of scenario is this usually used for? In general, exchanges have a minimum order size limit for certain trading pairs and will reject orders below this minimum order size. Assume that the minimum amount of BTC is usually 0.01 units. It is sometimes possible to get a lower order of less than 0.01 by computing, so we can use Math.max to ensure the lowest order.
-
Order quantity, price, and precision control
Precision controls can be performed using the _N() function or the SetPrecision function.
The SetPrecision () function, once set, automatically cuts the number of digits in the system that are in excess of the single quantity and price values.
The _N() function is used to perform a decimal decomposition (precision control) on a number.
For example:
var pi = _N(3.141592653, 2)
Log(pi)
The value of pi is decomposed into two decimal places, i.e. 3.14
For more information, see the API documentation.
-
-
Some logical settings
-
Timing, performing some operations on a certain time cycle
Such a mechanism can be used to determine the current time stamp minus the time stamp at the time of completion of the last timing task, calculating in real time the time already elapsed when this elapsed time exceeds a set length of time, i.e. performing a new operation.
For example, it is used in investment strategies.
var lastActTime = 0
var waitTime = 1000 * 60 * 60 * 12   // 一天的毫秒数
function main () {
    while (true) {
        var nowTime = new Date().getTime()
        if (nowTime - lastActTime > waitTime) {
            Log("执行定投")
            // ... 具体的定投操作,买入操作。


            lastActTime = nowTime
        }

        Sleep(500)
    }
}
This is a simple example.
-
Automatic recovery mechanisms for policy design
Using the inventor's quantized _G() function, and the exit save function, it is convenient to design a policy to exit the save progression and restart the auto-recovery state function.
var hold = {
    price : 0,
    amount : 0,
}

function main () {
    if (_G("hold")) {
        var ret = _G("hold")
        hold.price = ret.price
        hold.amount = ret.amount
        Log("恢复 hold:", hold)
    }

    var count = 1
    while (true) {
        // ... 策略逻辑
        // ... 策略运行中,可能开仓,交易,把开仓的持仓价格赋值给 hold.price ,开仓的数量赋值给 hold.amount,用以记录持仓信息。

        hold.price = count++     // 模拟一些数值
        hold.amount = count/10   // 模拟一些数值

        Sleep(500)
    }
}

function onexit () {    // 点击机器人上的停止按钮,会触发执行这个函数,执行完毕机器人停止。
    _G("hold", hold)
    Log("保存 hold:", JSON.stringify(hold))
}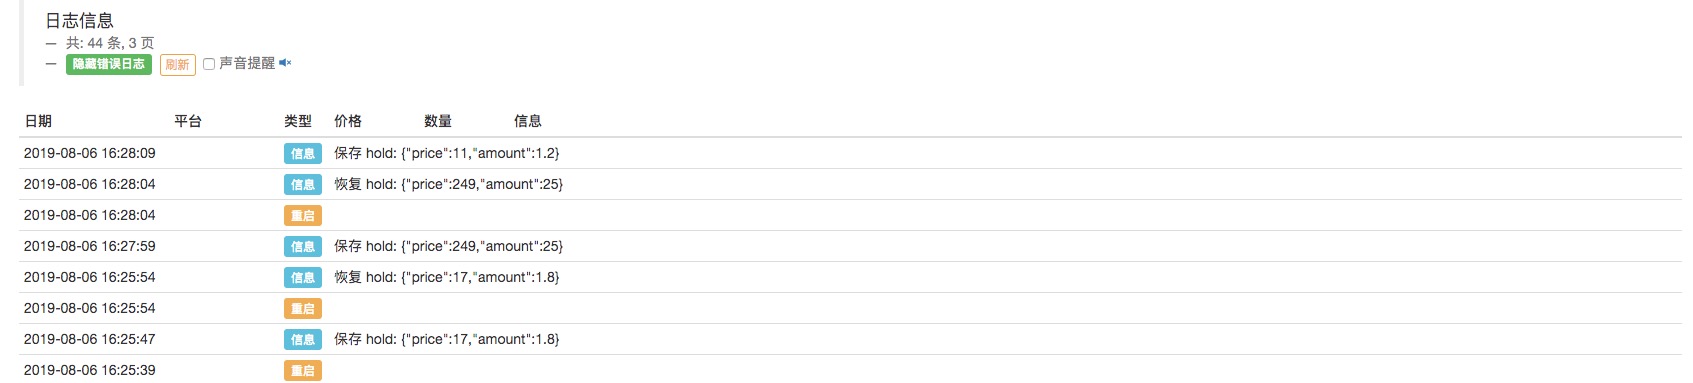
As you can see, the data in the hold object is saved every time the robot is stopped, and every time it is restarted, it reads the data, restoring the hold value to the state it was in before it was stopped. Of course, this is a simple example, and if used in a real strategy, it should be designed according to the key data that needs to be recovered in the strategy (generally account information, holdings, profit figures, trading direction, etc.). Of course, some conditions can be set for whether the restoration will take place or not.
-
Here are a few tips for developing strategies, hopefully helpful for beginners and strategy developers! The best way to make progress is to start practicing!
- Quantifying Fundamental Analysis in the Cryptocurrency Market: Let Data Speak for Itself!
- Quantified research on the basics of coin circles - stop believing in all kinds of crazy professors, data is objective!
- The inventor of the Quantitative Data Exploration Module, an essential tool in the field of quantitative trading.
- Mastering Everything - Introduction to FMZ New Version of Trading Terminal (with TRB Arbitrage Source Code)
- Get all the details about the new FMZ trading terminal (with the TRB suite source code)
- FMZ Quant: An Analysis of Common Requirements Design Examples in the Cryptocurrency Market (II)
- How to Exploit Brainless Selling Bots with a High-Frequency Strategy in 80 Lines of Code
- FMZ quantification: common demands on the cryptocurrency market design example analysis (II)
- How to exploit brainless robots for sale with high-frequency strategies of 80 lines of code
- FMZ Quant: An Analysis of Common Requirements Design Examples in the Cryptocurrency Market (I)
- FMZ quantification: common demands of the cryptocurrency market design instance analysis (1)
- Timeline data analysis with Tick data retrieval
- Calculation and application of DMI indicators
- Detailed usage and practical skills of energy tide(OBV) indicator in quantitative trading
weix1aoThanks for sharing, it's perfect for beginners who don't know how to write APIs, and also ask if our platform supports higher versions of es, like do you use it regularly?
MAIKEOThank you Dreamhunt! Dreamhunt teacher, you are really a master of martial arts, programming technology is high, writing is good, admiration is good!!!
The Little DreamHello, I am currently supporting the ES8 standard.
The Little DreamThank you for supporting FMZ Quantify!