
What is the energy tide?
There is an idiom like this in ancient times: "always prepare supply before soldiers." There is also a similar statement in the trading business: "Trading volume always before the price." It means the rise and fall of prices are always driven by the volume of transactions, and every price movement will reflect in the trading volume first. As a result, some people invented the "On Balance Volume (OBV)" indicator to measure the volume.
The Energy Tide (OBV) was invented by Joe Granville in the 1960s. Although the algorithm is simple, in the "price, quantity, time, and space" of the trading, take the "quantity" For the entry point, it has been favored by many traders. As a popular indicator in the trading market, the energy tide can intuitively reflect the relationship between price and volume, thus helping traders to observe the market from more angles.
The energy tide in the chart
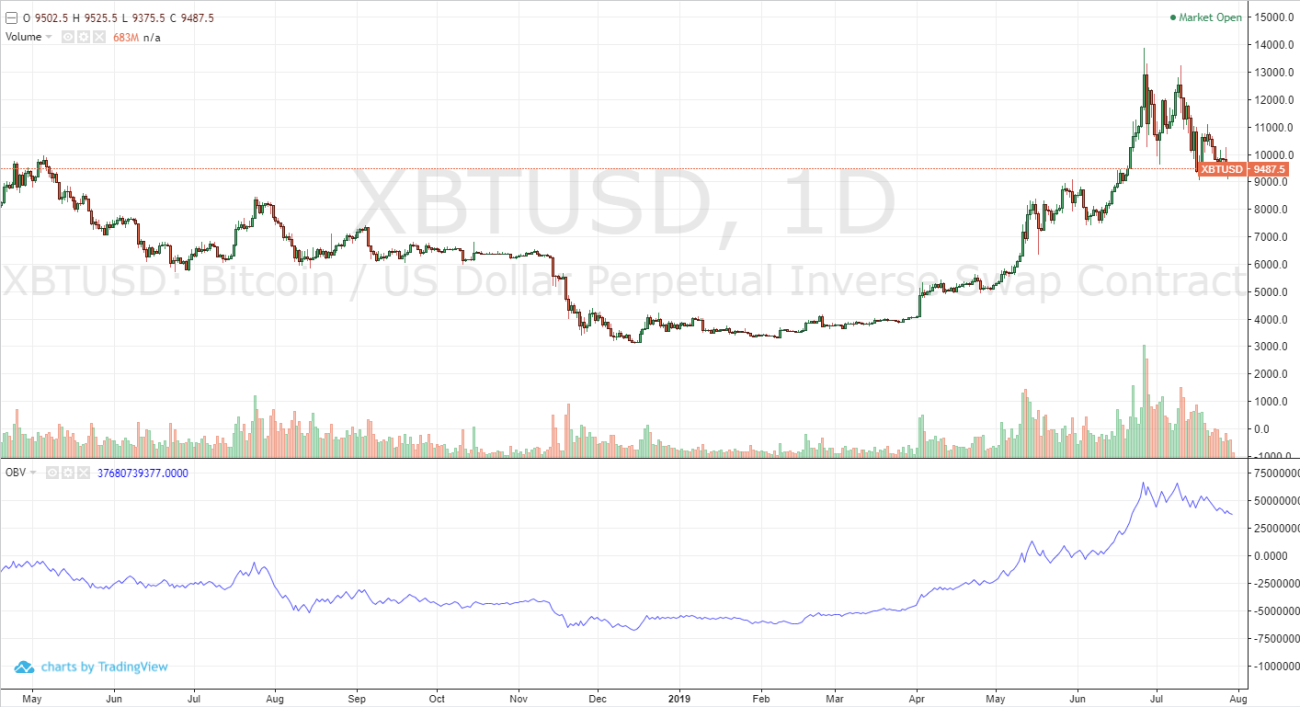
As shown in the above figure, although the energy tide describes the volume, its trend is obviously different from the volume. Readers may find that the trend of the energy tide is basically consistent with the price trend, and there are relatively high and relatively low points. Only the trend is smoother. It quantifies the volume and plots it like a trend line.
The theoretical basis of the energy tide
For the trading, when the price is consistent with the idea of most traders, the volume will become smaller, because the buyer has already bought it, and the seller has already sold it. Conversely, when the price is inconsistent with the idea of most traders, the volume will increase, because the buyer believes that the price will continue to rise, the seller will think that the price will fall, and when they are all put into action, the volume will Become bigger. Therefore, the energy tide reacts not only to market sentiment, but also to the power between long and short.
In addition, according to the principle of reflexivity: “Ideas change the facts, and the change of facts in turn changes the idea”, that is to say, when people think that the price will continue to rise, they will buy it by action, and the result will be the transaction. The volume increased and the price continued to rise. When people see the price continue to rise, they will think that the price may continue to rise and further push upward the price. This is why we see the price rise in the market when the price rises, and there is a lot of volume.
Calculation method of energy tide
The calculation method of the energy tide is actually not complicated. If the current K-line closing price is greater than the pervious K-line closing price, then the current K-line energy tide is the current K-line trading volume plus the pervious K-line energy tide. If the current K-line closing price is less than the pervious K-line closing price, then the energy tide of the current K-line is the pervious K-line energy tide minus the current volume.
- If the current K-line closing price is greater than the pervious K-line closing price, then:
OBV(i) = OBV(i - 1) + VOLUME(i)
- If the current K-line closing price is less than the pervious K-line closing price, then:
OBV(i) = OBV(i - 1) - VOLUME(i)
- If the current K-line closing price is equal to the pervious K-line closing price, then:
OBV(i) = OBV(i - 1)
Among them:
- OBV(i): current energy tide of the K line
- OBV(i - 1): the energy tide of the pervious K line
- VOLUME(i): current K line volume
The actual principle of energy tide
One of the most basic preconditions for using energy flows is to assume that the change in volume is alway appearing before the the change of price, that is, the “quantity before price” we mentioned above. Usually, the price increase or decrease must be matched by the volume, and the increase and decrease of the volume will affect the price change all the time. For example, the price increase or decrease is generally accompanied by a large volume of transactions, but if the price increase or decline volume does not change much, then this price movement is difficult to continue.
When the energy tide is upward, we can think that funds are flooding into the market, market transactions are unprecedentedly active, and future prices may rise. When the energy tide is downward, we can think that funds are being withdrawn from the market and market transactions are gradually deserted. Future prices may fall.
How can we judge whether the energy tide is rising or falling? In fact, you can use the method of judging the price direction to judge the energy tide. In the energy tide of rising and falling, the trend is not in one go. There are also three characteristics of stepping forward. In the trend, we can find that there are peaks and troughs. Then in the rising trend, each trough is higher than the previous trough. In the downward trend, each peak is lower than the previous peak.
Although, in the quantitative trading, it is not necessary to identify the peaks and troughs to generate signals. You can use the moving average or channel line to measure the trend of the energy tide, which is easy for novices to achieve. For example, the moving average is to average the energy tide of a period. If the current energy tide is greater than this average, the capital is more optimistic about the market. If the current energy tide is less than this average, the capital is less interested in the market.
Energy tide trading logic
From the above principle of energy tide, we can try to build a trading strategy based on energy tide. Taking the simplest moving average as an example, we can get the moving average of multiple energy tides by averaging the energy tide values. The energy tide can describe the volume very well, but it can't describe the price, so here is a representative indicator: the average is the fluctuation range (ATR), which can reflect the price fluctuations over a period of time. Here is the logic of the entire strategy:
- First calculate the energy tide (OBV)
- Then calculate the true fluctuation range (ATR)
- Then calculate the moving average of the two energy tides
- Long position open: two moving averages upward, and the slow one up-cross the fast one
- Short position open: two moving averages downward, and the slow one down-cross the fast one
- Long position close, two moving averages downward, or the slow one down-cross the fast one
- Short position close, two moving averages upward, or the slow one up-cross the fast one
Based on the energy tide trading strategy code
Through the above trading logic, we can build this strategy on the FMZ Quant quantitative trading platform. Let's use the My language as an example. Follow these steps: fmz.com > Login > Dashboard > Strategy > New Strategy > Click the drop-down box on the top-left corner to select My language, start writing the strategy, and pay attention to the comments in the code below.
N:=10;
OBV:=SUM(IFELSE(CLOSE>REF(CLOSE,1),VOL,IFELSE(CLOSE<REF(CLOSE,1),-VOL,0)),0);
TR:=MAX(MAX((HIGH-LOW), ABS(REF(CLOSE,1)-HIGH)), ABS(REF(CLOSE,1)-LOW));
ATR: =MA(TR,N);
B: EMA2 (OBV*ATR, N);
D: EMA2 (OBV*ATR, N*2);
B>REF(B,1) && D>REF(D,1) && B>D,BK;
B<REF(B,1) || D<REF(D,1) || B<D,SP;
B<REF(B,1) && D<REF(D,1) && B<D,SK;
B>REF(B,1) || D>REF(D,1) || B>D,BP;
AUTOFILTER;
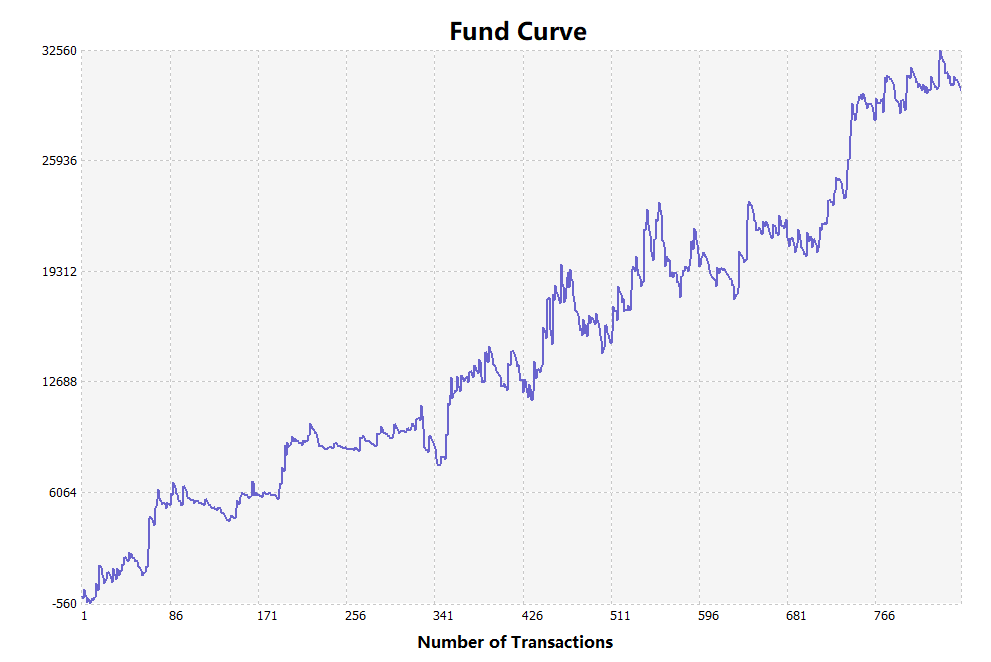
Strategy backtest
The backtest environment is as follows:
- Trading variety: rebar index
- Time: March 27, 2009 ~ July 31, 2019
- Cycle: one hour
- Slippage: 2 pips for opening and closing positions
- Fee: 2 times of the normal exchange rate
Fund Curve
Copy strategy source code
For more about this strategy, please click: https://www.fmz.com/strategy/159997
End
In fact, just an energy tide does not produce an effective buying and selling signal, because the price will change greatly in the early or middle stage of the rising and falling. Once the price trend is established, most traders will tend to agree. At this point, the purchase has been bought, and the sale is also sold. At this time, although the price is rising, the transaction volume will gradually shrink, which means that the shrinking volume does not mean that the market trend is coming to an end.
Therefore, the energy tide is suitable for the short-term strategy, and it will be counterproductive in the medium and long-term strategy. In addition, the energy tide cannot be used alone in actual combat, but is used as an auxiliary method as much as possible. Especially in the immature trading market, it is necessary to improve accordingly in order to exert its true strength.
- 1