Quantitative trading strategies for price dynamics analysis with Python
Author: Goodness, Created: 2019-08-09 15:49:06, Updated: 2023-10-20 20:13:38
Price action trading strategies
Dynamic trading strategies are used to analyze the comparison of overbought forces by analyzing the relationship between the opening price, the highest price, and the lowest price over a certain period of time, indirectly understanding the distribution of forces on both sides of the current market overbought.
Price dynamics analysis has a lot of applications in traditional manual calculations, especially for determining the unilateral trend of the day, the old-fashioned topic is often talked about, what is the trend, for the best quantification of the trend is the quantification of the contrast of the forces of the two sides, price dynamics analysis is one of the best indicators.
This article will use this strategy to develop a digital currency spot automation program on the Token network.
Calculation of price dynamics
AR = [sum of all N days of High-Open and / N days of All Open and Low] * 100
Here are some examples:
-
N: The statistical window of the daytime cycle, which is generally 30 days by default, since the month has approximately 30 days of effective trading days (digital currency trades 24/7, this figure may be a bit conservative)
-
High: Highest price of the day
-
Open: The opening price of a single day
-
Low: The lowest price of the day
How to use price dynamics
The price movement over a period of time reflects the position of the opening price between the highest price and the lowest price, which is the basis on which we judge the strength of the pull on both sides.
- Let's assume this value is around 100, above 100, the multirole force starts to increase, below 100, the idle force starts to accumulate.
- A higher AR value indicates that the market is active, popular and booming, but too high indicates that the price has entered the overbought zone, and a timing plateau should be selected. The height of the AR value has no specific criteria, in general, when the AR value rises to about 120, the price is likely to reverse.
- A decrease in the AR value indicates a recession in the market, a bullish headwind, which requires a lot of effort, and too low suggests that the price may have fallen into the oversold area, which can be considered too much.
Note: The above numbers are the default values, not the truth constants. In the process of real trading, we adjust the range to suit the market conditions as the market changes.
Quantitative trading strategies for price dynamics with Python
The old rule is, we open it.FMZ.COMIn addition, the user can log in to their account, click on Control Center, deploy administrators and bots.
For more information on how to deploy hosts and bots, please refer to my previous post:https://www.fmz.com/bbs-topic/4140
Readers who want to buy their own cloud server deployment host can refer to this article:https://www.fmz.com/bbs-topic/2848
Next, we click on the policy library in the left-hand menu and click on Create Policy.
In the upper right corner of the writing policy page, remember to choose Python, as shown below:
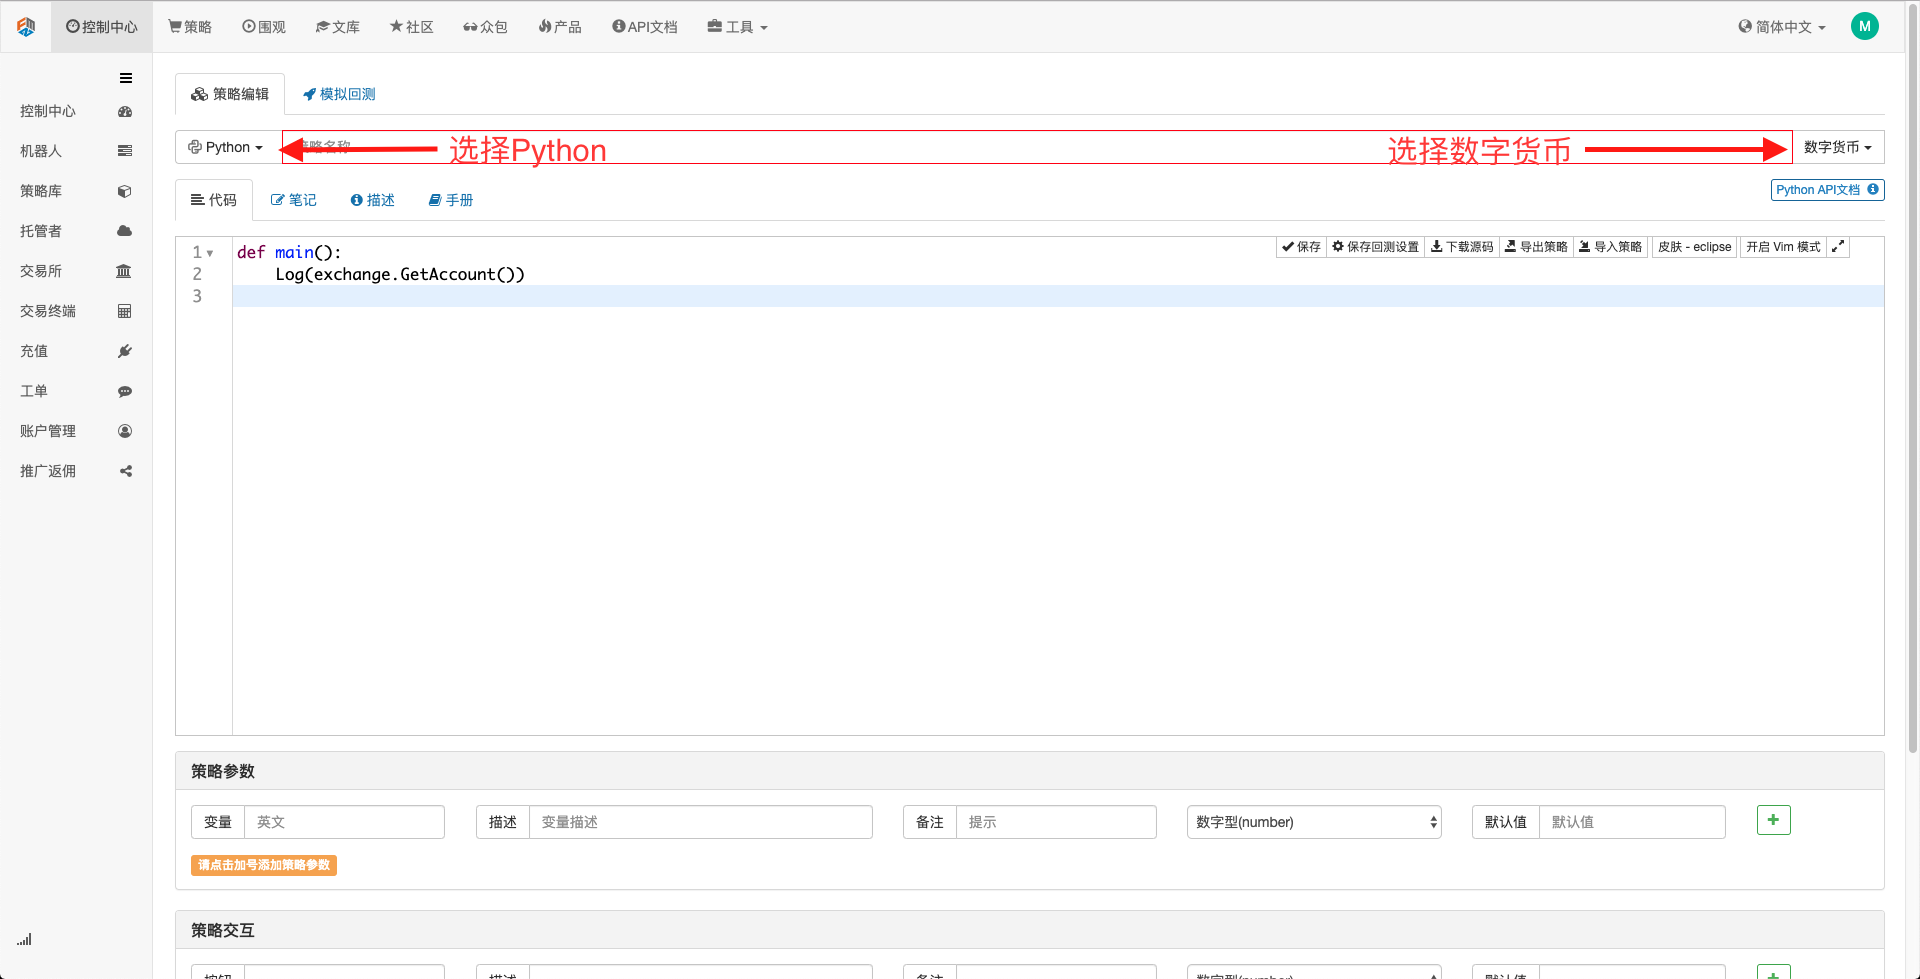
Next, we write the Python code in the code editing page, the code below, with very detailed line-by-line annotations, which you can slowly understand and realize, more importantly, although this strategy is written based on spot trading, but the following code's extensibility also takes into account futures trading. Interested readers can try to rewrite the following code into futures trading, the logic of the strategy itself is universal.
We started implementing this strategy by using Bitcoin cash as a trading token on the Token network:
import types # 导入Types模块库,这是为了应对代码中将要用到的各种数据类型
def main(): # 主函数,策略逻辑从这里开始
    IDLE = 0 # 用来标记持仓状态,可以理解为0即为空闲状态,也就是空仓状态
    LONG = 1 # 多头持仓
    SHORT = 2 # 空头持仓,注意,此策略应用于现货市场,所以不存在空头开仓或者持仓情况,这里这样写,是为了方便理解策略和以后的扩展(如扩展到期货市场)
    state = IDLE # 标记持仓状态的变量
    while True: # 进入循环
        r = exchange.GetRecords() #GetRecords是发明者量化平台的官方API,详细用法请参见:https://www.fmz.com/api
        if len(r) <= 1: # 判断K线是否大于一根,也就是当前是否为开盘状态,否则可能会进入死循环,这里也方便读者进行扩展,大一些的K线周期趋势状态更稳定。
           Log("bar的数量不足, 等待下一根bar...") # 输出日志
           continue # Python循环控制语句,继续下边的循环内容

        # 开始进行价格动量的量化分析
        ar = sum(r.High - r.Open) / sum(r.Open - r.Low) * 100 # 计算公式

        account = _C(exchange.GetAccount) # 获取账户信息,_C同样为发明者量化平台的官方API,用法请参见:https://www.fmz.com/api

        if ar < 95 and (state == IDLE or state == SHORT) :  # AR值小于超卖线且账户拥有资金,则全仓买入

           if account["Balance"] > 50:
                exchange.Buy(-1, account["Balance"] * 0.9) # 市价单全仓买入
                state = LONG # 改变持仓状态为LONG

        elif ar > 80 and (state == IDLE or state == LONG):  # AR值大于超买线且账户有持仓,则全仓卖出

           if account["Stocks"] > 0.01:
                exchange.Sell(-1, account["Stocks"] * 0.9) # 市价单全仓卖出
                state = SHORT # 改变持仓状态为SHORT

        LogStatus(_D(), exchange.GetAccount() , state) # 更新日志信息
Strategic retesting
After writing a strategy, the first thing we do is review it to see how it performs in the historical data, but please note, readers, that the results of the review do not equal future predictions, the review can only be used as a reference information to consider the effectiveness of our strategy. Once the market changes and the strategy starts to show large losses, we should identify the problem in time and then change the strategy to adapt to the new market environment, such as the threshold mentioned above.
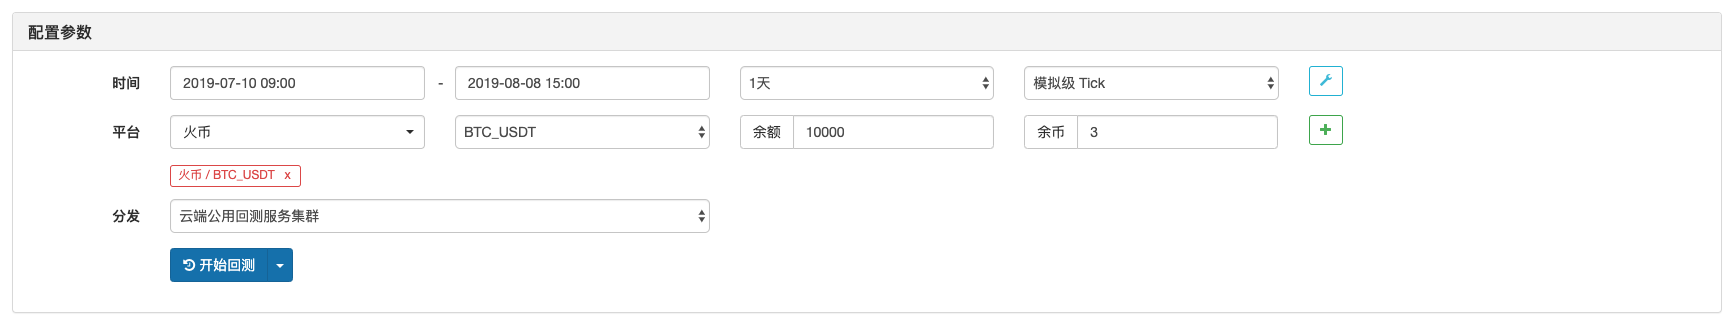
Click on the policy edit page for analogue debugging, where parameters can be adjusted according to different needs, making it convenient and quick to debug, especially for logically complex, parameter-rich policies, without having to go back to the source code, and make individual modifications.
We select the most recent month, click on Add Token Spot Exchange, BTC trading indicator.
See the results of the retest

As you can see, this strategy performed well in this month's review.
Advantages and disadvantages of price action strategies
- The Pros
Compared to some other traditional technical indicators, the advantage of price dynamics is that it does not use a single opening or closing price, but introduces a maximum and a minimum price. Dynamic comparisons are made between them through price fluctuations throughout the day, making market information more comprehensive, more responsive and more macro.
- The disadvantages
The independent use of price dynamics to determine whether the price is too high or too low, to judge over/under, is likely to get off too early in a wave of big trends, or to get off too early in a wave of big falls. Overall, this strategy is still a shock-effectiveness strategy.
The threshold is higher than the traditional stock market, with 80 oversold lines that are often hard to reach, and produce fewer buy signals; while the 170 oversold line is often below the threshold, and the sell signal is often triggered. This causes the strategy to be in a blank position most of the time, with a very low utilization rate. Since January this year, the price of Bitcoin has risen from a high of 3,500 to close to 13,000. The threshold has crossed the 170 line very early, and has been high ever since.
Therefore, this market has never had any holy grail trading strategy, which can be made without rehearsal, without adjustment, and always make money. We quantify traders and subjective traders, in the end, are the same way, need to adapt to market changes, according to the time and place, to adapt to any changes, and when the strategy is ineffective, need to be adjusted in time.
Friends with problems can come.https://www.fmz.com/bbsThe inventors of the Quantitative Platform have professional people ready to answer any questions you may have about the strategy or technology of the platform.
- Quantifying Fundamental Analysis in the Cryptocurrency Market: Let Data Speak for Itself!
- Quantified research on the basics of coin circles - stop believing in all kinds of crazy professors, data is objective!
- The inventor of the Quantitative Data Exploration Module, an essential tool in the field of quantitative trading.
- Mastering Everything - Introduction to FMZ New Version of Trading Terminal (with TRB Arbitrage Source Code)
- Get all the details about the new FMZ trading terminal (with the TRB suite source code)
- FMZ Quant: An Analysis of Common Requirements Design Examples in the Cryptocurrency Market (II)
- How to Exploit Brainless Selling Bots with a High-Frequency Strategy in 80 Lines of Code
- FMZ quantification: common demands on the cryptocurrency market design example analysis (II)
- How to exploit brainless robots for sale with high-frequency strategies of 80 lines of code
- FMZ Quant: An Analysis of Common Requirements Design Examples in the Cryptocurrency Market (I)
- FMZ quantification: common demands of the cryptocurrency market design instance analysis (1)
- K-line data processing in programmatic transactions is trivial
- Timeline data analysis with Tick data retrieval
MAIKEOThank you very much!