K-line data processing in programmatic transactions is trivial
Author: The Little Dream, Created: 2019-08-13 11:11:38, Updated: 2023-10-20 20:06:13
K-line data processing in programmatic transactions is trivial
When writing a programmatic trading strategy using K-line data, there is often a need to use some non-standard periodic K-line data, such as 12-minute period K-line data, 4-hour period K-line data, which is usually not directly available. So how do we address such a need? The answer is that there is a way. Non-standard cycles can be obtained by combining data from smaller cycles, and can be synthesized. Imagine that the highest price in several cycles is calculated as the highest price after the synthesis, the lowest price is calculated as the lowest price after the synthesis, the opening price does not change. Here is a picture:
-
I thought.
Let's take the example of the blockchain asset market BTC_USDT, where 1 hour becomes 4 hours.
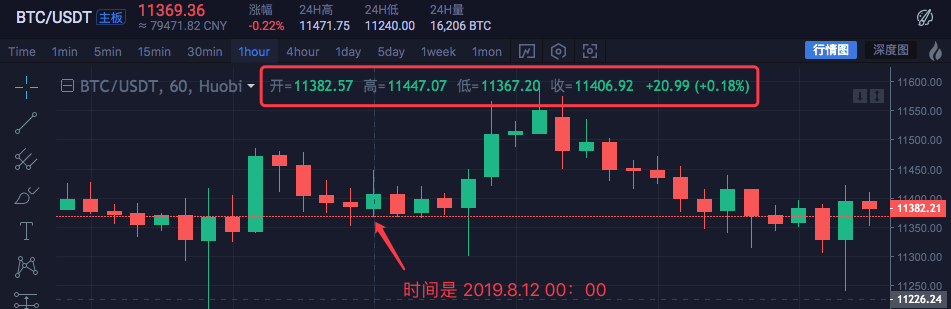
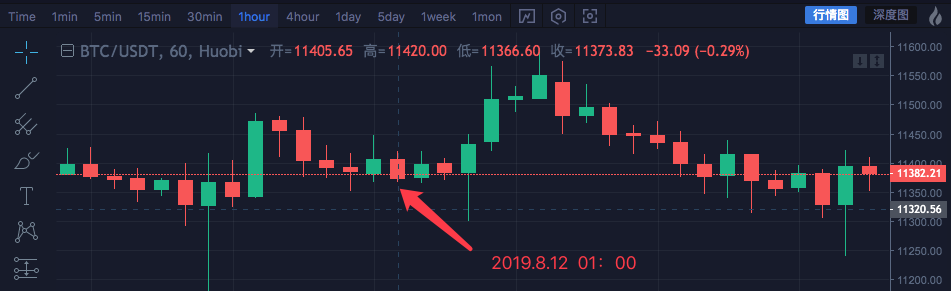
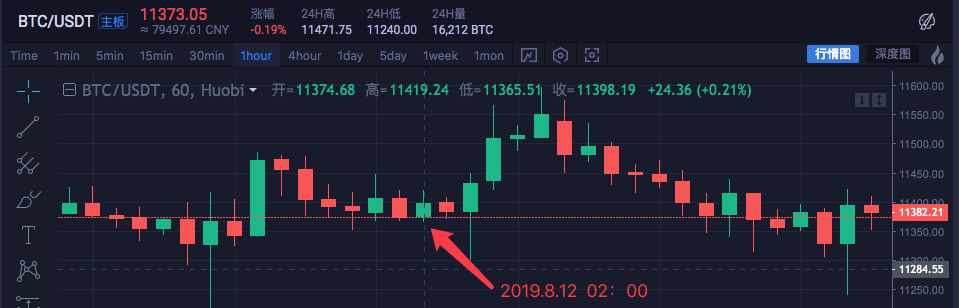
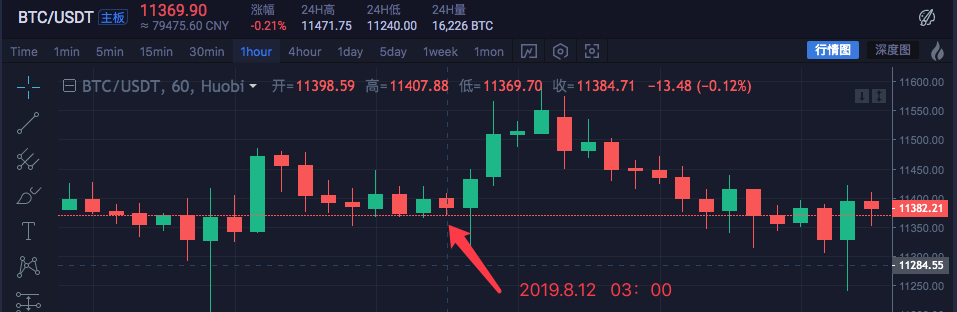
The time High Open up Low Recycled 2019.8.12 00:00 11447.07 11382.57 11367.2 11406.92 2019.8.12 01:00 11420 11405.65 11366.6 11373.83 2019.8.12 02:00 11419.24 11374.68 11365.51 11398.19 2019.8.12 03:00 11407.88 11398.59 11369.7 11384.71 These four one-hour cycles are combined into a root four-hour cycle, and the opening price is the first one at 00:00:11382.57. The closing price is the last one, which is at 03:00 the closing price: 11384.71. Find the highest price here: 11447.07 Find the lowest price here: 11365.51 The start time of the 4-hour cycle is 00:00 and the start time of the 1-hour K line is 2019.8.12 00:00 The sum of the bid and ask prices per hour (the main observation of how the prices are synthesized, not shown in the transaction data) is not discussed here.
The result is a 4-hour K-line: High: 11447.07 Opened: 11382.57 Low: 113.65.51 The collection: 11384.71 The time: 08.12.2019.
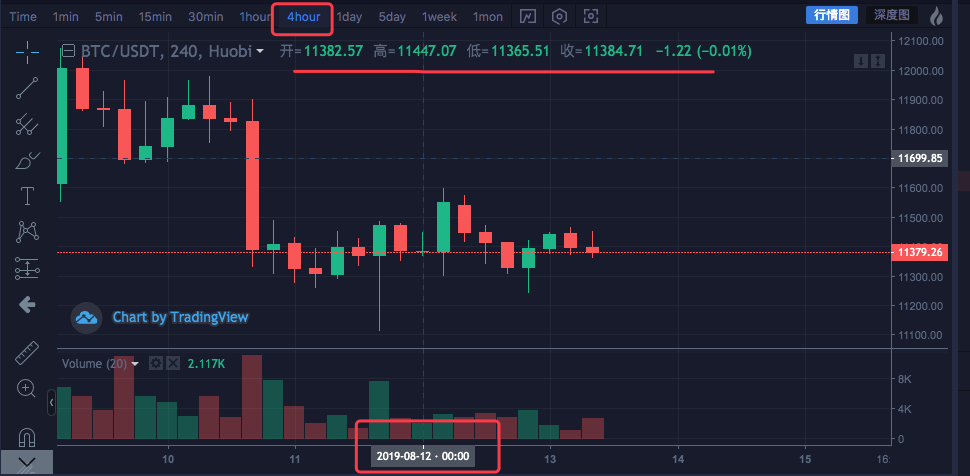
You can see that the data is consistent.
-
Write code to implement
Once the initial idea has been validated, you can start writing code manually to initially meet this need.
The code is for reference only:
  function GetNewCycleRecords (sourceRecords, targetCycle) {    // K线合成函数
      var ret = []

      // 首先获取源K线数据的周期
      if (!sourceRecords || sourceRecords.length < 2) {
          return null
      }
      var sourceLen = sourceRecords.length
      var sourceCycle = sourceRecords[sourceLen - 1].Time - sourceRecords[sourceLen - 2].Time

      if (targetCycle % sourceCycle != 0) {
          Log("targetCycle:", targetCycle)
          Log("sourceCycle:", sourceCycle)
          throw "targetCycle is not an integral multiple of sourceCycle."
      }

      if ((1000 * 60 * 60) % targetCycle != 0 && (1000 * 60 * 60 * 24) % targetCycle != 0) {
          Log("targetCycle:", targetCycle)
          Log("sourceCycle:", sourceCycle)
          Log((1000 * 60 * 60) % targetCycle, (1000 * 60 * 60 * 24) % targetCycle)
          throw "targetCycle cannot complete the cycle."
      }

      var multiple = targetCycle / sourceCycle


      var isBegin = false
      var count = 0
      var high = 0
      var low = 0
      var open = 0
      var close = 0
      var time = 0
      var vol = 0
      for (var i = 0 ; i < sourceLen ; i++) {
          // 获取 时区偏移数值
          var d = new Date()
          var n = d.getTimezoneOffset()

          if (((1000 * 60 * 60 * 24) - sourceRecords[i].Time % (1000 * 60 * 60 * 24) + (n * 1000 * 60)) % targetCycle == 0) {
              isBegin = true
          }

          if (isBegin) {
              if (count == 0) {
                  high = sourceRecords[i].High
                  low = sourceRecords[i].Low
                  open = sourceRecords[i].Open
                  close = sourceRecords[i].Close
                  time = sourceRecords[i].Time
                  vol = sourceRecords[i].Volume

                  count++
              } else if (count < multiple) {
                  high = Math.max(high, sourceRecords[i].High)
                  low = Math.min(low, sourceRecords[i].Low)
                  close = sourceRecords[i].Close
                  vol += sourceRecords[i].Volume

                  count++
              }

              if (count == multiple || i == sourceLen - 1) {
                  ret.push({
                      High : high,
                      Low : low,
                      Open : open,
                      Close : close,
                      Time : time,
                      Volume : vol,
                  })
                  count = 0
              }
          }
      }

      return ret
  }

  // 测试
  function main () {
      while (true) {
          var r = exchange.GetRecords()                           // 原始数据,作为合成K线的基础K线数据,例如要合成4小时K线,可以用1小时K线作为原始数据。
          var r2 = GetNewCycleRecords(r, 1000 * 60 * 60 * 4)      // 通过 GetNewCycleRecords 函数 传入 原始K线数据 r , 和目标周期, 1000 * 60 * 60 * 4 即 目标合成的周期 是4小时K线数据。

          $.PlotRecords(r2, "r2")                                 // 策略类库栏 可以勾选画线类库,调用 $.PlotRecords 画线类库 导出函数 画图。
          Sleep(1000)                                             // 每次循环间隔 1000 毫秒,防止访问K线接口获取数据过于频繁,导致交易所限制。
      }
  }
In fact, in order to synthesize K-strings, you need two things, the first thing you need is raw data, which is the data of the K-strings of the small cycles.
var r = exchange.GetRecords()The small cycle K-line data obtained. Second, it is necessary to specify how large the cycle is, i.e. the target cycle for the K-line data synthesis. The algorithm of the GetNewCycleRecords function then returns the data of a synthesized K-string array structure. The following points should be kept in mind:-
1, the target cycle cannot be smaller than the cycle of the K-string that you pass to the GetNewCycleRecords function as the data raw material. This is because it is not possible to synthesize data from smaller cycles with smaller cycles.
-
2, the target cycle set must be cyclically closed. What is cycle closure? Simply put, within an hour or a day, the target cycle time ranges combine to form a closed loop. For example: For example, a K-line with a 12-minute cycle, starting at 0 minutes 0 seconds of each hour (at 0 hours for example), the first cycle is
00:00:00 ~ 00:12:00And the second cycle is00:12:00 ~ 00:24:00The third cycle is00:24:00 ~ 00:36:00The fourth cycle is00:36:00 ~ 00:48:00The fifth cycle is00:48:00 ~ 01:00:00This is the first time I've been to a place like this in my life.If it is a 13-minute cycle, or a non-closed cycle, the data calculated for such a cycle is not unique, as the data synthesized differ depending on the starting point of the synthesized data.
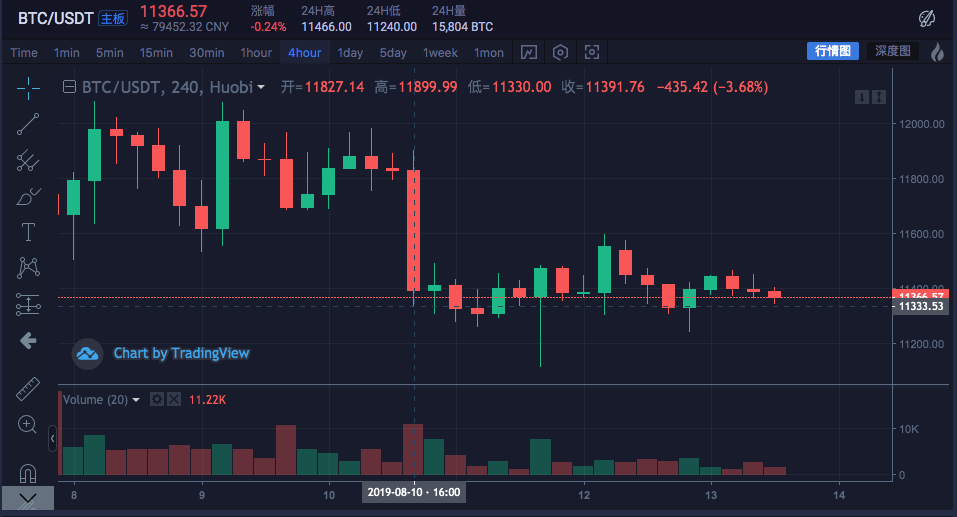
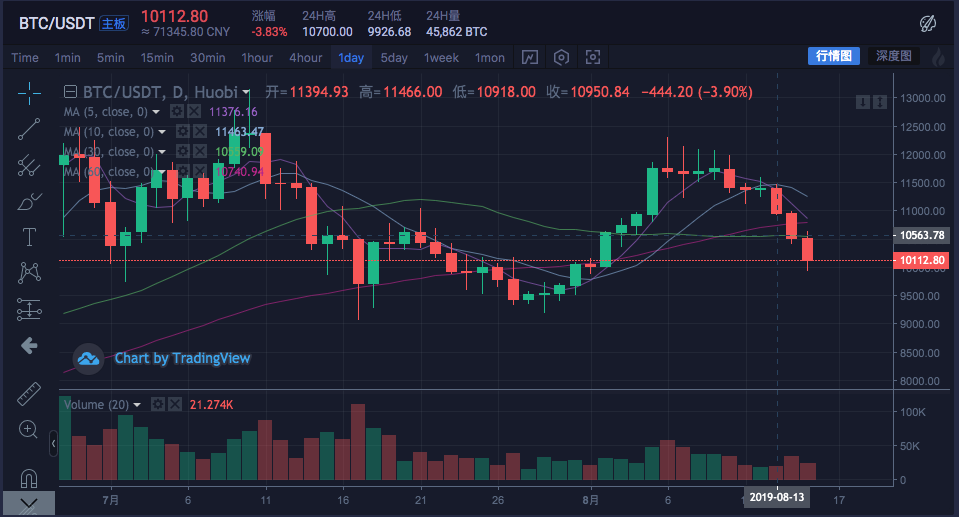
The real disk is running:
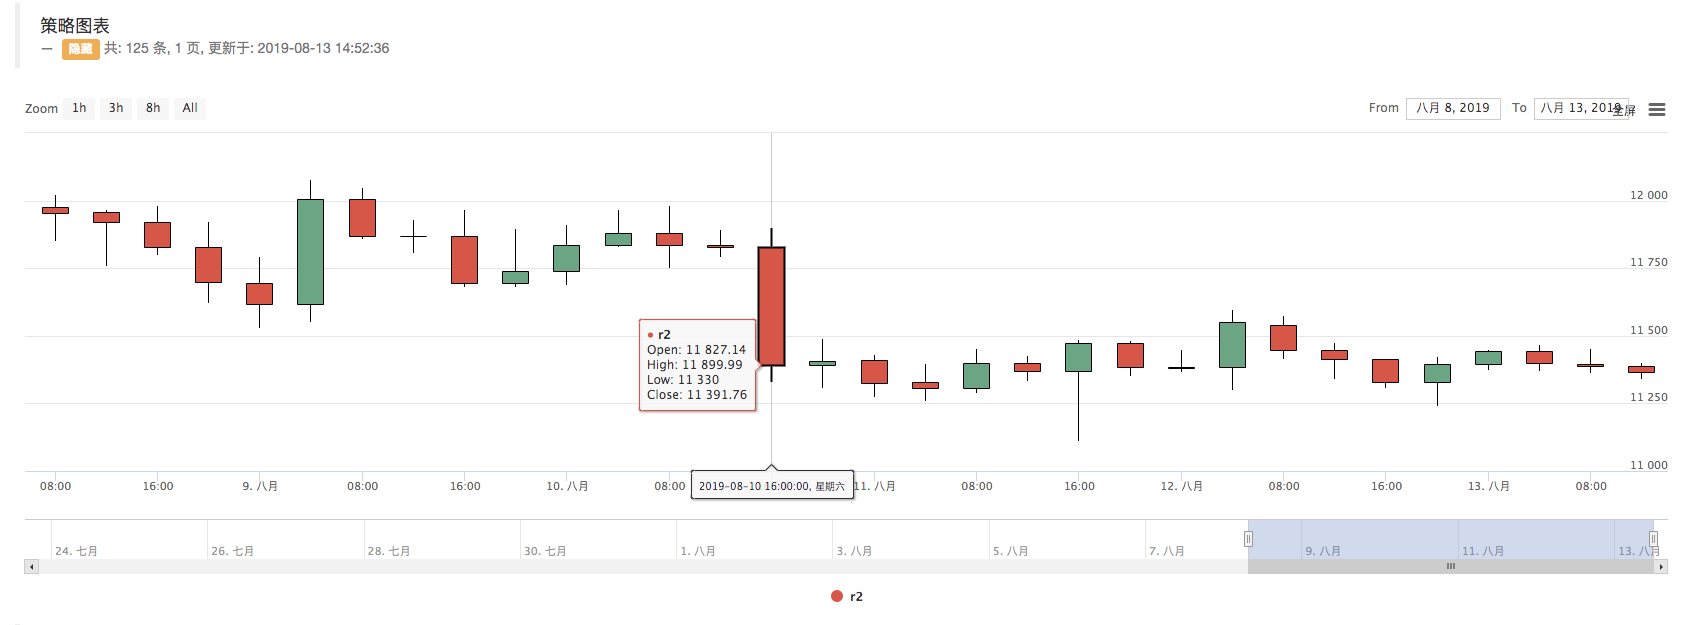
Comparison of stock market charts
-
-
Data structures needed to construct K-line data
I'm often asked, how do I calculate the average of the highest price of each K-line?
Usually, we calculate the average of the calculated closing price, which makes up the average, but sometimes there is a need to calculate the highest price, the lowest price, the opening price, etc. It's not possible to do it directly.
exchange.GetRecords()The K-line data returned by the function is fed directly into the indicator computation function.For example:talib.MAA homogeneous indicator calculation function has two parameters, the first parameter is the data to be transmitted and the second parameter is the indicator cycle parameter. So for example, we're going to calculate the indicator in the following diagram.
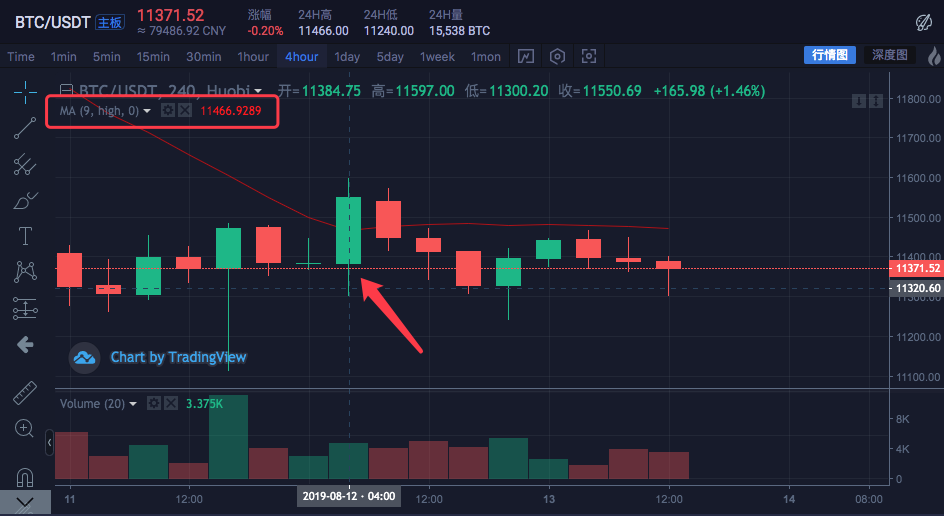
The K-line cycle is 4 hours. On the exchange chart, a straight line has been set up, with a straight line cycle parameter of 9. And the data source that is set to be calculated is the highest price per bar.
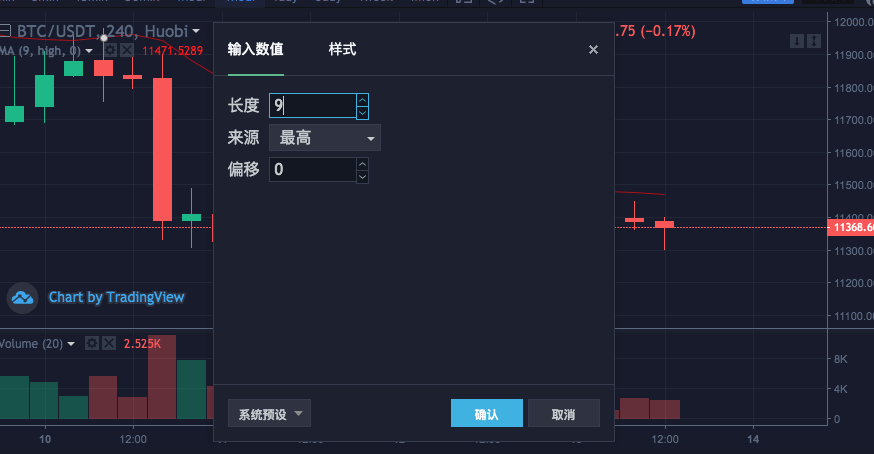 The mean is the average of the highest price calculated for 9 4-hour cycle K-Line Bar.
We started to construct a data calculation by ourselves to see if it was the same as the calculation of the graph on the exchange.
var highs = []
for (var i = 0 ; i < r2.length ; i++) {
    highs.push(r2[i].High)
}
Since the average of the highest price of each bar is calculated, the mean line indicator is given. Then we need to construct an array in which each data element corresponds to the highest value of each bar. You can see that the highs variable starts as an empty array, and then we go through the K-line data variable r2 (don't you remember r2? look at the code above in the main function for synthesizing the K-line for 4 hours). Read the highest value of r2 per Bar (i.e. r2[i].High, i takes the value range from 0 to r2.length - 1) and pushes into highs. This constructs a data structure that corresponds to the K-line data Bar one by one.
At this point the highs can be passed to talib. The MA function calculates the straight line.
A perfect example:
function main () {
    while (true) {
        var r = exchange.GetRecords()
        var r2 = GetNewCycleRecords(r, 1000 * 60 * 60 * 4)
        if (!r2) {
            continue
        }

        $.PlotRecords(r2, "r2")                                               // 画出K线

        var highs = []
        for (var i = 0 ; i < r2.length ; i++) {
            highs.push(r2[i].High)
        }

        var ma = talib.MA(highs, 9)                                           // 用均线指标函数 talib.MA 计算 均线指标
        $.PlotLine("high_MA9", ma[ma.length - 2], r2[r2.length - 2].Time)     // 使用画线类库把均线指标画在图表上

        Sleep(1000)
    }
}
Re-testing is running:
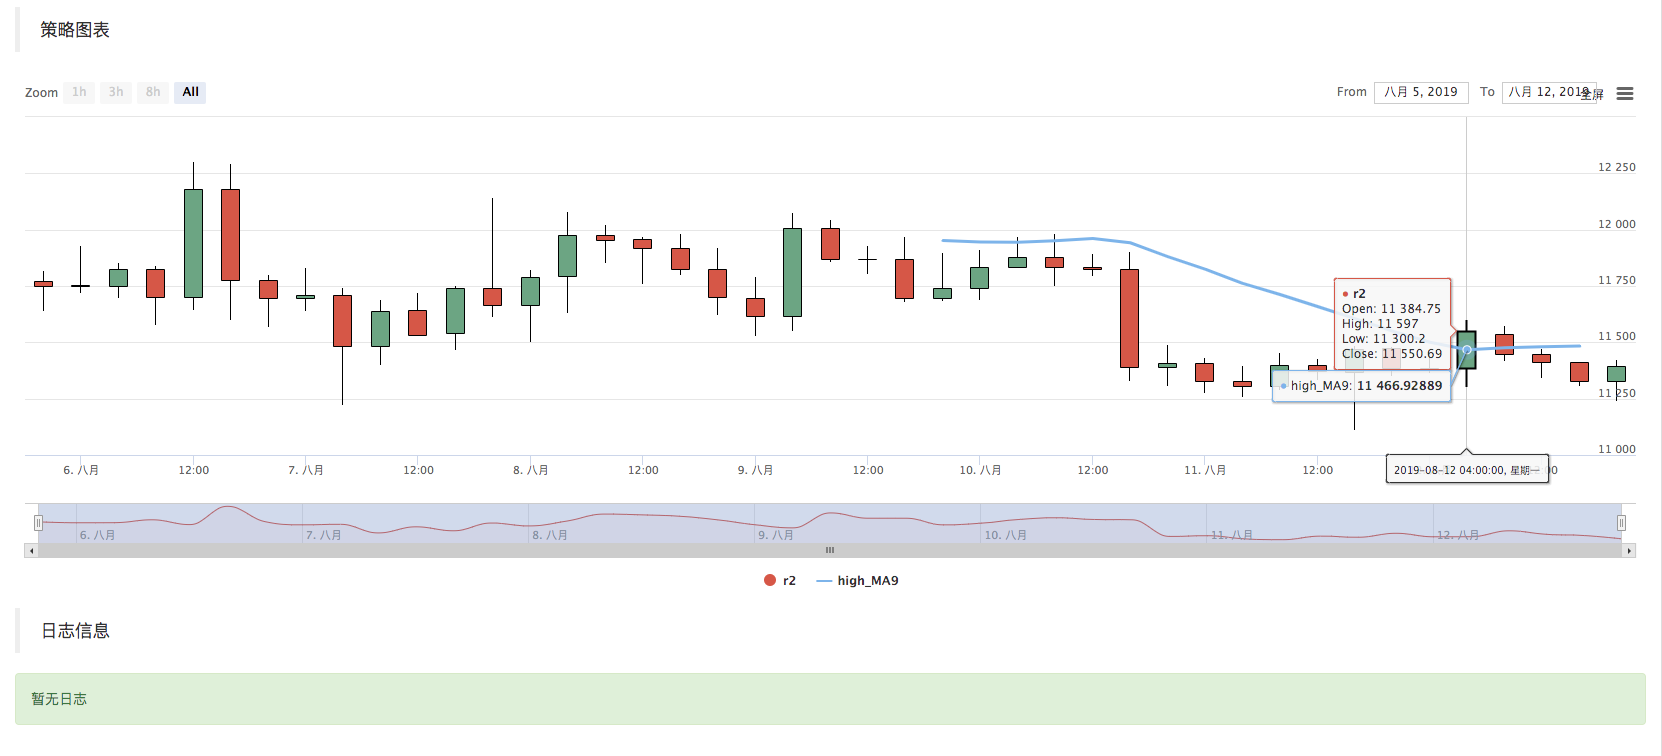
You can see that the mean line indicator for where the mouse stops in the graph is
11466.9289The above code can be copied to run the test in the policy, remember to save it after selecting "Draw Line Library!"
-
How to get K-line data on the cryptocurrency market
The inventors of the QT platform already have a wrapped interface, the exchange.GetRecords function, which can get the K-line data. The focus below is on directly accessing the exchange's K-line data interface to obtain data, as sometimes parameters need to be specified to obtain more K-lines, wrapped in the GetRecords interface. Generally returns 100. If you encounter a strategy that initially requires more than 100 K-strings, you need to collect a wait. To make the policy work as quickly as possible, you can wrap a function yourself, access the exchange's K-line interface directly, and specify parameters to get more K-line data.
With the example of BTC_USDT trading pairs, we achieve this need:
To find the API documentation of the exchange, see the description of the K-line interface:
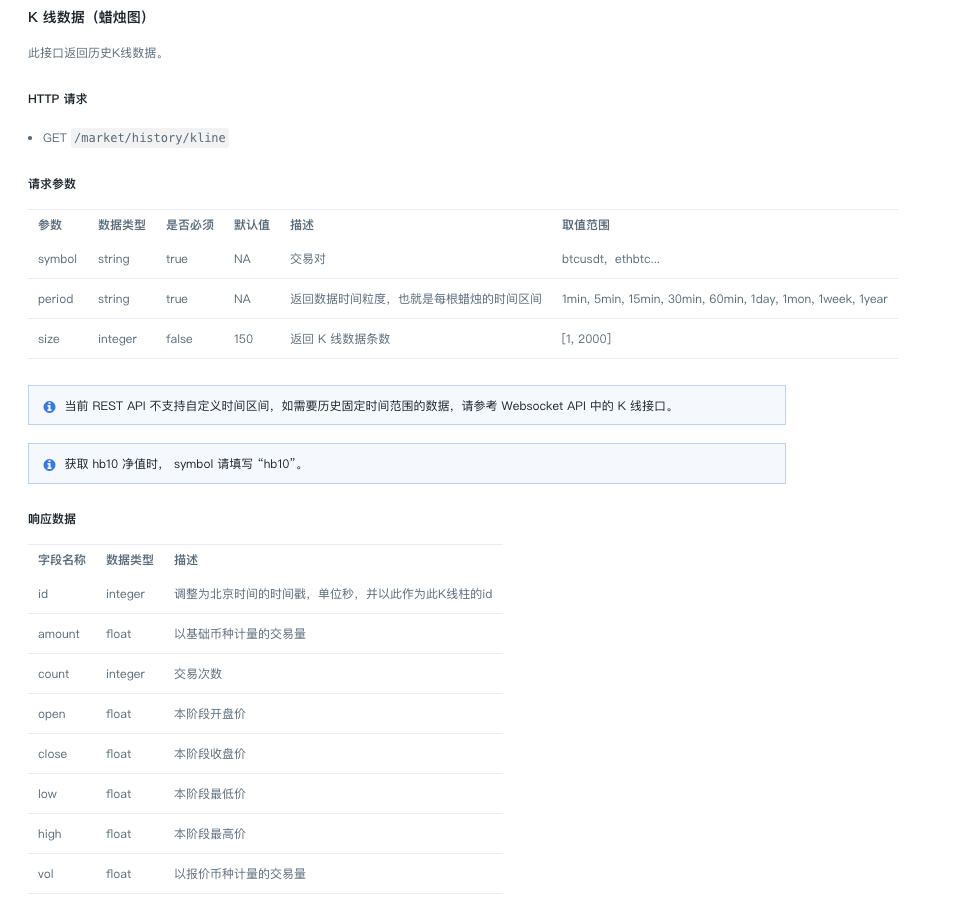
https://api.huobi.pro/market/history/kline?period=1day&size=200&symbol=btcusdtParameters are:
Parameter name Types Is it necessary? Describe Valuation symbol string true The deal. btcusdt, ethbtc… period string true Returns the data time grain, which is the time interval for each node. 1min, 5min, 15min, 30min, 60min, 1day, 1mon, 1week, 1year size integer false Returns the number of data lines in K [1, 2000] The test code is:
function GetRecords_Huobi (period, size, symbol) {
    var url = "https://api.huobi.pro/market/history/kline?" + "period=" + period + "&size=" + size + "&symbol=" + symbol
    var ret = HttpQuery(url)

    try {
        var jsonData = JSON.parse(ret)
        var records = []
        for (var i = jsonData.data.length - 1; i >= 0 ; i--) {
            records.push({
                Time : jsonData.data[i].id * 1000,
                High : jsonData.data[i].high,
                Open : jsonData.data[i].open,
                Low : jsonData.data[i].low,
                Close : jsonData.data[i].close,
                Volume : jsonData.data[i].vol,
            })
        }
        return records
    } catch (e) {
        Log(e)
    }
}


function main() {
    var records = GetRecords_Huobi("1day", "300", "btcusdt")
    Log(records.length)
    $.PlotRecords(records, "K")
}
Python version, an example of how to access a token exchange interface:
#!python3
import json
import urllib2

def GetRecords_Huobi(period, size, symbol):
    headers = {'User-Agent':'Mozilla/5.0 (Windows; U; Windows NT 6.1; en-US; rv:1.9.1.6) Gecko/20091201 Firefox/3.5.6'}
    url = "https://api.huobi.pro/market/history/kline?" + "period=" + period + "&size=" + size + "&symbol=" + symbol
    request = urllib2.Request(url)
    request.add_header('User-Agent','Mozilla/5.0 (Windows; U; Windows NT 6.1; en-US; rv:1.9.1.6) Gecko/20091201 Firefox/3.5.6')
    opener = urllib2.build_opener()
    f= opener.open(request)
    ret = f.read().decode('utf-8')

    try :
        jsonData = json.loads(ret)

        records = []
        for i in range(len(jsonData["data"]) - 1, -1, -1):
            records.append({
                "Time" : jsonData["data"][i]["id"] * 1000,
                "High" : jsonData["data"][i]["high"],
                "Open" : jsonData["data"][i]["open"],
                "Low" : jsonData["data"][i]["low"],
                "Close" : jsonData["data"][i]["close"],
                "Volume" : jsonData["data"][i]["vol"],
            })
        return records
    except Exception as e:
        Log(e)

def main():
    r = GetRecords_Huobi("1day", "300", "btcusdt")
    Log(len(r))
    ext.PlotRecords(r, "K")   # 需要引用Python画线类库
Python version, an example of a K-line interface to access the Binance exchange:
#!python3
import json
import urllib2

def GetRecords_Huobi(period, size, symbol):
    headers = {'User-Agent':'Mozilla/5.0 (Windows; U; Windows NT 6.1; en-US; rv:1.9.1.6) Gecko/20091201 Firefox/3.5.6'}
    url = "https://api.binance.com/api/v3/klines?symbol=" + symbol + "&interval=" + period
    request = urllib2.Request(url)
    request.add_header('User-Agent','Mozilla/5.0 (Windows; U; Windows NT 6.1; en-US; rv:1.9.1.6) Gecko/20091201 Firefox/3.5.6')
    opener = urllib2.build_opener()
    f= opener.open(request)
    ret = f.read().decode('utf-8')
    try :
        jsonData = json.loads(ret)

        records = []
        for i in range(len(jsonData)):
            records.append({
                "Time" : float(jsonData[i][0]),
                "High" : float(jsonData[i][2]),
                "Open" : float(jsonData[i][1]),
                "Low" : float(jsonData[i][3]),
                "Close" : float(jsonData[i][4]),
                "Volume" : float(jsonData[i][5]),
            })
        return records
    except Exception as e:
        Log(e)

def main():
    r = GetRecords_Huobi("1m", "300", "BTCUSDT")
    Log(len(r))
    ext.PlotRecords(r, "K")   # 需要引用Python画线类库
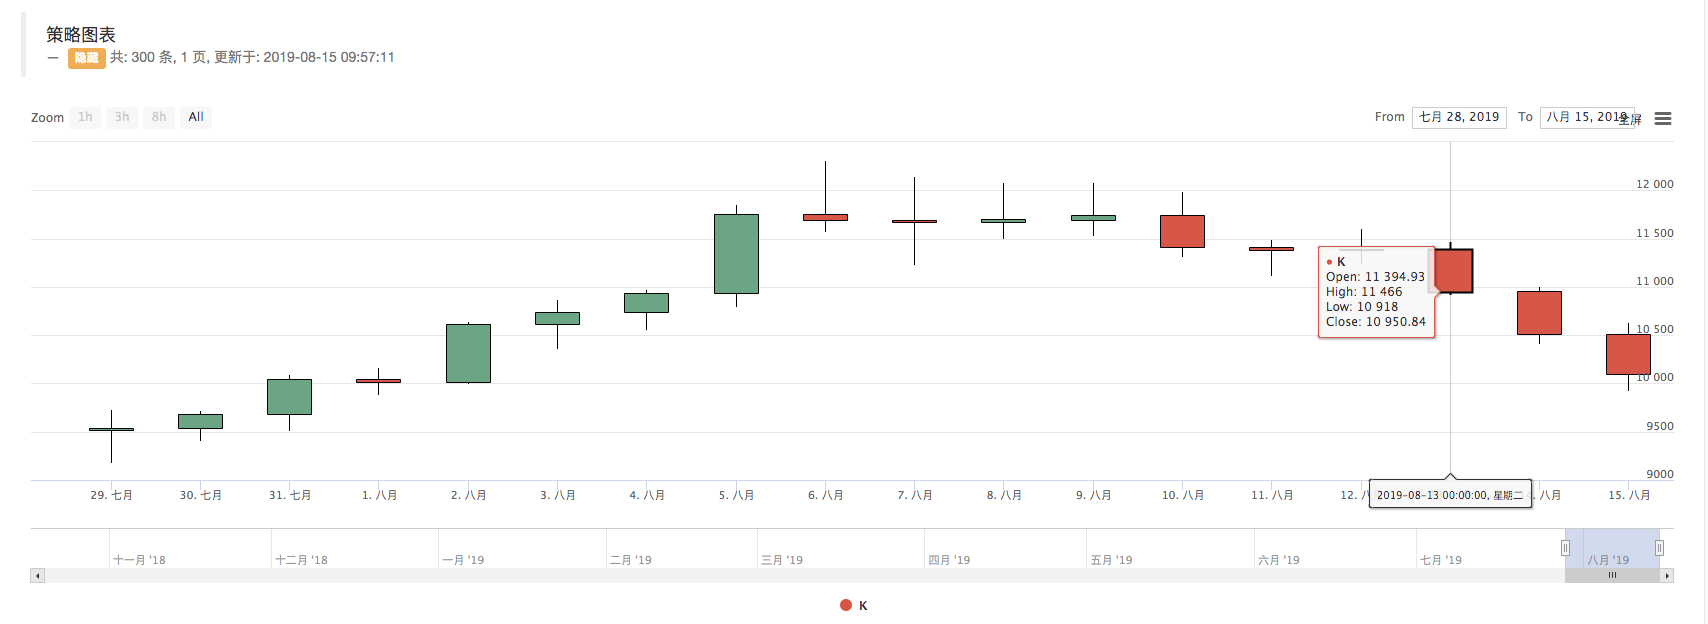
As you can see in the log, print records.length is 300, which means records K line data bar has 300 characters.
- Quantifying Fundamental Analysis in the Cryptocurrency Market: Let Data Speak for Itself!
- Quantified research on the basics of coin circles - stop believing in all kinds of crazy professors, data is objective!
- The inventor of the Quantitative Data Exploration Module, an essential tool in the field of quantitative trading.
- Mastering Everything - Introduction to FMZ New Version of Trading Terminal (with TRB Arbitrage Source Code)
- Get all the details about the new FMZ trading terminal (with the TRB suite source code)
- FMZ Quant: An Analysis of Common Requirements Design Examples in the Cryptocurrency Market (II)
- How to Exploit Brainless Selling Bots with a High-Frequency Strategy in 80 Lines of Code
- FMZ quantification: common demands on the cryptocurrency market design example analysis (II)
- How to exploit brainless robots for sale with high-frequency strategies of 80 lines of code
- FMZ Quant: An Analysis of Common Requirements Design Examples in the Cryptocurrency Market (I)
- FMZ quantification: common demands of the cryptocurrency market design instance analysis (1)
- A Dual Thrust digital currency quantified transaction strategy is implemented in Python
- Quantitative trading strategies for price dynamics analysis with Python
bamsmenCan the editor fix the problem? You can't synthesize k days in 3 hours or 6 hours.
bamsmenif (((1000 * 60 * 60 * 24) - sourceRecords[i].Time % (1000 * 60 * 60 * 24) + (n * 1000 * 60)) % targetCycle == 0) { isBegin = true I'm not sure. The problem with this sentence is that you can't synthesize k days with 3 hours or 6 hours, you can only synthesize k days with 1 hour, 2 hours, 4 hours.
xis2004If you have to climb all the historical data of a species, can you climb?
willzhangThank you for your reply.
willzhangPlease, what is the best way to handle if you want more than 300 bits? For example, 1000 K-line data.
The Little DreamI've been trying to find a way to change it.
The Little DreamThis is how much data the exchange gives you to access the interface data.
The Little DreamIf the maximum number of returns supported by the exchange interface is exceeded, this will only collect enough data, i.e. K-line data.