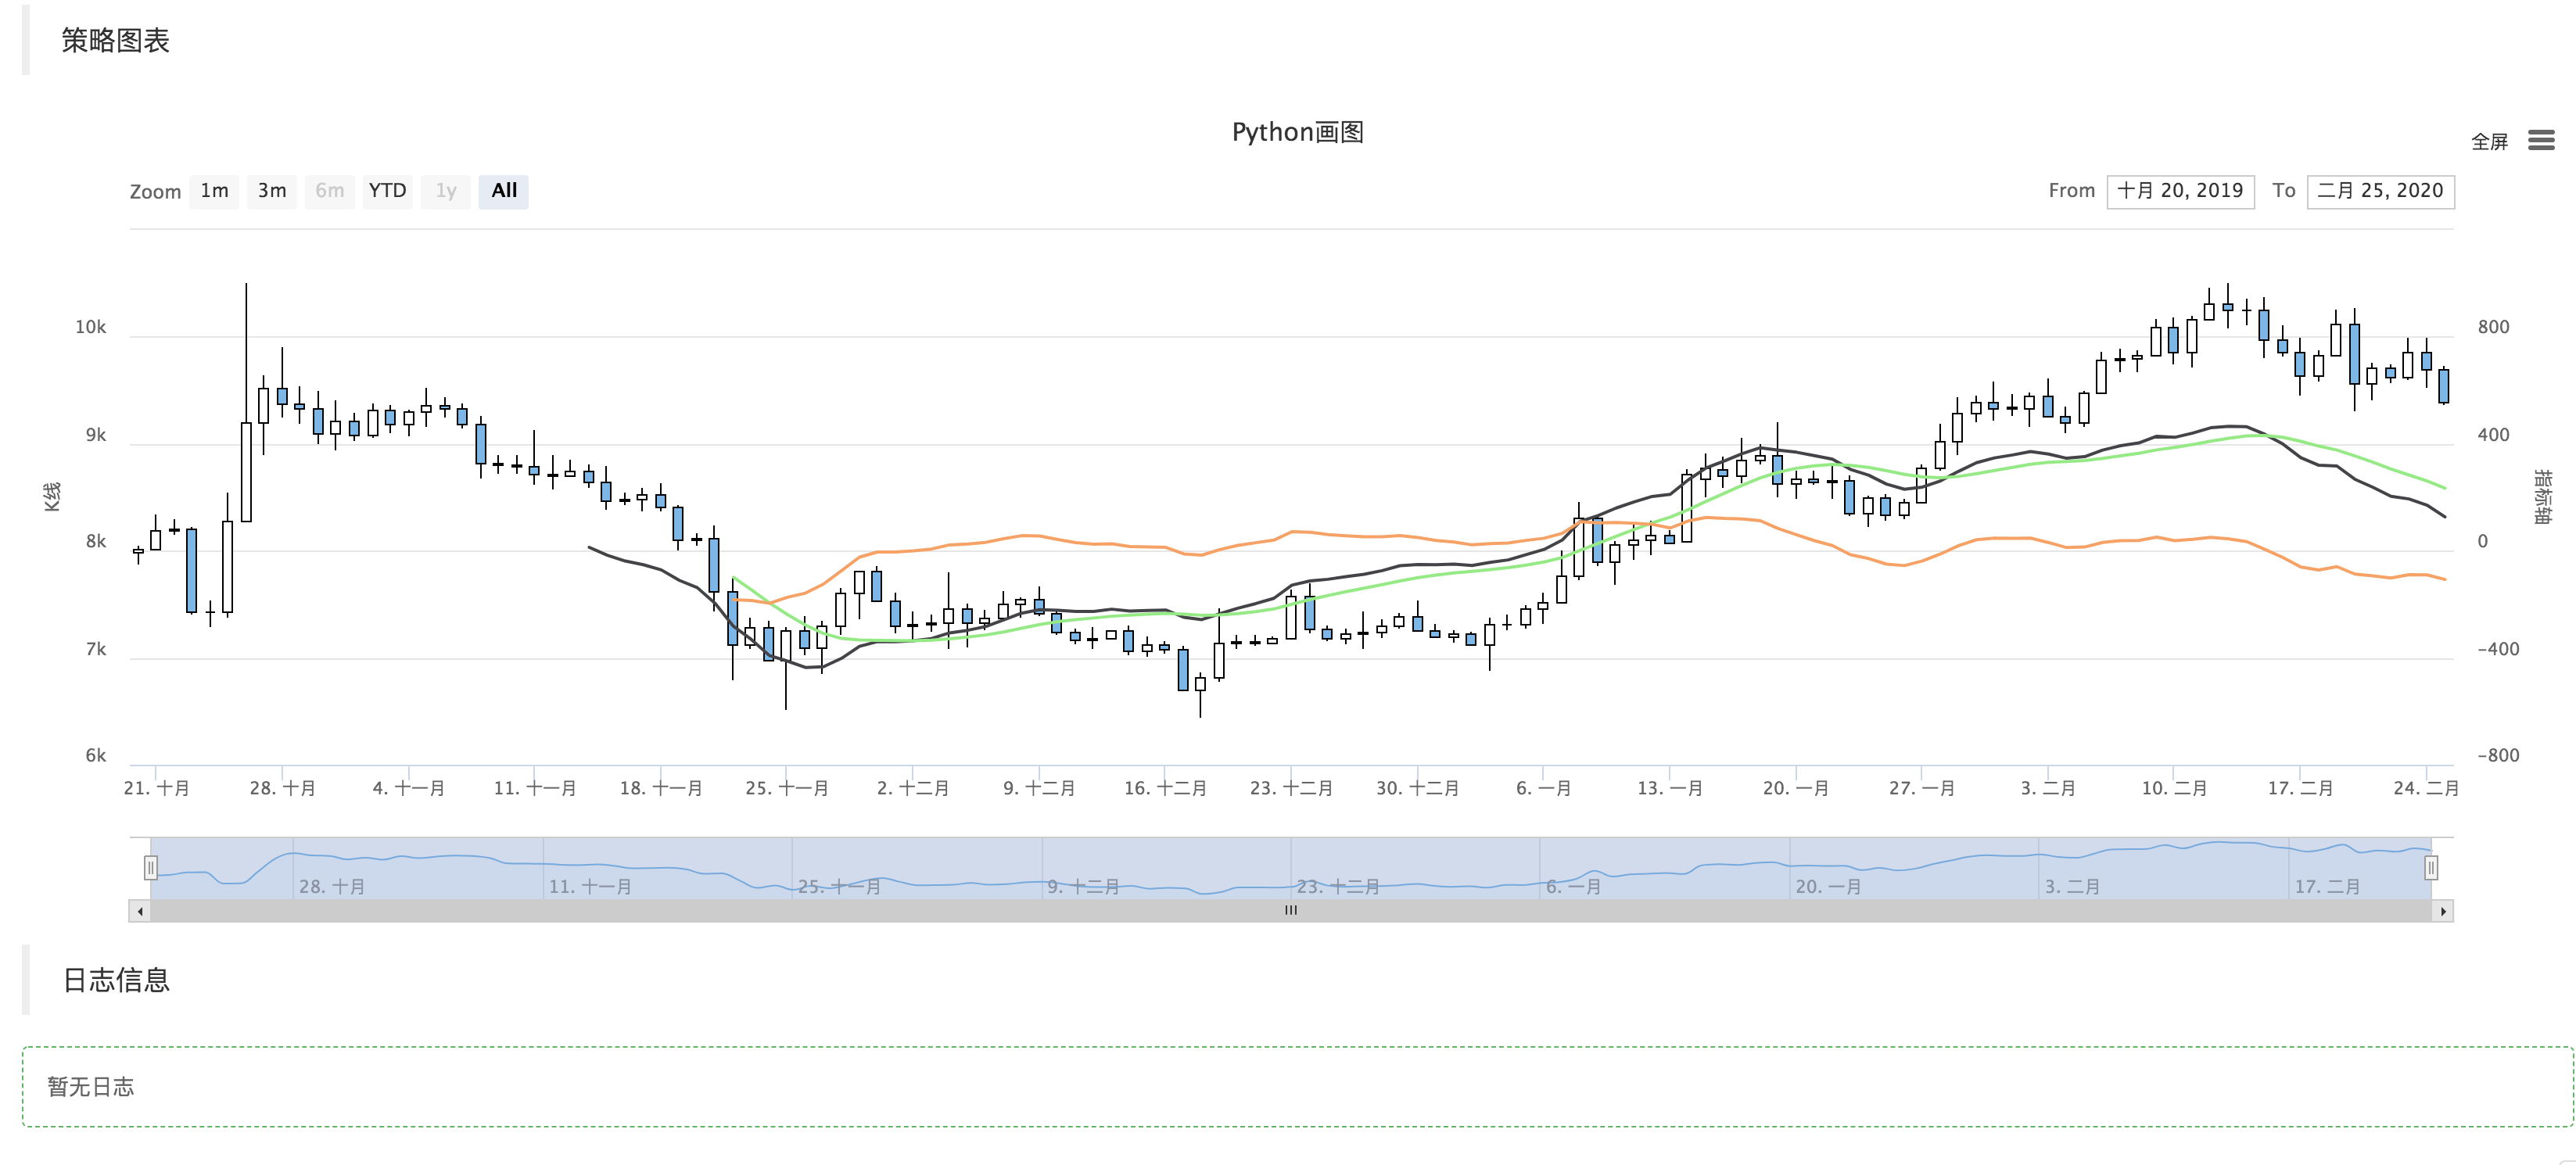
Python version of the MACD graph example
Author: The Little Dream, Created: 2020-02-27 19:18:17, Updated: 2023-10-09 22:50:01
Python version of the MACD graph example
In fact, before doing this example code, the inventors quantified the trading platform strategy in Square:https://www.fmz.com/strategy/151972There are already examples of MACD pointer diagrams in JavaScript. However, the user needs to write a Python version of the example to be used as reference code when developing a design diagram.
The code is very simple:
'''backtest
start: 2020-01-28 00:00:00
end: 2020-02-26 00:00:00
period: 1d
exchanges: [{"eid":"OKEX","currency":"BTC_USDT"}]
'''

ChartCfg = {
    '__isStock': True,
    'title': {
        'text': 'Python画图'
    },
    'yAxis': [{
        'title': {'text': 'K线'},
        'style': {'color': '#4572A7'},
        'opposite': False
    }, {
        'title': {'text': '指标轴'},
        'opposite': True
    }],
    'series': [{
        'type': 'candlestick',
        'name': '当前周期',
        'id': 'primary',
        'data': []
    }, {
        'type': 'line',
        'id': 'dif',
        'name': 'DIF',
        "yAxis" : 1,
        'data': []
    }, {
        'type': 'line',
        'id': 'dea',
        'name': 'DEA',
        "yAxis" : 1,
        'data': []
    }, {
        'type': 'line',
        'id': 'macd',
        'name': 'MACD',
        "yAxis" : 1,
        'data': []
    }]
}

def main():
    global ChartCfg
    preTime = 0
    chart = Chart(ChartCfg)
    chart.reset()
    while True:
        while True:
            r = _C(exchange.GetRecords)
            if len(r) > 50:
                break
        # 计算指标
        macd = TA.MACD(r)

        LogStatus(_D(), len(r))

        # 画图
        for i in range(len(r)):
            if r[i]["Time"] == preTime:
                chart.add(0, [r[i]["Time"], r[i]["Open"], r[i]["High"], r[i]["Low"], r[i]["Close"]], -1)
                chart.add(1, [r[i]["Time"], macd[0][i]], -1)
                chart.add(2, [r[i]["Time"], macd[1][i]], -1)
                chart.add(3, [r[i]["Time"], macd[2][i]], -1)
            elif r[i]["Time"] > preTime:
                chart.add(0, [r[i]["Time"], r[i]["Open"], r[i]["High"], r[i]["Low"], r[i]["Close"]])
                chart.add(1, [r[i]["Time"], macd[0][i]])
                chart.add(2, [r[i]["Time"], macd[1][i]])
                chart.add(3, [r[i]["Time"], macd[2][i]])
                preTime = r[i]["Time"]
        Sleep(500)
ChartCfg Chart configuration dictionary
This oneChartCfgA dictionary variable stores chart configuration information, such as:
How many lines are there in this graph? (three indicator lines, DIF, DEA, MACD)
Is there a K-line in this graph? (Candlestick type: This type is set to K-line data)
The MACD values are relatively small, and if the trading pair is BTC_USDT, the indicator will be compressed together when drawing the chart, so the chart will also be configured as two Y-axes.
Loading data
In this example strategy, the main function starts initializing the chart, calls the Chart function, configures the chart to ChartCfg as a parameter input, generates a chart object chart. Then goes into a loop, continuously obtaining K-line data, determining that the number of K-line data BAR is greater than 50 to calculate the MACD indicator (BAR is too small to calculate the valid indicator); then the K-line data and indicator data can be written to the chart. Write a method to a chart using the chart object add function. When writing, if the last parameter of the add function is specified -1, the value of the current data point is updated. If not passed -1, a new data point is added. When a new K-line BAR is generated, a new data point is added, and when a K-line BAR is not generated, the last BAR and the corresponding indicator are updated.
It can be directly measured.
It can also run on a hard disk: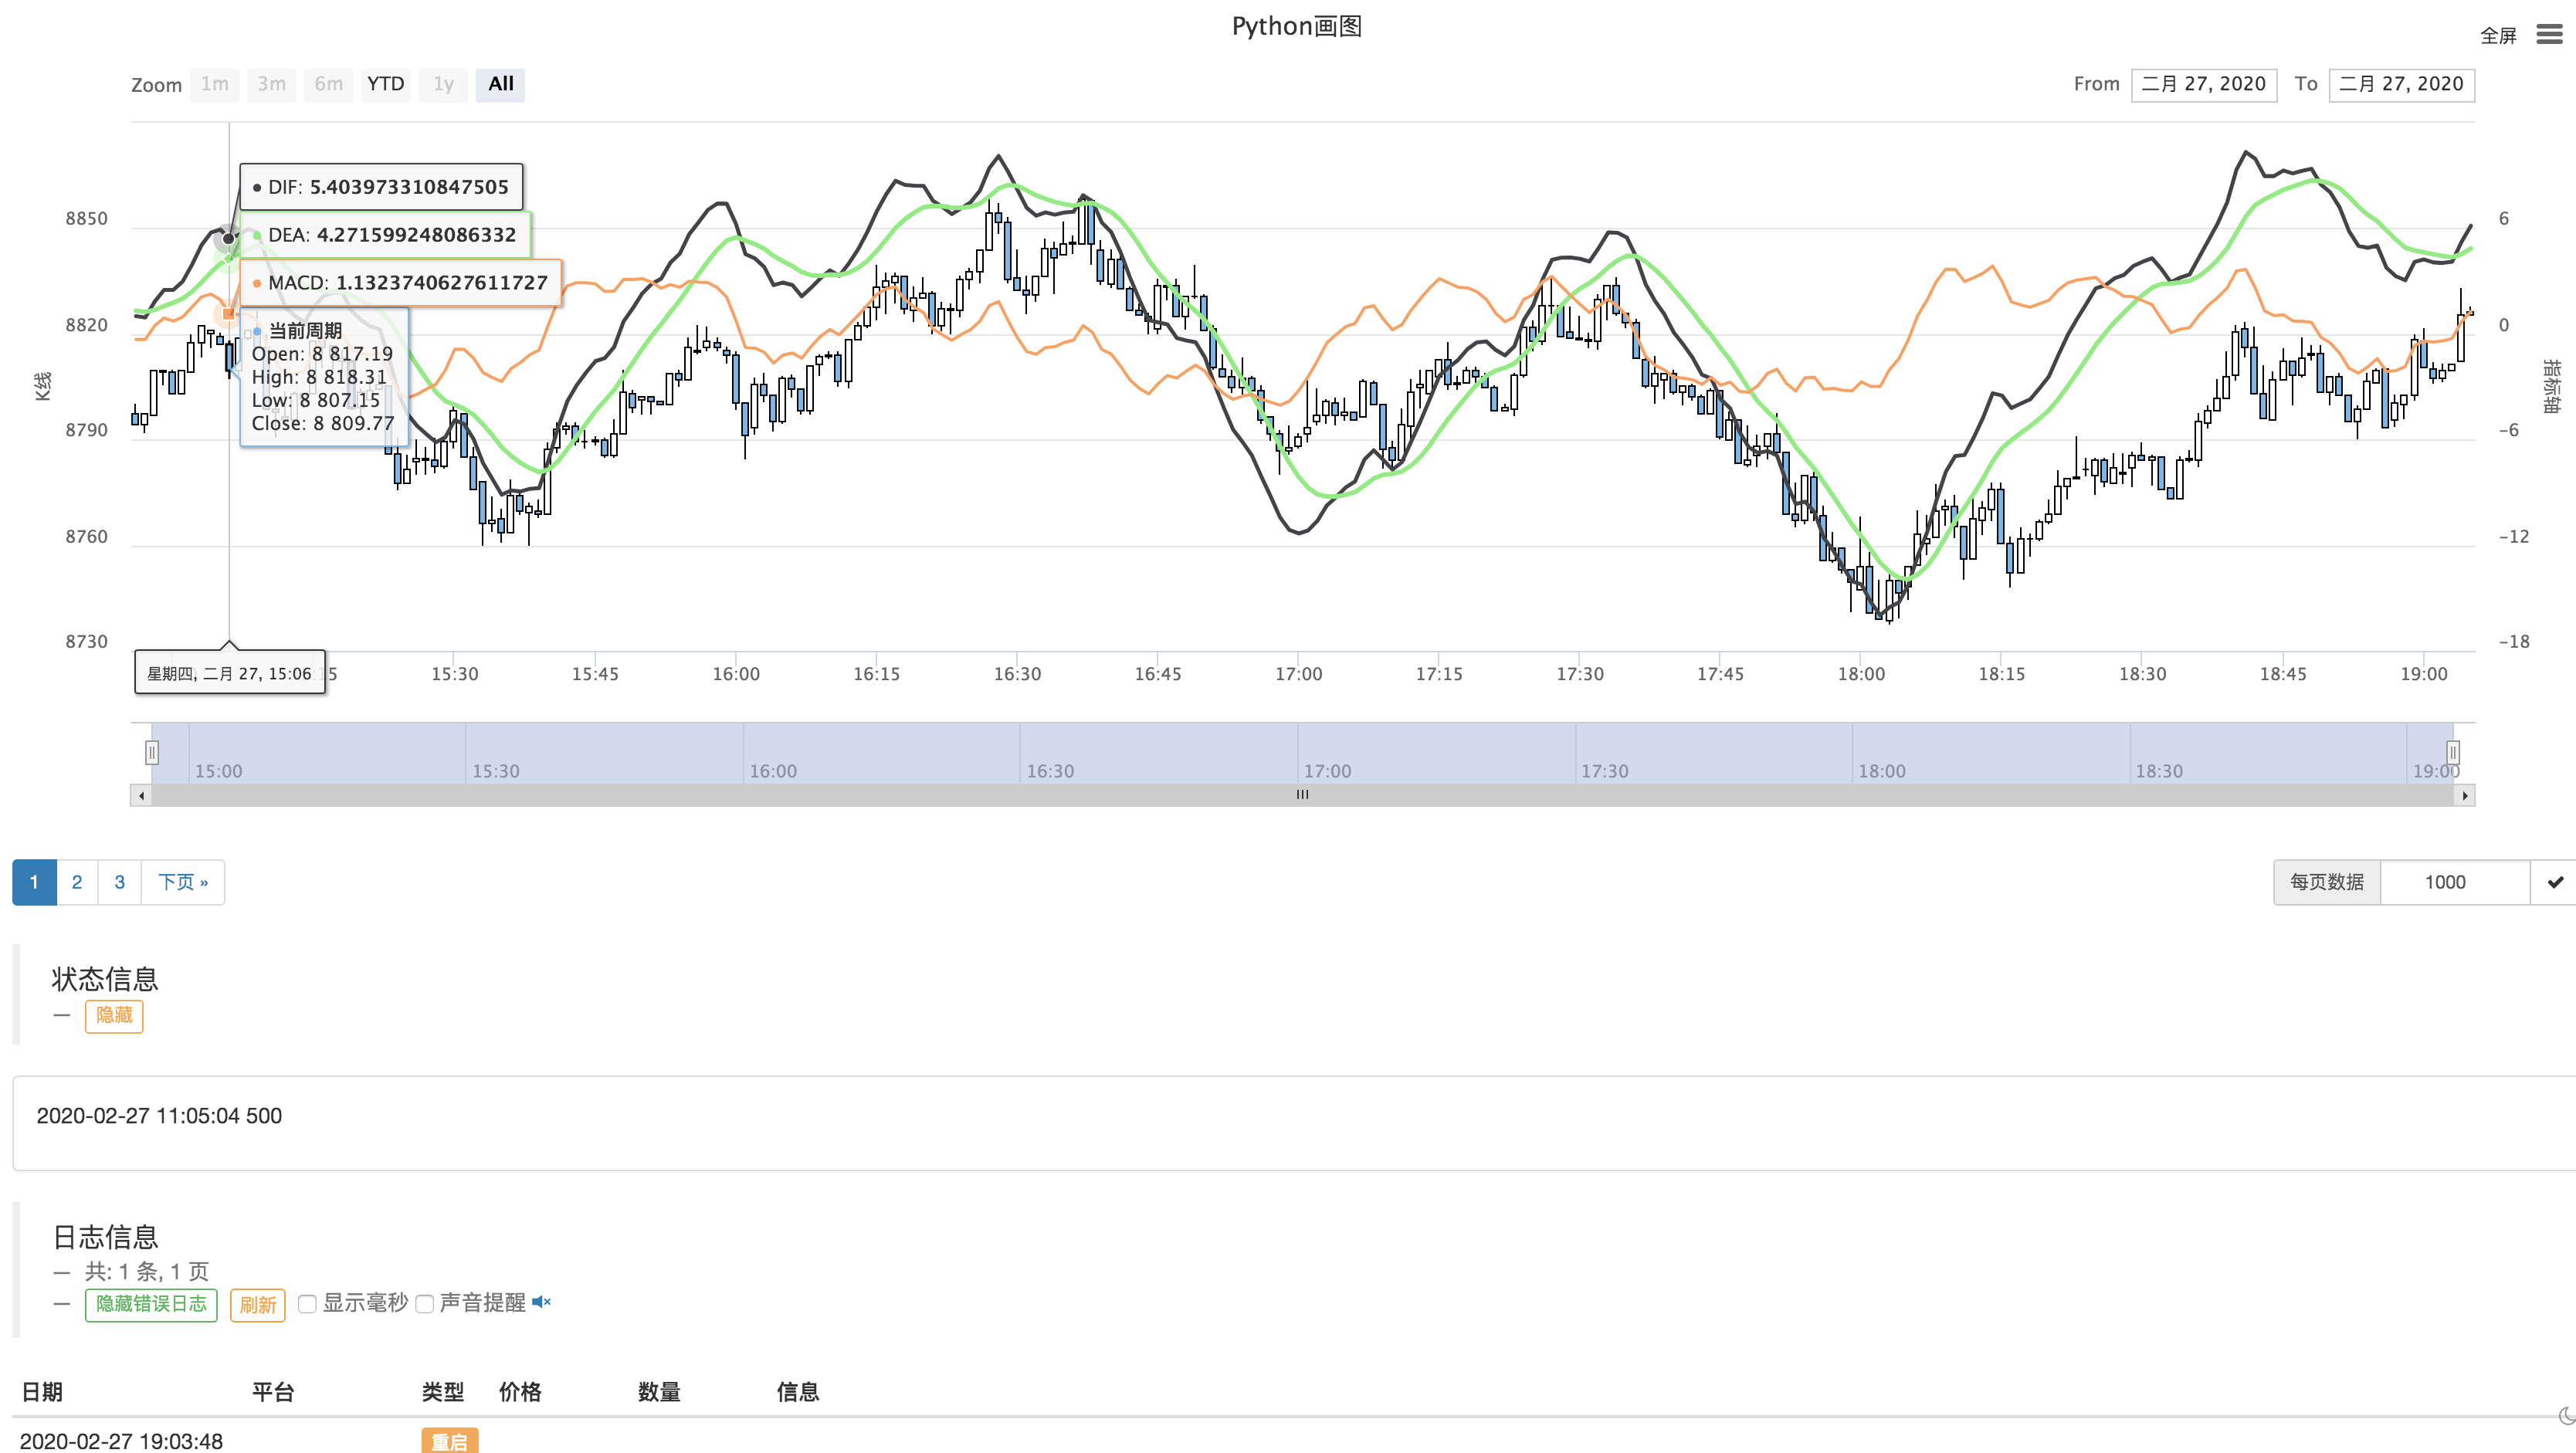
The following is the address of the strategic example:https://www.fmz.com/strategy/187379
If you have any questions, thank you for leaving a message.
- Quantifying Fundamental Analysis in the Cryptocurrency Market: Let Data Speak for Itself!
- Quantified research on the basics of coin circles - stop believing in all kinds of crazy professors, data is objective!
- The inventor of the Quantitative Data Exploration Module, an essential tool in the field of quantitative trading.
- Mastering Everything - Introduction to FMZ New Version of Trading Terminal (with TRB Arbitrage Source Code)
- Get all the details about the new FMZ trading terminal (with the TRB suite source code)
- FMZ Quant: An Analysis of Common Requirements Design Examples in the Cryptocurrency Market (II)
- How to Exploit Brainless Selling Bots with a High-Frequency Strategy in 80 Lines of Code
- FMZ quantification: common demands on the cryptocurrency market design example analysis (II)
- How to exploit brainless robots for sale with high-frequency strategies of 80 lines of code
- FMZ Quant: An Analysis of Common Requirements Design Examples in the Cryptocurrency Market (I)
- FMZ quantification: common demands of the cryptocurrency market design instance analysis (1)