Quantifying the coin circle is a whole new thing - it brings you closer to quantifying the coin circle.
Author: The Little Dream, Created: 2021-04-19 14:16:21, Updated: 2023-09-24 19:30:05
The coin circle quantification transaction is a new look and brings you closer to the coin circle quantification.
In the previous article we talked about programmatic trading scripts. In fact, the trading strategy is a trading script. The article mainly talks about the trading script that needs to have a hardware carrier (where the program runs), which can be written in the computer programming language (listed three programming languages used in the inventor's quantitative trading platforms, of course, the programmatic trading itself can be implemented using any programming language implementation strategy).
Programmed transaction scripts
-
Types of trading strategies Beginners to programmatic trading and quantitative trading may be confused by the terms trend strategy, arbitrage strategy, high-frequency strategy, grid strategy, etc. In fact, programmatic trading and quantitative trading are common strategies in several directions.
- How to hedge against leverage Simply put, a strategy such as holding a long position and a short position can be classified as a leverage strategy. There are many specific types, such as spot cross-market, futures cross-period, spot leverage, cross-variety leverage, and so on.
- Trending strategies In simple terms, it is a strategy of tracking the trend of holding orders, double even lines, MACD and so on.
- The return strategy For example, grid strategies that take advantage of price fluctuations in volatile markets.
- High frequency strategy Simply put, it is a strategy to conduct high-frequency trading by using algorithms to uncover the market's microstructure, patterns, opportunities, etc.
The above is divided from the point of view of trading strategies, and from the point of view of strategy design on inventors' quantitative trading platforms, strategies can also be divided into:
- The single-variety strategy This means that the strategy only operates on one variety, such as BTC trading or ETH trading.
- Multicultural strategies In simple terms, it is a strategy to operate multiple varieties according to a single logic.
- Multi-account policy Simply put, it is a real-time configuration of multiple exchange objects (the concept of the exchange has been introduced in the previous article, the exchange object configuration of the API KEY represents an exchange account); for example, some listing policies, multiple accounts follow operations together (may be the same exchange, or may be different exchanges), in short, one real-time management of multiple exchange objects (accounts).
- Multiple logical strategies For example, the MACD strategy, the straight line strategy, the grid strategy, etc. are designed simultaneously on a real disk (of course, operating different exchange objects, operating the same exchange objects to see if the specific strategy is logically conflicted).
-
Exchange API interface The answer is the API interface that is opened through the exchange. In the previous article, we discussed REST, Websocket interfaces in general. Here we add a bit of concept from the policy level. Exchange interfaces are divided according to whether they are validated (REST, Websocket are both validated and non-validated).
-
Interfaces that do not require authentication Commonly referred to as public interface pins, these types of interfaces do not require verification
API KEYThese interfaces are generally market interfaces, such as asking for deep market, asking for K-line data, asking for capital rates, asking for information about trade varieties, asking for exchange server timing, etc. Simply put, an interface that is basically unrelated to your account can be roughly determined to be a public interface (no authentication required).
In the inventor's quantified trading platform, when calling an unauthenticated API function (wrapping exchange non-authenticated interface, public interface) even if the API KEY is configured incorrectly, the data returned to the interface can be normally retrieved. -
Interfaces that need to be verified Simply put, the interface that needs to be authenticated (authentication via API KEY) is called a private interface. These interfaces are usually associated with some operation or information about your account, such as querying account assets, querying account holdings, querying hang ups, query transfers, transfers, currency adjustment leverage, setting holdings mode, etc. These operations must be verified. In the inventor's quantified trading platform, the API function that needs to be validated when called (interface that needs to be validated, private interface of the encapsulated exchange) will return a blank value if the API KEY is configured incorrectly, and an error will occur when the interface is called.
So how are these interfaces used on inventors' quantitative trading platforms?
The inventor quantified trading platform encapsulates the behavior of the exchange and defines consistent interfaces (e.g. K-line interfaces, deep market interfaces, current asset query interfaces, downlink interfaces, withdrawal interfaces, etc.), which are called the inventor quantified trading platform API functions on the inventor quantified trading platform and can be accessed by querying the API documentation.https://www.fmz.com/api )。
So how do some of the behavioral, non-uniformly defined exchange interfaces work on inventors' quantitative trading platforms?
These interfaces are used for examples: asset allocation, conditional assignment, bulk ordering, bulk withdrawal, modification of orders, etc. These interfaces are available on some exchanges and not on others, and the functionality and usage details may vary greatly, so these interfaces are passed on to the inventor's quantitative trading platform.
exchange.IOThis function can be accessed by visiting the inventor's API documentation:https://www.fmz.com/api#exchange.io..There are also a few practical IO examples in the inventors' QE strategy forum.Will all the API functions in the inventor's API documentation generate network requests?
Let's say that the exchange API interface has a frequency limitation (e.g. 5 times a second), access cannot be too frequent or it will report an HTTP 429 error, and access is refused (most exchanges report 429). Not all inventors' API functions for quantitative trading platforms generate network requests, and some inventors' API functions simply modify some local settings, such as setting the current trading pair, setting the contract code, indicator calculation functions, obtaining the name of the exchange object, etc. Basically, the function's use can be used to determine whether a network request is being made, as long as the network request is generated to obtain exchange data, operations on exchange accounts, etc. These interfaces need to pay attention to call frequency.
-
Here are a few common questions and experiences that inventors have when using API functions for their quantitative trading platforms.
-
Let it go. This is the most common mistake, which has been troubling countless newbies, often the tactic is to check back and everything is fine, why is the hard drive running for a while (can trigger at any time) and the hard drive hangs off ~
When writing a policy, we need to verify the data returned by the interface, for example, to get the following line of code on the inventor's quantitative trading platform (it is the same to write your own program to directly access the exchange interface):
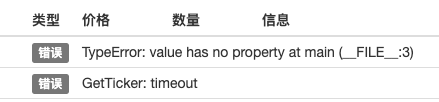
var ticker = exchange.GetTicker()And if we need to use this,tickerVariables (see structure returned by the GetTicker function)Last(Recent prices) This data, we need to use.var newPrice = ticker.LastThis will get the data ((newPrice is what? new: latest, Price: price, yes! combined!) at this point, ifGetTicker()The function returns normal data, but if there is a request overtime, network error, exchange disconnection, cable cutting, bear kid pulling the plug, etc.GetTicker()The function returnsnull❖ At this timetickerThe value isnullI'll visit it again.LastThis is the first time that a policy has been suspended due to a procedural error. It appears that the interface call failure (GetTicker call failure returns null) is not the direct cause of the policy disk stop (the direct cause is access to anullA variable's attribute), an interface call failure report is not a failure that causes the disk to stop (strike point). So what can we do to prevent the disk from stopping abnormally? The answer is to allow errors to be made in the data that the interface returns, and it's very simple to just judge whether the data is returned or not.null(JavaScript language example, other languages basically the same) Write a short code paragraph to explain (this is just an illustration, running directly is not an option!)var ticker = exchange.GetTicker() if (ticker) { var newPrice = ticker.Last Log("打印最新价格:", newPrice) } else { // 数据为null,不做操作就不会出问题 }It's not just
GetTickerInterfaces that have network requests need to be error tolerant (if you use a function's return value) There are many ways to forgive mistakes._C()Functions (see FMZ API documentation), write their own error tolerance functions, design their own error tolerance mechanisms, logic. About the_C()The use of functions, and many of the new students are probably using them wrong, be careful._C()The parameters of a function are function references, not function calls._C(funcName, param1, param2), called correctly, funcName without parentheses, param1, param2 is the parameter to be passed to funcName._C(funcName(param1, param2))This is a common error in the FMZ API documentation. -
The following order quantity for the spot market price order In the previous post, we talked about the amount of the order (which is usually the amount of the order) (extremely different exchanges may have different settings, and these special settings on FMZ are usually explained in the FMZ API documentation). The transaction pair is set to:
LTC_USDTfunction main() { exchange.IO("simulate", true) // 切换为OKEX交易所的模拟盘 exchange.Buy(-1, 1) // 价格是-1,表示下的订单为市价单,数量为1表示下单量是1USDT }Since exchanges generally have an order limit, orders below the limit are not pre-ordered (e.g. Binance Cash requires that each order greater than 5 USDT is successful).
错误 Buy(-1, 1): map[code:1 data:[map[clOrdId: ordId: sCode:51020 sMsg:Order amount should be greater than the min available amount. tag:]] msg:] -
The direction of the futures The downside of making a futures strategy is that beginners often make mistakes that lead to problems, for example when writing a strategy on inventors' quantitative trading platforms. Let's first look at the description in the API documentation:https://www.fmz.com/api#exchange.setdirection...
So we have a function that's going to have a function that's going to have a
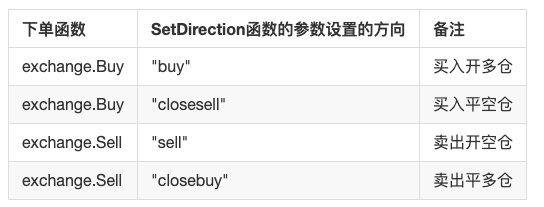
Buy,SellHowever, if the futures (of course, there is no problem, the futures are only buying and selling) have open, low, open, and empty directions, then obviously Buy/Sell does not represent so many directions, so you need to introduce this function to set the futures trading direction.exchange.SetDirection()I'm not sure. On the FMZexchange.SetDirection("buy")(pre-set direction) andexchange.BuyIf the following order is used in conjunction, it means that the order is for multiple positions. I'm not sure what to say.exchange.SetDirection("sell")andexchange.SellThe following list shows the order of the open stock.exchange.SetDirection("closebuy")andexchange.SellIf the following order is used in conjunction, it means that the order is in a flat multiple order.exchange.SetDirection("closesell")andexchange.BuyThe following table shows the order of the empty storage space. Usually, they are new.exchange.SetDirection("sell")andexchange.BuyThis is a logical fallacy, which is obviously a logical fallacy, and obsessive-compulsive disorder cannot be tolerated. Another common mistake made by Liu Xiaobofunction main() { exchange.SetContractType("quarter") // 设置当前合约为季度合约 exchange.SetDirection("sell") var id = exchange.Sell(-1, 1) Log("看我市价单下单了,成交了,就有持仓了", exchange.GetPosition()) exchange.SetDirection("closebuy") // closebuy 和Sell 搭配使用,嗯没错~ exchange.Sell(-1, 1) }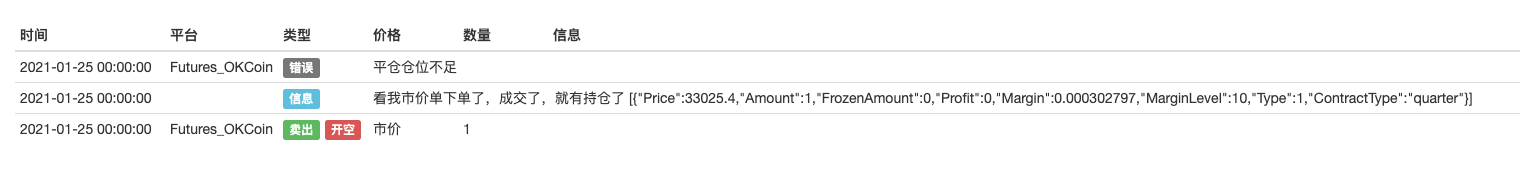
Seeing this will ask: Why do I have a holding and closebuy and sell are also used together, how can I report a mistake, can't I level up? Another situation in which this error may occur is that the position is set correctly, the function is used correctly, and the position is held in this direction, but the error is still reported. The reason is that it is possible that your program has placed multiple orders, the initial order is not settled, the settlement order is hanging in the register waiting for settlement, when the program continues to settle, it will prompt an error beyond the settlement position. -
Log output, display of transaction information Design writing programming, quantifying transaction strategies from unopened data to display keys, keylogging output keys, etc. Design of machine interaction. For example: python
printI'm not sure. JavaScript is usedconsole.logI'm not sure. Golang usedfmt.Println()I'm not sure. Use of C++coutIn addition, the information on the FMZ platform shows that there are two main locations where the information is displayed on the inventor's quantitative trading platform.
-
Status bar After the hard drive is up and running, the hard drive page looks like this:

The status bar is used to display some real-time changes (because real-time changes require real-time observation and cannot be printed into logs every time, such data can be displayed in the status bar, if each log is printed, there will be a lot of repetitive meaningless data, affecting the query). Use of data on the status bar
LogStatusFunctions can be found in FMZ's API documentation. -
Diary of a Wimpy Kid The same is true on the desktop page, as shown in the diagram:

The display is part of the log tab, which is mainly used to permanently record some data at a certain time, or to record some operation that was planned at a certain time. There are several types of logs: 1, General logs, using the Log function output in the policy of FMZ, print in the policy log.

2, the following log, used in FMZ's policy
exchange.Sell/exchange.BuyThe logs are automatically exported.
3 Use in FMZ's policy of withdrawing logs
exchange.CancelOrderIn addition, the logs will be automatically exported to the logs.
4, error logs, FMZ policy runs, when the interface that performs the network request is called incorrectly, when an exception is thrown (e.g. a statement such as throw), it will automatically output an error log in the log.

The FMZ API functions, which can produce log output functions such as Log ((...), exchange.Buy ((Price, Amount), exchange.CancelOrder ((Id) etc. can be used with some additional output parameters after the necessary parameters, such as: exchange.CancelOrder ((orders[j].Id, orders[j]) so that when cancelling the order orders[j] this order information is enclosed.
function main() { Log("数据1", "数据2", "数据3", "...") var data2 = 200 var id = exchange.Sell(100000, 0.1, "附带数据1", data2, "...") exchange.CancelOrder(id, "附带数据1", data2, "...") LogProfit(100, "附带数据1", data2, "...") } -
-
Use of indicator functions Before we talk about indicator functions, let's first understand what indicators are, which are simply lines like the equator, MACD, ATR, etc. Q: How did these indicators come about? A: Of course it is calculated. Q: What is the calculation based on? A: Based on K-line data. Q: Can you give me an example? A: In the simplest example of an indicator-average indicator, if we use the K-line (i.e. a sunline or a ray of light representing a day) as the data source for the indicator calculation. The average indicator parameter is 10, then the averaged indicator calculated is the 10-day average. Q: Can we calculate the mean linear exponent if the number of k-line BARs is less than 10 bits? A: Not only is it impossible to calculate the mean line indicator, any indicator cannot calculate the valid indicator value when the number of K-line data BAR does not meet the parameters of the indicator cycle.
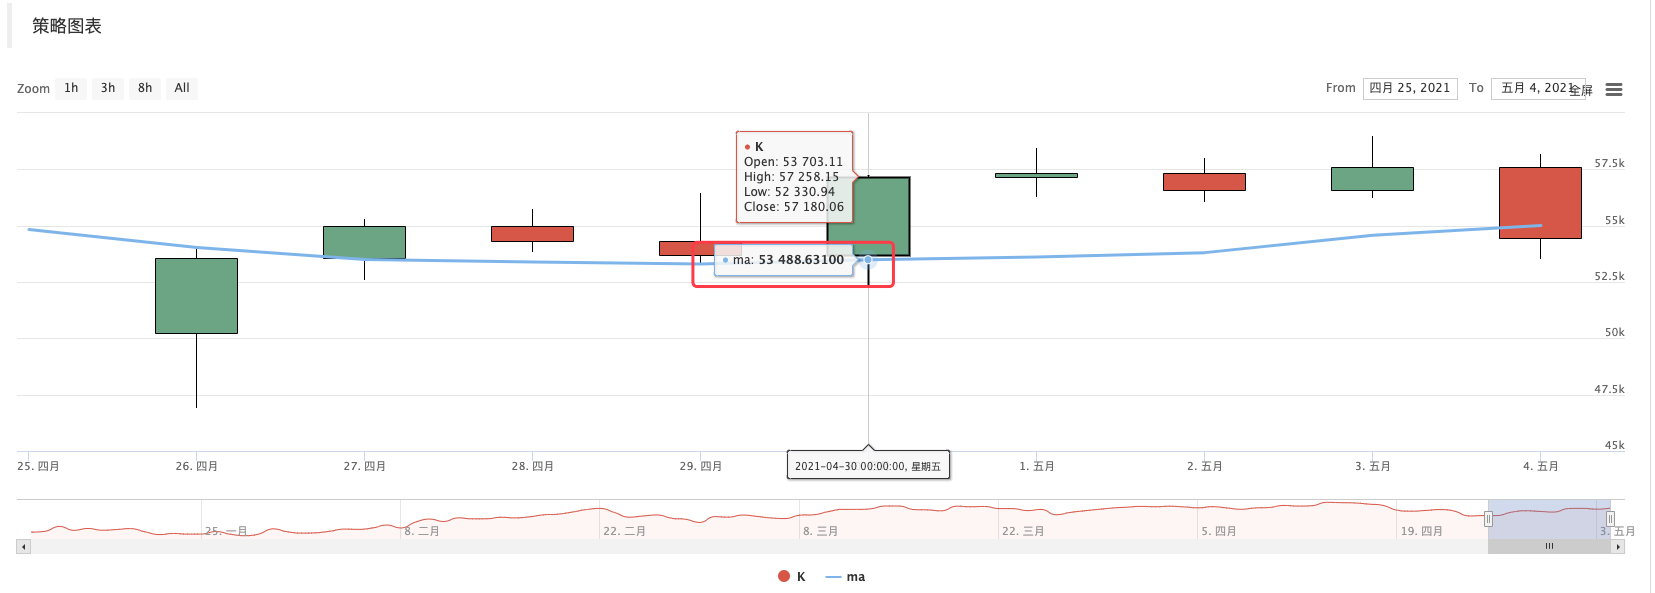
JavaScriptThe language policy will display the calculated indicator data when printed.null。In the meantime, I'm going to share with you some of the lessons that I learned from my experience.https://www.fmz.com/strategy/125770To retest this teaching example strategy, you can see the graphs generated by the retest system and the averages of the 10 cycles:
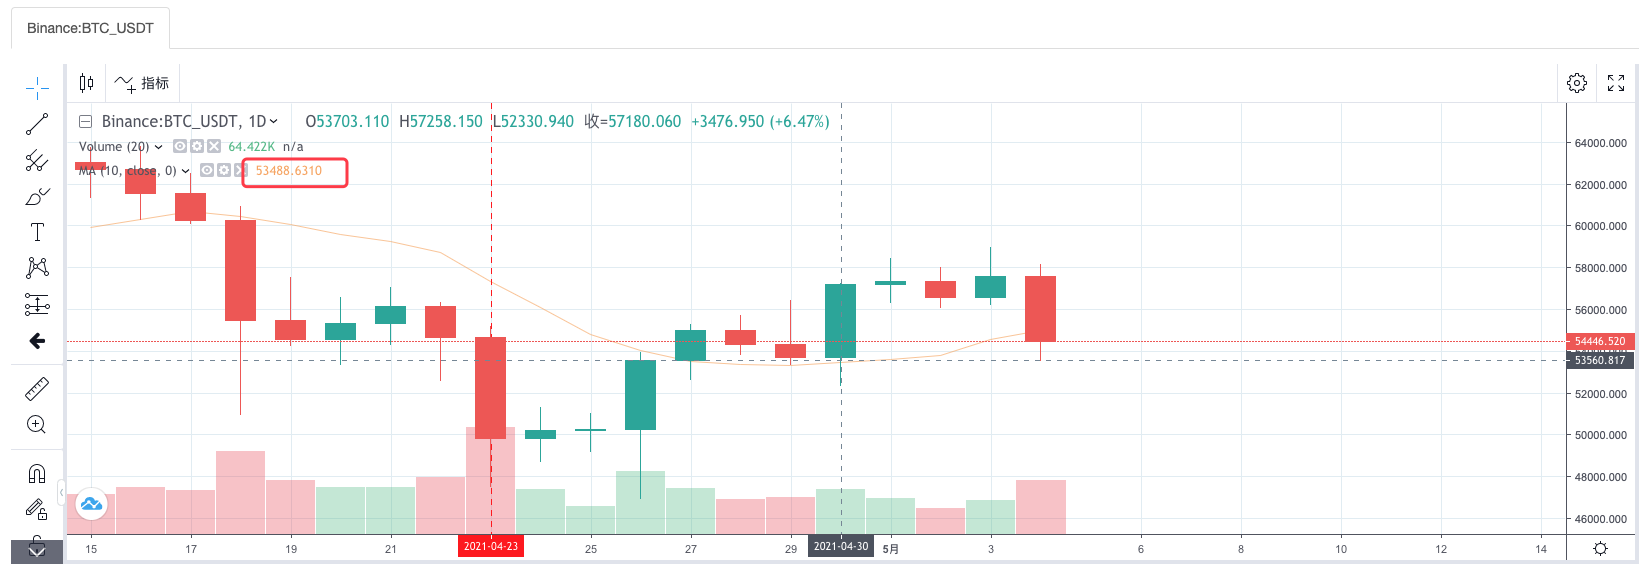
The strategy is to customize drawings, drawn K-lines, and evenline charts:
Q: What if I want a 10-hour average? A: K-line data can be used for hourly cycles.
It is commonly said that the K line we see, after we have dated it, is an array (the concept of the array is not understood, it can be broken down), in which each element is a K line column, arranged in order, the first element of the array is the furthest from the current time, and the last element of the array is the closest to the current time. Usually, the last column of the K-line data is the column of the current cycle, which changes in real time and is incomplete. The calculated indicator also corresponds to one of the K-line columns, as shown in the example above. Note that the last K-line column changes in real time, and the calculated indicator also changes with the change of the K-line column.
On the inventor quantification trading platform, the TA library (a library implemented by the FMZ platform, integrated in the host, available directly in various languages) or the talib library (talib index library, JS, C++ integration, Python requires self-installation) can be used. For example, in the example above, the computational mean is calculated: Use the TA library:
function main() {
    var records = exchange.GetRecords()
    var ma = TA.MA(records, 10)
    Log(ma)       // 打印均线
}
Using the library:
function main() {
    var records = exchange.GetRecords()
    var ma = talib.MA(records, 10)
    Log(ma)       // 打印均线
}
The calculated indicator data ma is an array, with each element corresponding to one K-line array (records), i.e.
ma[ma.length -1]Correspondingrecords[records.length - 1]I'm not sure what you mean.Other more complex indicators are also symmetrical, such as MACD.
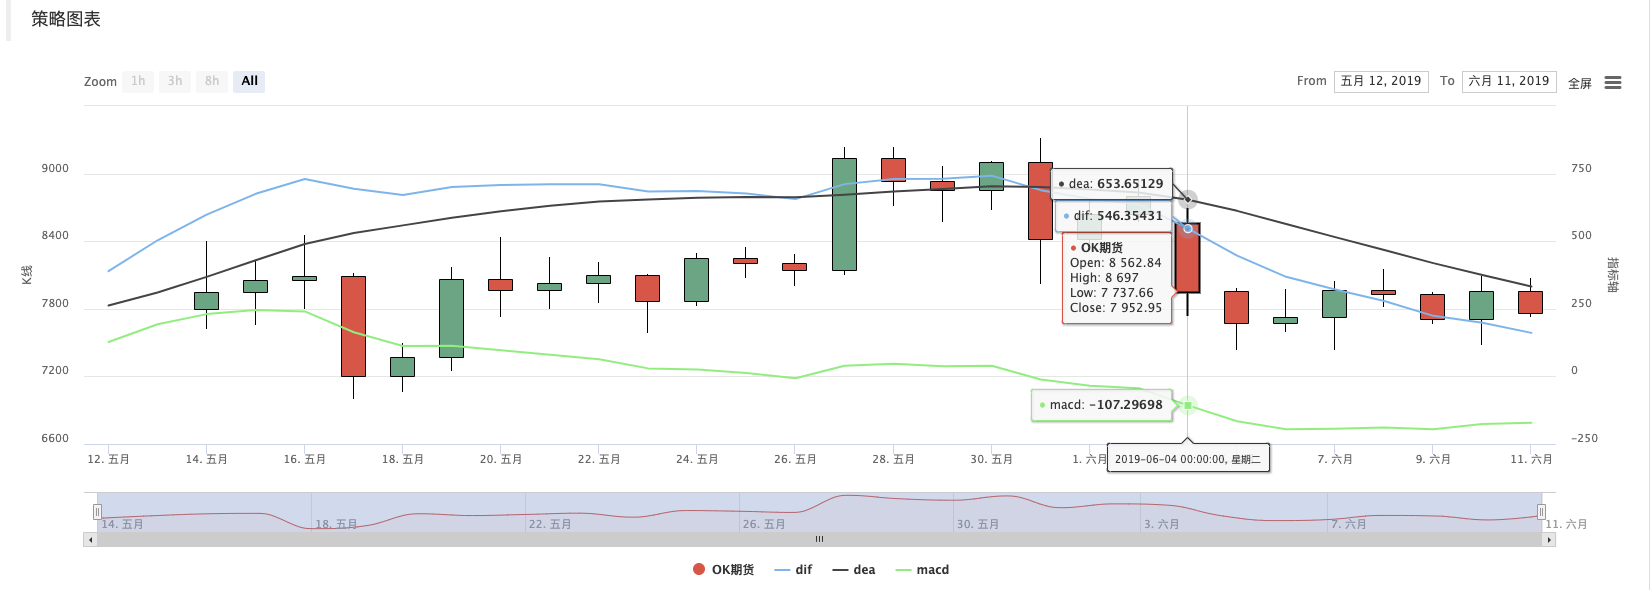
var macd = TA.MACD(records) // 这样只传入K线数据,不传入指标参数,指标参数采用的就是默认值,其它指标函数也是同理At this point, macd is a two-dimensional array (I don't understand the concept), and a two-dimensional array is simply an array in which every element is also an array. Q: Why is MACD indicator data a two-dimensional array? A: Since the macd indicator consists of two lines (diff line, dia line) and a set of quantity columns (the macd quantity column, which can also be viewed as a line), the macd variable can be broken down into:
var dif = macd[0]
var dea = macd[1]
var macdColumn = macd[2]
Here's another example of a ready-made teaching tool, and an interesting study:https://www.fmz.com/strategy/151972
-
-
- Quantifying Fundamental Analysis in the Cryptocurrency Market: Let Data Speak for Itself!
- Quantified research on the basics of coin circles - stop believing in all kinds of crazy professors, data is objective!
- The inventor of the Quantitative Data Exploration Module, an essential tool in the field of quantitative trading.
- Mastering Everything - Introduction to FMZ New Version of Trading Terminal (with TRB Arbitrage Source Code)
- Get all the details about the new FMZ trading terminal (with the TRB suite source code)
- FMZ Quant: An Analysis of Common Requirements Design Examples in the Cryptocurrency Market (II)
- How to Exploit Brainless Selling Bots with a High-Frequency Strategy in 80 Lines of Code
- FMZ quantification: common demands on the cryptocurrency market design example analysis (II)
- How to exploit brainless robots for sale with high-frequency strategies of 80 lines of code
- FMZ Quant: An Analysis of Common Requirements Design Examples in the Cryptocurrency Market (I)
- FMZ quantification: common demands of the cryptocurrency market design instance analysis (1)