Quantifying the coin circle is a whole new thing - it brings you closer to quantifying the coin circle.
Author: The Little Dream, Created: 2021-05-24 09:55:03, Updated: 2023-09-21 21:04:52
Coin circle quantization transaction new look and feel that brings you closer to the coin circle quantization
In the previous articles, we learned so many basic concepts of coin circles, programming, and quantitative trading. Finally, we can get to the real topic of the strategy itself, and in this article we learn to implement a simple strategy. I'm sure you've all heard about the trick of the net, and I'm sure you've heard about it or not, but it doesn't matter.The ExchangeThe most common, easy-to-use strategy is to use the most commonly used algorithms to program and quantify transactions.The grid strategyBut the functionality, details, etc. of the grid strategy offered by the different exchanges are different, since we intend to go into the coin circle and quantify it.
I'm sure some of my classmates will say: You don't write code! I see the code head is big!
This is true indeed. It is quite difficult for a non-computer software-related professional, who has not done programming work, to develop a complete trading strategy on his own. Because you have to do a series of preliminary work starting from the interface of the pairing exchange.
At this point, if you have a handy tool, it's pretty simple, at least 70% less difficulty. You can imagine how easy and fast it would be if you just wrote the trading logic itself, all the other functions of the exchange interface pairing, signature verification, profile files, operating environment build, UI writing, interactive writing, etc. are all in place.
Can you believe it? Let's try it!
Implementing a simple real-time grid strategy
The tool we use is: Inventors Quantitative Trading Platform.FMZ.COMThe core of the grid strategy is the logic of buying and selling, so this is something that must be understood before designing the strategy. Our goal is to make the strategy design simple and easy to understand, so the fewer parameters, the simpler the logic.
The following is the basic process for designing a strategy:
-
Strategic needs summarized
Simply put, your strategy is what to do, how to do it, what functions to have, etc. This information can be written in a document before you actually write the policy code (note what). Developing a policy on FMZ is very simple, the platform gives you a way to solve these needs, and I do not have to write these needs in a notebook (that is not very convenient to manage).
Once we've written the saving policy, we can write the policy requirements (the policy requirements are not constant and can also be recorded alongside the development).
- The strategy is designed as a spot trading strategy, with the trading pair as a trading pair.
XXX_USDTFor example:BTC_USDT。 - The grid is designed to be an equal-difference interval, which is simply the distance between two adjacent points in the grid that is a fixed price difference.
- Grids are designed to be infinitely expandable.
- How to order using the market price list.
- The strategy is designed as a spot trading strategy, with the trading pair as a trading pair.
-
2 Construction of the grid data structure:
We can start by drawing diagrams and analyzing the ideas that are unclear.
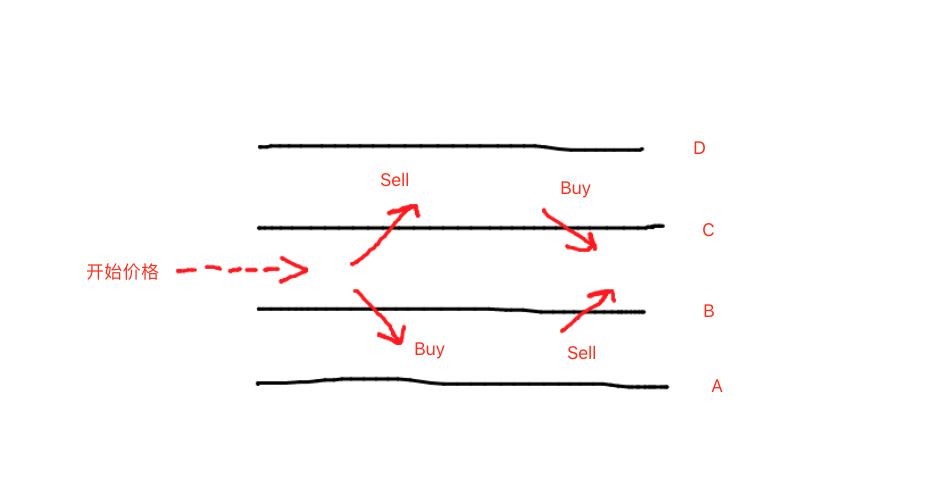
A grid can be constructed in the following two directions from the initial starting price as a base point. The grid is a layer-by-layer buying and selling line. Through the graph, we can see that each line has two possibilities: The price is right. 2, the price is lower. If the price goes up, you need to sell and then wait for the price to come down to buy for a profit. If the price drops, it means that the price is low, you need to buy, then wait for the price to rise and sell at a profit. So each grid line has two ways to trade: buy, sell. And each grid line also has an inherent property, which is the price that the line is marked. For example, the representation of A/B/C/D in the diagram. When designing strategies, the first thing we do is figure out what we want.What?I'm not sure how to do this.
Write a function that constructs a grid data structure:
function createNet(begin, diff) {   // begin,diff是参数,begin是初始价格,diff是网格间距(等差网格的间距是价格)
    var oneSideNums = 10            // 网格向上、向下一边生成10条线,上图是一边生成2条(AB一边,CD一边),生成10条的自行脑补画面
    var up = []                     // 用来储存向上的“网格线”数据结构
    var down = []                   // 用来储存向下的“网格线”数据结构
    for (var i = 0 ; i < oneSideNums ; i++) {    // 根据oneSideNums的大小确定次数,循环构造“网格线”数据结构
        var upObj = {                            // 构造一条向上的“网格线”数据结构
            buy : false,                         // 买入标记,初始标记为false ,意思为没有买入
            sell : false,                        // 卖出标记....
            price : begin + diff / 2 + i * diff, // 这条“网格线”表示的价格位,可以观察根据循环进行,价格位是依次升高的
        }
        up.push(upObj)                           // 构造好的“网格线”数据结构放入up数组

        var j = (oneSideNums - 1) - i            // 循环时 j 的变动是:9 ~ 0
        var downObj = {
            buy : false,
            sell : false,
            price : begin - diff / 2 - j * diff,
        }
        if (downObj.price <= 0) {                // 价格不能小于等于0
            continue
        }
        down.push(downObj)                       // 构造好的“网格线”数据结构放入down
    }

    return down.concat(up)                       // 把up加在down之后,形成一个网格线价格从小到大的网格数组结构
}
This function can be run separately to see the effect. The FMZ's hash debugger or hash retrieval system hash are very convenient to debug such small code.
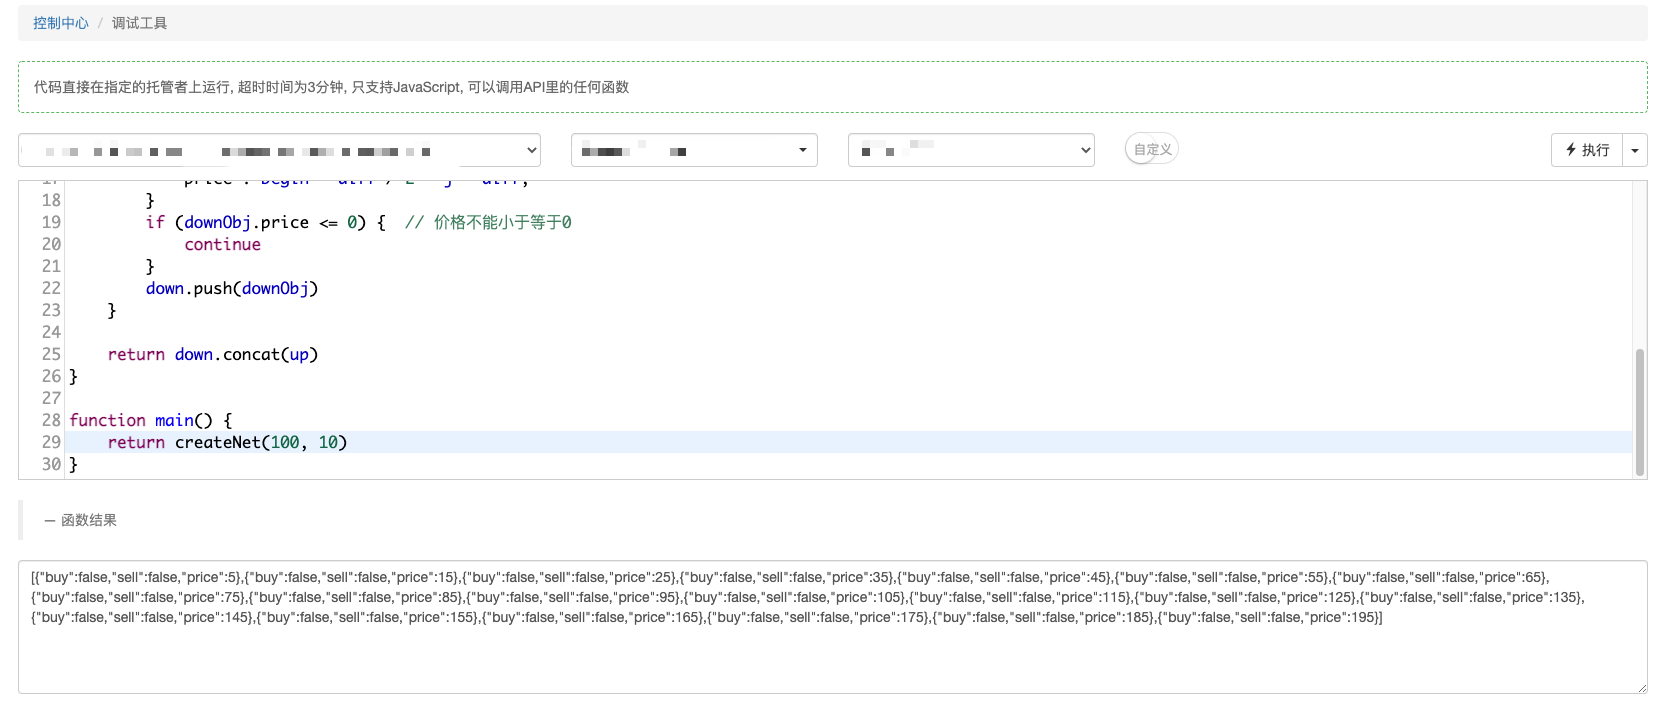
The data can be observed and constructed.
[ {"buy":false,"sell":false,"price":5}, {"buy":false,"sell":false,"price":15}, {"buy":false,"sell":false,"price":25}, {"buy":false,"sell":false,"price":35}, {"buy":false,"sell":false,"price":45}, {"buy":false,"sell":false,"price":55}, {"buy":false,"sell":false,"price":65}, {"buy":false,"sell":false,"price":75}, {"buy":false,"sell":false,"price":85}, {"buy":false,"sell":false,"price":95}, {"buy":false,"sell":false,"price":105}, // 100是起始价格,从105开始向上第一条线,间距10 {"buy":false,"sell":false,"price":115}, // ... {"buy":false,"sell":false,"price":125}, {"buy":false,"sell":false,"price":135}, {"buy":false,"sell":false,"price":145}, {"buy":false,"sell":false,"price":155}, {"buy":false,"sell":false,"price":165}, {"buy":false,"sell":false,"price":175}, {"buy":false,"sell":false,"price":185}, {"buy":false,"sell":false,"price":195} ] -
3rd, analysis of the transaction logic
After analyzing the data structure of the grid, we have to consider the specific buying and selling logic of the grid strategy. In fact, the buying and selling logic is also very simple, as we have drawn above, buying is going down a line and selling is going up a line. How does that represent wearing?
I'm not sure if I'm going to be able to do it.
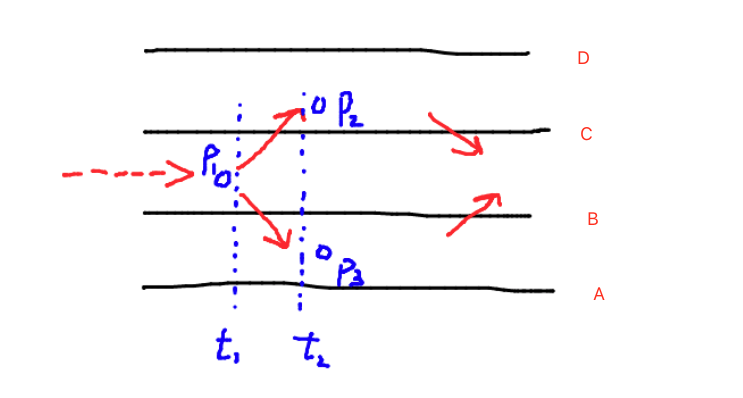
So if we were to say that t1 is a moment, and t2 is a moment after t1, and we're going to go through this line C, we're just going to have to say that t1 is a moment and t2 is a moment after t1.
P1 < CandP2 > CI'm not sure. So we're going to have to do the same thing, and we're going to have to do the same thing.P1 > BandP3 < BI'm not sure. And then we're just going to go through (and we're just going to go through)One by one.Each line in the grid array can be judged by crossing it.If you have caught the movements of the price up and down, can you place an order when these movements are triggered? Obviously, this is not possible, if the price repeatedly crosses over a line, is it not a transaction burning fee repeatedly at a price level. So there are a number of criteria for triggering the pull, after the pull, which is to use the buy/sell mark in the grid data structure that we just constructed ((for example: {
buy : false, sell : false, price :5})).
Thank you for reading, we will continue to discuss and learn in the next installment.
- Quantifying Fundamental Analysis in the Cryptocurrency Market: Let Data Speak for Itself!
- Quantified research on the basics of coin circles - stop believing in all kinds of crazy professors, data is objective!
- The inventor of the Quantitative Data Exploration Module, an essential tool in the field of quantitative trading.
- Mastering Everything - Introduction to FMZ New Version of Trading Terminal (with TRB Arbitrage Source Code)
- Get all the details about the new FMZ trading terminal (with the TRB suite source code)
- FMZ Quant: An Analysis of Common Requirements Design Examples in the Cryptocurrency Market (II)
- How to Exploit Brainless Selling Bots with a High-Frequency Strategy in 80 Lines of Code
- FMZ quantification: common demands on the cryptocurrency market design example analysis (II)
- How to exploit brainless robots for sale with high-frequency strategies of 80 lines of code
- FMZ Quant: An Analysis of Common Requirements Design Examples in the Cryptocurrency Market (I)
- FMZ quantification: common demands of the cryptocurrency market design instance analysis (1)
- Quantified transaction in the coin circle is a new look -- brings you closer to quantified coin circles.
- How to specify different versions of the data to be rented by using the policy for the metadata of the taxi code
tony233I don't understand my code.
tony233Why are you so cool?
CYZWXIt's better to have the debugger plus the py.
tony233It's too hard to get online transactions up and running.
The Little DreamIt's not hard to read the articles in tutorials, communities and libraries.