Designing a multigraph line library
Author: The Little Dream, Created: 2022-03-31 11:28:35, Updated: 2023-09-20 10:04:46
Operations such as creating chart diagrams are often used when writing, designing strategies, and for single custom charts we can use"Drawing class library"(If you're not familiar with the concept of a template library on FMZ, you can check out the FMZ API documentation), it's very easy to work with graphs. However, this template library is not suitable for scenarios that require multiple graphs. So we learned the design ideas of this drawing line library and designed a drawing line library class with a multi-graph version on this basis.
Designing the export function for the template library
Drawing on the export function design of the "graph line library", we also designed a similar export function for multi-graph line libraries.
-
$0. PlotMultRecords is a music video game developer. Used to draw K-line graphs, parameter design: cfgName, seriesName, records, extension. cfgName: The name of the object configured as a separate chart. seriesName: the name of the K-line data series for which the graph is being drawn. records: K-line data transmitted. extension: Configuration information for chart size, such as input:
{layout: 'single', col: 6, height: '600px'}This is to display a chart separately with a configuration object named cfgName, width 6, height 600px. -
$$. PlotMultLine is the For drawing lines, parameters design:cfgName, seriesName, dot, ts, extension cfgName: The name of the object configured as a separate chart. seriesName: The name of the data series for which the current line is being drawn. dot: the longitudinal coordinate value of the point on the line to be drawn. ts: timestamp, i.e. value on the x-axis. extension: Configuration information for the chart size.
-
$$. PlotMultHLine is a free online game. Design parameters for drawing horizontal lines: cfgName, value, label, color, style cfgName: Name of the chart configuration object. value: the vertical coordinate value of the horizontal line. label: display text on a horizontal line. Color: The color of the line. style: A style of a line, for example:
Solid ShortDash ShortDot ShortDashDot ShortDashDotDot Dot Dash LongDash DashDot LongDashDot LongDashDotDot。 -
$$. PlotMultTitle is the most popular Used to modify chart headings, subheadings. Parameter design:cfgName, title, chartTitle cfgName: Name of the chart configuration object. title: Subtitle. chart Title: chart title.
-
$$. PlotMultFlag is the flag Drawing flags small icons, parameter design:cfgName, seriesName, ts, text, title, shape, color, onSeriesName cfgName: Name of the chart configuration object. seriesName: The name of the data series. ts: time stamp text: text in small icons. title: Title of the small icon. shape: small icon shape. Color: The color of the small icon. onSeriesName: The value is the id of the data series based on which data series it is displayed on.
-
I'm going to try to get it. Returns the array of graph configuration objects.
Design of test functions
For the sake of simplicity, I have written a comment directly on the test function, explaining the role of each function call.
// test
function main() {
    LogReset(10)
    var i = 0
    var prePrintTs = 0

    while (true) {
        var r = exchange.GetRecords()   // 获取K线数据
        var t = exchange.GetTicker()    // 获取实时的tick数据

        $.PlotMultRecords("chart1", "kline1", r, {layout: 'single', col: 6, height: '600px'})   // 创建一个名为chart1的K线图表,独立显示,宽度是6,高度是600px,K线数据系列名称为kline1,使用上面获取的r作为数据源画图
        $.PlotMultRecords("chart2", "kline2", r, {layout: 'single', col: 6, height: '600px'})   // 创建第二个K线图表,名为chart2
        $.PlotMultLine("chart2", "line1", t.Last, r[r.length - 1].Time)  // 在K线图表即chart2上增加一条线,数据系列名称为line1,使用当前的tick数据的最新价Last作为线上的点的Y值。K线数据的最后一个BAR的时间戳作为X值
        $.PlotMultLine("chart3", "line2", t.Last)   // 创建一个只画线的图表,图表名称chart3,数据系列名称line2,使用实时tick数据的Last最新价格在当前时间(X值)画一个点(t.Last为Y值),注意图表不是独立显示
        $.PlotMultLine("chart6", "line6", t.Time)   // 创建一个只画线的图表chart6,注意图表不是独立显示,会和chart3在一起分页显示
        $.PlotMultLine("chart4", "line3", t.Sell, new Date().getTime(), {layout: 'single', col: 4, height: '300px'})  // 创建一个只画线的图表chart4,独立显示,宽度4,高度300px
        $.PlotMultLine("chart5", "line4", t.Volume, new Date().getTime(), {layout: 'single', col: 8, height: '300px'})  // 创建一个只画线的图表chart5,独立显示,宽度8,高度300px

        $.PlotMultHLine("chart1", r[r.length - 1].Close, "HLine1", "blue", "ShortDot")   // 给图表chart1增加水平横线
        $.PlotMultHLine("chart4", t.Sell, "HLine2", "green")  // 给图表chart4增加水平横线
        $.PlotMultTitle("chart3", "change : chart3->test1", "test1")   // 修改chart3的标题

        var ts = new Date().getTime()
        if (ts - prePrintTs > 1000 * 20) {
            prePrintTs = ts
            // 触发时,给chart3图表上画小图标
            $.PlotMultFlag("chart3", "flag1", new Date().getTime(), "flag test", "flag1")
        }

        if (i == 10) {
            Log("i == 10")
            // 触发时,给chart4,chart1上画小图标
            $.PlotMultFlag("chart4", "flag2", new Date().getTime(), "flag test", "flag2")
            $.PlotMultFlag("chart1", "flag3", new Date().getTime(), "flag test", "flag3", "squarepin", "green", "kline1")
        } else if (i == 20) {
            Log("i == 20")
            // 触发时,给chart1上添加一条线,但是只画了这条线的一个点,X坐标时间戳,Y坐标为t.Last值
            $.PlotMultLine("chart1", "line5", t.Last, r[r.length - 1].Time)
        } else if (i == 30) {
            Log("i == 30")
            // 触发时,给chart2上画小图标
            $.PlotMultFlag("chart2", "flag4", new Date().getTime(), "flag test", "flag4", "circlepin", "black", "kline2")
        }

        Sleep(1000 * 5)
        i++
    }
}
Running tests
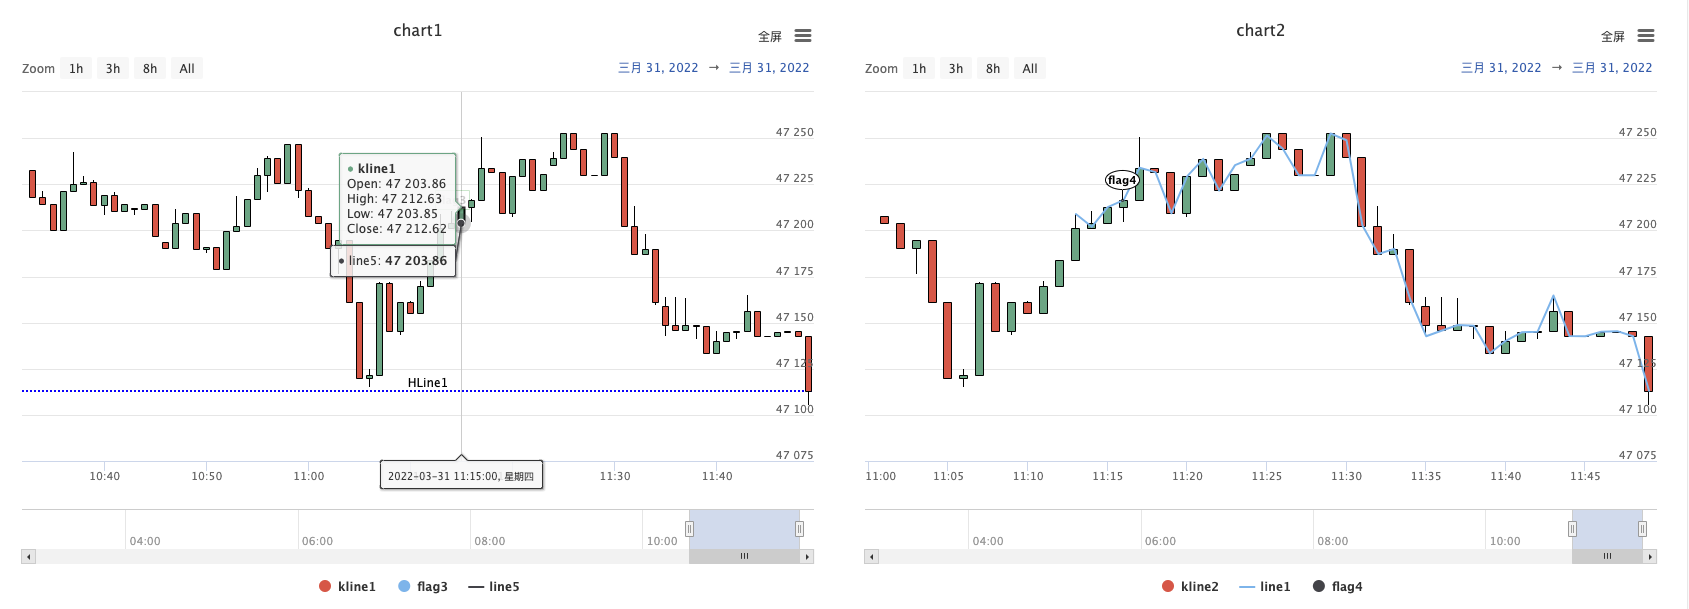
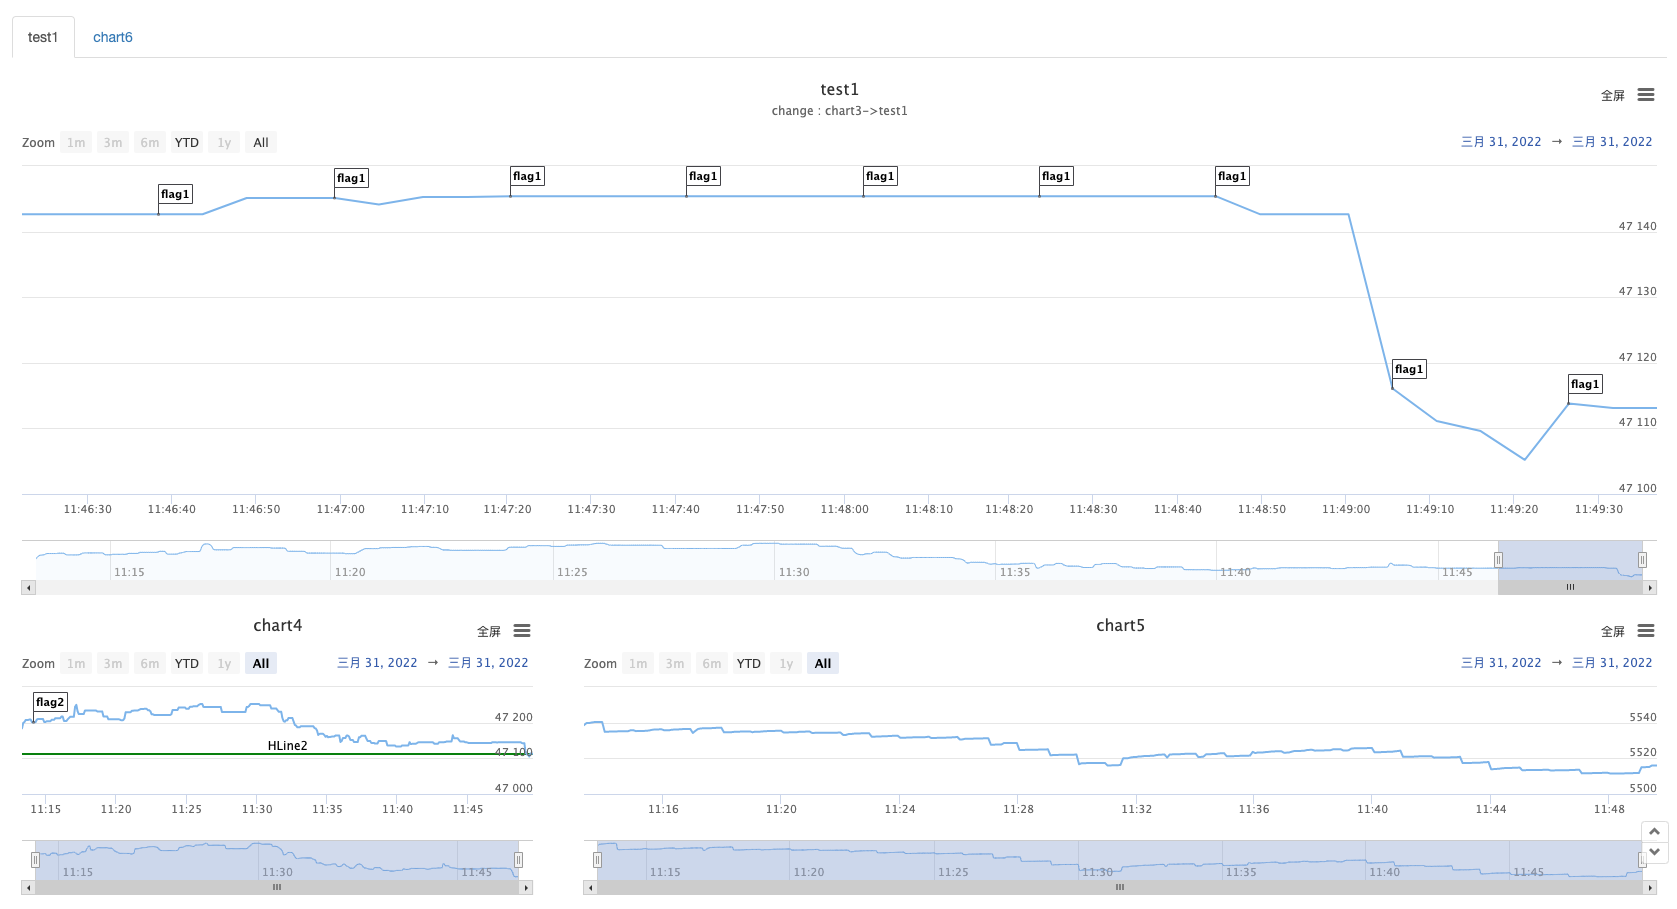
You can see that with just one line of function calls, you can easily draw a graph, and you can display multiple graphs at the same time.
The full source code of the strategy
The parameters are configured: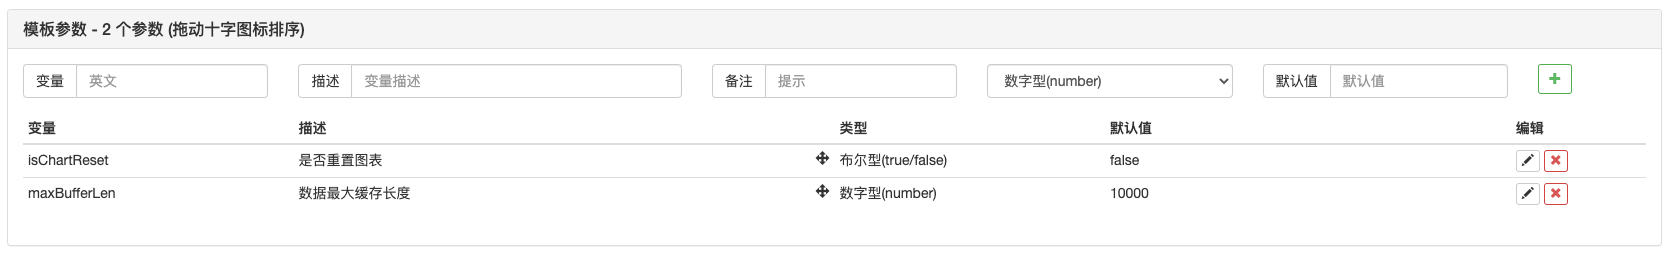
The source code of the library is implemented:
var registerInfo = {}
var chart = null
var arrCfg = []

function updateSeriesIdx() {
    var index = 0
    var map = {}
    _.each(arrCfg, function(cfg) {
        _.each(cfg.series, function(series) {
            var key = cfg.name + "|" + series.name
            map[key] = index
            index++
        })
    })

    for (var cfgName in registerInfo) {
        _.each(arrCfg, function(cfg, cfgIdx) {
            if (cfg.name == cfgName) {
                registerInfo[cfgName].cfgIdx = cfgIdx
            }
        })

        for (var i in registerInfo[cfgName].seriesIdxs) {
            var seriesName = registerInfo[cfgName].seriesIdxs[i].seriesName
            var key = cfgName + "|" + seriesName
            if (typeof(map[key]) != "undefined") {
                registerInfo[cfgName].seriesIdxs[i].index = map[key]
            }

            if (registerInfo[cfgName].seriesIdxs[i].type == "candlestick") {
                registerInfo[cfgName].seriesIdxs[i].preBarTime = 0
            } else if (registerInfo[cfgName].seriesIdxs[i].type == "line") {
                registerInfo[cfgName].seriesIdxs[i].preDotTime = 0
            } else if (registerInfo[cfgName].seriesIdxs[i].type == "flag") {
                registerInfo[cfgName].seriesIdxs[i].preFlagTime = 0
            }
        }
    }

    if (!chart) {
        chart = Chart(arrCfg)
    }
    chart.update(arrCfg)
    chart.reset()

    _G("registerInfo", registerInfo)
    _G("arrCfg", arrCfg)

    for (var cfgName in registerInfo) {
        for (var i in registerInfo[cfgName].seriesIdxs) {
            var buffer = registerInfo[cfgName].seriesIdxs[i].buffer
            var index = registerInfo[cfgName].seriesIdxs[i].index
            if (buffer && buffer.length != 0 && registerInfo[cfgName].seriesIdxs[i].type == "line" && registerInfo[cfgName].seriesIdxs[i].preDotTime == 0) {
                _.each(buffer, function(obj) {
                    chart.add(index, [obj.ts, obj.dot])
                    registerInfo[cfgName].seriesIdxs[i].preDotTime = obj.ts
                })
            } else if (buffer && buffer.length != 0 && registerInfo[cfgName].seriesIdxs[i].type == "flag" && registerInfo[cfgName].seriesIdxs[i].preFlagTime == 0) {
                _.each(buffer, function(obj) {
                    chart.add(index, obj.data)
                    registerInfo[cfgName].seriesIdxs[i].preFlagTime = obj.ts
                })
            }
        }
    }
}

function checkBufferLen(buffer, maxLen) {
    while (buffer.length > maxLen) {
        buffer.shift()
    }
}

$.PlotMultRecords = function(cfgName, seriesName, records, extension) {
    if (typeof(cfgName) == "undefined") {
        throw "need cfgName!"
    }

    var index = -1
    var eleIndex = -1

    do {
        var cfgInfo = registerInfo[cfgName]
        if (typeof(cfgInfo) == "undefined") {
            var cfg = {
                name: cfgName,
                __isStock: true,
                title: {
                    text: cfgName
                },
                tooltip: {
                    xDateFormat: '%Y-%m-%d %H:%M:%S, %A'
                },
                legend: {
                    enabled: true,
                },
                plotOptions: {
                    candlestick: {
                        color: '#d75442',
                        upColor: '#6ba583'
                    }
                },
                rangeSelector: {
                    buttons: [{
                        type: 'hour',
                        count: 1,
                        text: '1h'
                    }, {
                        type: 'hour',
                        count: 3,
                        text: '3h'
                    }, {
                        type: 'hour',
                        count: 8,
                        text: '8h'
                    }, {
                        type: 'all',
                        text: 'All'
                    }],
                    selected: 2,
                    inputEnabled: true
                },
                series: [{
                    type: 'candlestick',
                    name: seriesName,
                    id: seriesName,
                    data: []
                }],
            }

            if (typeof(extension) != "undefined") {
                cfg.extension = extension
            }

            registerInfo[cfgName] = {
                "cfgIdx": arrCfg.length,
                "seriesIdxs": [{
                    seriesName: seriesName,
                    index: arrCfg.length,
                    type: "candlestick",
                    preBarTime: 0
                }],
            }
            arrCfg.push(cfg)
            updateSeriesIdx()
        }

        if (!chart) {
            chart = Chart(arrCfg)
        } else {
            chart.update(arrCfg)
        }

        _.each(registerInfo[cfgName].seriesIdxs, function(ele, i) {
            if (ele.seriesName == seriesName && ele.type == "candlestick") {
                index = ele.index
                eleIndex = i
            }
        })
        if (index == -1) {
            arrCfg[registerInfo[cfgName].cfgIdx].series.push({
                type: 'candlestick',
                name: seriesName,
                id: seriesName,
                data: []
            })
            registerInfo[cfgName].seriesIdxs.push({
                seriesName: seriesName,
                index: arrCfg.length,
                type: "candlestick",
                preBarTime: 0
            })
            updateSeriesIdx()
        }
    } while (index == -1)

    for (var i = 0; i < records.length; i++) {
        if (records[i].Time == registerInfo[cfgName].seriesIdxs[eleIndex].preBarTime) {
            chart.add(index, [records[i].Time, records[i].Open, records[i].High, records[i].Low, records[i].Close], -1)
        } else if (records[i].Time > registerInfo[cfgName].seriesIdxs[eleIndex].preBarTime) {
            registerInfo[cfgName].seriesIdxs[eleIndex].preBarTime = records[i].Time
            chart.add(index, [records[i].Time, records[i].Open, records[i].High, records[i].Low, records[i].Close])
        }
    }

    return chart
}

$.PlotMultLine = function(cfgName, seriesName, dot, ts, extension) {
    if (typeof(cfgName) == "undefined") {
        throw "need cfgName!"
    }

    var index = -1
    var eleIndex = -1

    do {
        var cfgInfo = registerInfo[cfgName]
        if (typeof(cfgInfo) == "undefined") {
            var cfg = {
                name: cfgName,
                __isStock: true,
                title: {
                    text: cfgName
                },
                xAxis: {
                    type: 'datetime'
                },
                series: [{
                    type: 'line',
                    name: seriesName,
                    id: seriesName,
                    data: [],
                }]
            }

            if (typeof(extension) != "undefined") {
                cfg.extension = extension
            }

            registerInfo[cfgName] = {
                "cfgIdx": arrCfg.length,
                "seriesIdxs": [{
                    seriesName: seriesName,
                    index: arrCfg.length,
                    type: "line",
                    buffer: [],
                    preDotTime: 0
                }],
            }
            arrCfg.push(cfg)
            updateSeriesIdx()
        }

        if (!chart) {
            chart = Chart(arrCfg)
        } else {
            chart.update(arrCfg)
        }

        _.each(registerInfo[cfgName].seriesIdxs, function(ele, i) {
            if (ele.seriesName == seriesName && ele.type == "line") {
                index = ele.index
                eleIndex = i
            }
        })
        if (index == -1) {
            arrCfg[registerInfo[cfgName].cfgIdx].series.push({
                type: 'line',
                name: seriesName,
                id: seriesName,
                data: [],
            })
            registerInfo[cfgName].seriesIdxs.push({
                seriesName: seriesName,
                index: arrCfg.length,
                type: "line",
                buffer: [],
                preDotTime: 0
            })
            updateSeriesIdx()
        }
    } while (index == -1)

    if (typeof(ts) == "undefined") {
        ts = new Date().getTime()
    }

    var buffer = registerInfo[cfgName].seriesIdxs[eleIndex].buffer
    if (registerInfo[cfgName].seriesIdxs[eleIndex].preDotTime != ts) {
        registerInfo[cfgName].seriesIdxs[eleIndex].preDotTime = ts
        chart.add(index, [ts, dot])
        buffer.push({
            ts: ts,
            dot: dot
        })
        checkBufferLen(buffer, maxBufferLen)
    } else {
        chart.add(index, [ts, dot], -1)
        buffer[buffer.length - 1].dot = dot
    }

    return chart
}

$.PlotMultHLine = function(cfgName, value, label, color, style) {
    if (typeof(cfgName) == "undefined" || typeof(registerInfo[cfgName]) == "undefined") {
        throw "need cfgName!"
    }

    var cfg = arrCfg[registerInfo[cfgName].cfgIdx]
    if (typeof(cfg.yAxis) == "undefined") {
        cfg.yAxis = {
            plotLines: []
        }
    } else if (typeof(cfg.yAxis.plotLines) == "undefined") {
        cfg.yAxis.plotLines = []
    }

    var obj = {
        value: value,
        color: color || 'red',
        width: 2,
        dashStyle: style || 'Solid',
        label: {
            name: label || '',
            text: (label + ":" + value) || '',
            align: 'center'
        },
    }
    var found = false
    for (var i = 0; i < cfg.yAxis.plotLines.length; i++) {
        if (cfg.yAxis.plotLines[i].label.name == label) {
            cfg.yAxis.plotLines[i] = obj
            found = true
        }
    }

    if (!found) {
        cfg.yAxis.plotLines.push(obj)
    }
    if (!chart) {
        chart = Chart(arrCfg)
    } else {
        chart.update(arrCfg)
    }

    return chart
}

$.PlotMultTitle = function(cfgName, title, chartTitle) {
    if (typeof(cfgName) == "undefined" || typeof(registerInfo[cfgName]) == "undefined") {
        throw "need cfgName!"
    }

    var cfg = arrCfg[registerInfo[cfgName].cfgIdx]

    cfg.subtitle = {
        text: title
    }

    if (typeof(chartTitle) !== 'undefined') {
        cfg.title = {
            text: chartTitle
        }
    }

    if (chart) {
        chart.update(arrCfg)
    }

    return chart
}

$.PlotMultFlag = function(cfgName, seriesName, ts, text, title, shape, color, onSeriesName) {
    if (typeof(cfgName) == "undefined" || typeof(registerInfo[cfgName]) == "undefined") {
        throw "need cfgName!"
    }

    var index = -1
    var eleIndex = -1

    do {
        if (!chart) {
            chart = Chart(arrCfg)
        } else {
            chart.update(arrCfg)
        }

        _.each(registerInfo[cfgName].seriesIdxs, function(ele, i) {
            if (ele.seriesName == seriesName && ele.type == "flag") {
                index = ele.index
                eleIndex = i
            }
        })
        if (index == -1) {
            arrCfg[registerInfo[cfgName].cfgIdx].series.push({
                type: 'flags',
                name: seriesName,
                onSeries: onSeriesName || arrCfg[registerInfo[cfgName].cfgIdx].series[0].id,
                data: []
            })
            registerInfo[cfgName].seriesIdxs.push({
                seriesName: seriesName,
                index: arrCfg.length,
                type: "flag",
                buffer: [],
                preFlagTime: 0
            })
            updateSeriesIdx()
        }
    } while (index == -1)

    if (typeof(ts) == "undefined") {
        ts = new Date().getTime()
    }

    var buffer = registerInfo[cfgName].seriesIdxs[eleIndex].buffer
    var obj = {
        x: ts,
        color: color,
        shape: shape,
        title: title,
        text: text
    }
    if (registerInfo[cfgName].seriesIdxs[eleIndex].preFlagTime != ts) {
        registerInfo[cfgName].seriesIdxs[eleIndex].preFlagTime = ts
        chart.add(index, obj)
        buffer.push({
            ts: ts,
            data: obj
        })
        checkBufferLen(buffer, maxBufferLen)
    } else {
        chart.add(index, obj, -1)
        buffer[buffer.length - 1].data = obj
    }

    return chart
}

$.GetArrCfg = function() {
    return arrCfg
}

$.removeChart = function(cfgName) {
    var index = -1
    for (var i = 0; i < arrCfg.length; i++) {
        if (arrCfg[i].name == cfgName) {
            index = i
            break
        }
    }
    if (index != -1) {
        arrCfg.splice(index, 1)
    }

    if (typeof(registerInfo[cfgName]) != "undefined") {
        delete registerInfo[cfgName]
    }
    updateSeriesIdx()
}

function init() {
    if (isChartReset) {
        Log("重置图表", "#FF0000")
        chart = Chart(arrCfg)
        chart.reset()

        Log("清空持久化数据,key:", "registerInfo、arrCfg #FF0000")
        _G("registerInfo", null)
        _G("arrCfg", null)
    } else {
        var multChartRegisterInfo = _G("registerInfo")
        var multChartArrCfg = _G("arrCfg")
        if (multChartRegisterInfo && multChartArrCfg) {
            registerInfo = multChartRegisterInfo
            arrCfg = multChartArrCfg
            Log("恢复 registerInfo、arrCfg #FF0000")
        } else {
            Log("没有数据可以恢复 #FF0000")
        }
    }
}

function onexit() {
    _G("registerInfo", registerInfo)
    _G("arrCfg", arrCfg)
    Log("保存数据,key : registerInfo, arrCfg #FF0000")
}


// test
function main() {
    LogReset(10)
    var i = 0
    var prePrintTs = 0
    var t = _C(exchange.GetTicker)

    while (true) {
        var r = _C(exchange.GetRecords)

        $.PlotMultRecords("chart1", "kline1", r, {
            layout: 'single',
            col: 6,
            height: '600px'
        })
        $.PlotMultRecords("chart2", "kline2", r, {
            layout: 'single',
            col: 6,
            height: '600px'
        })
        $.PlotMultLine("chart2", "line1", t.Last, r[r.length - 1].Time)
        $.PlotMultLine("chart3", "line2", 10 + i)
        $.PlotMultLine("chart6", "line6", 100 + i)
        $.PlotMultLine("chart4", "line3", 1000 + i, new Date().getTime(), {
            layout: 'single',
            col: 4,
            height: '300px'
        })
        $.PlotMultLine("chart5", "line4", 10000 + i, new Date().getTime(), {
            layout: 'single',
            col: 8,
            height: '300px'
        })

        $.PlotMultHLine("chart1", r[r.length - 1].Close, "HLine1", "blue", "ShortDot")
        $.PlotMultHLine("chart4", t.Sell, "HLine2", "green")
        $.PlotMultTitle("chart3", "change : chart3->test1", "test1")

        var ts = new Date().getTime()
        if (ts - prePrintTs > 1000 * 20) {
            prePrintTs = ts
            $.PlotMultFlag("chart3", "flag1", new Date().getTime(), "flag test" + i, "flag1")
        }

        if (i == 10) {
            Log("i == 3")
            $.PlotMultFlag("chart4", "flag2", new Date().getTime(), "flag test" + i, "flag2")
            $.PlotMultFlag("chart1", "flag3", new Date().getTime(), "flag test" + i, "flag3", "squarepin", "green", "kline1")
        } else if (i == 20) {
            Log("i == 8")
            $.PlotMultLine("chart1", "line5", t.Last, r[r.length - 1].Time)
        } else if (i == 30) {
            Log("i == 10")
            $.PlotMultFlag("chart2", "flag4", new Date().getTime(), "flag test" + i, "flag4", "circlepin", "black", "kline2")
            $.removeChart("chart1")
        }
        i++
        Sleep(1000 * 1)
    }
}
The policy address:https://www.fmz.com/strategy/353264
Here, the little dream is to throw the dice, and those interested can continue to add supported chart types and continue to upgrade, such as painting plate depth charts, column charts, pie charts, etc.
- Quantifying Fundamental Analysis in the Cryptocurrency Market: Let Data Speak for Itself!
- Quantified research on the basics of coin circles - stop believing in all kinds of crazy professors, data is objective!
- The inventor of the Quantitative Data Exploration Module, an essential tool in the field of quantitative trading.
- Mastering Everything - Introduction to FMZ New Version of Trading Terminal (with TRB Arbitrage Source Code)
- Get all the details about the new FMZ trading terminal (with the TRB suite source code)
- FMZ Quant: An Analysis of Common Requirements Design Examples in the Cryptocurrency Market (II)
- How to Exploit Brainless Selling Bots with a High-Frequency Strategy in 80 Lines of Code
- FMZ quantification: common demands on the cryptocurrency market design example analysis (II)
- How to exploit brainless robots for sale with high-frequency strategies of 80 lines of code
- FMZ Quant: An Analysis of Common Requirements Design Examples in the Cryptocurrency Market (I)
- FMZ quantification: common demands of the cryptocurrency market design instance analysis (1)
- Design a Multiple-Chart Plotting Library
- 60 lines of code to implement an idea -- the contract copying strategy.
Light cloudsDream big, superfan [fan], chart name if replaced with a for traversed variable, will automatically split the page to display different tables.
The Little DreamYes, if the titles are different, they will be shown separately. However, you can specify overlapping or flattening if you want to see the parameters of the template export function input.