Algorithms with indicators such as Sharp rate, maximum drawdown, yield in your analytical strategy retest
Author: The Little Dream, Created: 2022-11-26 15:13:17, Updated: 2023-09-18 20:21:39
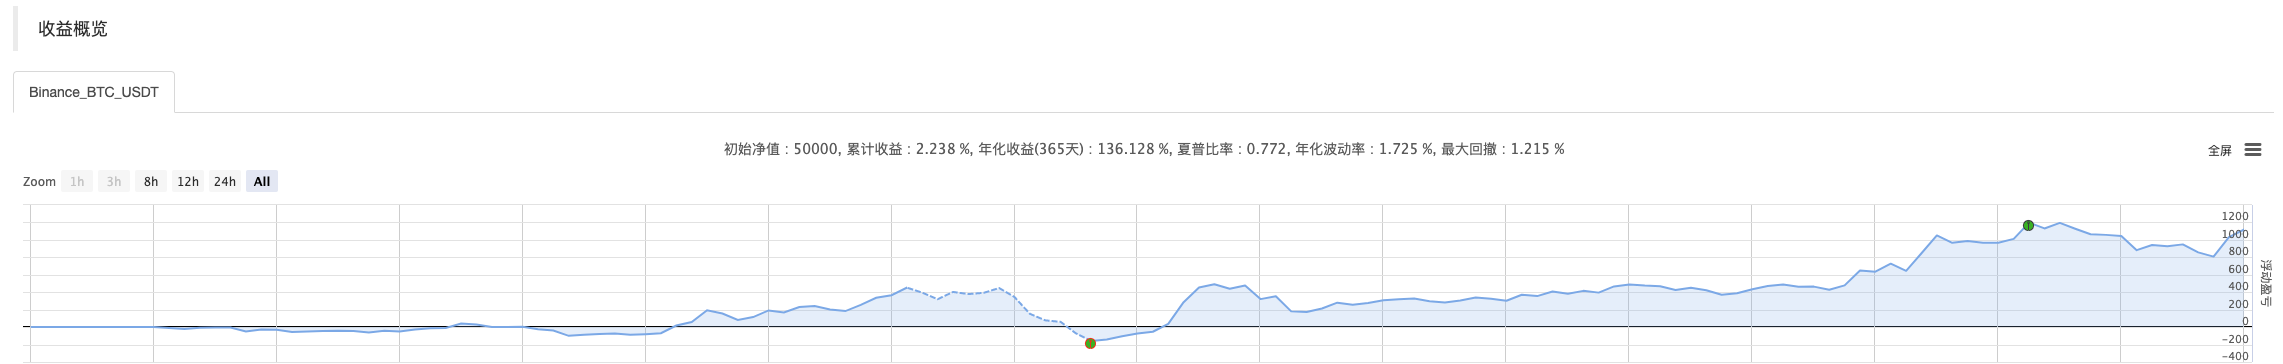
Algorithms with indicators such as Sharp rate, maximum drawdown, yield in your analytical strategy retest
There are often group members discussing some performance indicator algorithms for strategies, one of which is also published in FMZ's API documentation. However, there are some misunderstandings in the absence of commentary, this article will take you to analyze this algorithm, and I believe that after reading this article, you should have a clearer understanding of concepts such as Sharpe rate, maximum drawdown, yield rate, calculation and logic.
We upload the source code directly, the code is written in JavaScript. FMZ's retesting system also uses this algorithm to automatically generate retest performance data.
The returnAnalyze function
function returnAnalyze(totalAssets, profits, ts, te, period, yearDays)
Since it's a computational function, there must be input, output. Let's first look at the input of the function:
totalAssets, profits, ts, te, period, yearDays
-
total assets This parameter is the total of the initial assets at the start of the strategy.
-
profits This parameter is a relatively important parameter because a series of performance metrics calculations are carried out around this raw data. This parameter is a two-dimensional array with the format e.g.:
[[timestamp1, profit1], [timestamp2, profit2], [timestamp3, profit3], ....., [timestampN, profitN]], you can see that this returnAnalyze function is a data structure that requires a time sequence that records the earnings at each moment. Timestamp1 to timestampN is in the time sequence from far and near. There is a gain value at each time point. Thus, for example, the third time point in the earnings record is [timestamp3, profit3]. -
ts The start time of the retest was delayed.
-
te The end time of the review is late.
-
period The calculation cycle at the millisecond level.
-
yearDays A year of trading days.
Let's see what the output of this function is:
return {
        totalAssets: totalAssets,
        yearDays: yearDays,
        totalReturns: totalReturns,
        annualizedReturns: annualizedReturns,
        sharpeRatio: sharpeRatio,
        volatility: volatility,
        maxDrawdown: maxDrawdown,
        maxDrawdownTime: maxDrawdownTime,
        maxAssetsTime: maxAssetsTime,
        maxDrawdownStartTime: maxDrawdownStartTime,
        winningRate: winningRate
    }
- totalAssets: initial net worth
- yearDays: number of trading days
- totalReturns: cumulative rate of return
- annualisedReturns: annual returns in China
- SharpeRatio: Sharpe ratio
- volatility: the rate of volatility
- maxDrawdown: maximum drawdown
- maxDrawdownTime: maximum drawdown time
- maxAssetsTime: time stamp when maximum net worth
- maxDrawdownStartTime: Maximum drawdown start time
- winningRate: winning rate
Once we know the input and output, we understand what the function is for. Simply put, give the function some raw records, such as the gain statistic array. The function calculates a result to show the retest performance.
In the next section, we'll see how the code calculates:
function returnAnalyze(totalAssets, profits, ts, te, period, yearDays) {
    // force by days
    period = 86400000                  // 一天的毫秒数,即 60 * 60 * 24 * 1000
    if (profits.length == 0) {         // 如果参数profits数组长度为0,无法计算直接返回空值
        return null
    }
    var freeProfit = 0.03              // 无风险利率 ,也可以根据需求设置,例如国债年化3%
    var yearRange = yearDays * 86400000          // 一年所有累计的交易日的毫秒数
    var totalReturns = profits[profits.length - 1][1] / totalAssets      // 累计收益率
    var annualizedReturns = (totalReturns * yearRange) / (te - ts)       // 年华收益率,把收益统计的时间缩放到一年的尺度上得出的预期收益率

    // MaxDrawDown
    var maxDrawdown = 0           // 初始化最大回撤变量为0
    var maxAssets = totalAssets   // 以初始净值赋值初始化最大资产变量
    var maxAssetsTime = 0         // 初始化最大资产时刻的时间戳
    var maxDrawdownTime = 0       // 初始化最大回撤时刻的时间戳
    var maxDrawdownStartTime = 0  // 初始化最大回撤开始时刻的时间戳
    var winningRate = 0           // 初始化胜率为0
    var winningResult = 0         // 记录赢的次数
    for (var i = 0; i < profits.length; i++) {      // 遍历收益数组
        if (i == 0) {
            if (profits[i][1] > 0) {                // 如果第一个收益记录点,收益大于0,表示盈利
                winningResult++                     // 赢的次数累加1
            }
        } else {                                    // 如果不是第一个收益记录点,只要当前的点的收益,大于前一个时刻(收益点)的收益,表示盈利,赢的次数累加1
            if (profits[i][1] > profits[i - 1][1]) {
                winningResult++
            }
        }
        if ((profits[i][1] + totalAssets) > maxAssets) {    // 如果该时刻的收益加初始净值大于记录出现过的最大资产,就更新最大资产数值,记录这个时刻的时间戳
            maxAssets = profits[i][1] + totalAssets
            maxAssetsTime = profits[i][0]
        }
        if (maxAssets > 0) {                                // 当记录的最大资产数值大于0时,计算回撤
            var drawDown = 1 - (profits[i][1] + totalAssets) / maxAssets
            if (drawDown > maxDrawdown) {                   // 如果当前回撤大于记录过的最大回撤,更新最大回撤、最大回撤时间等
                maxDrawdown = drawDown
                maxDrawdownTime = profits[i][0]
                maxDrawdownStartTime = maxAssetsTime
            }
        }
    }
    if (profits.length > 0) {                            // 计算胜率
        winningRate = winningResult / profits.length
    }
    // trim profits
    var i = 0
    var datas = []
    var sum = 0
    var preProfit = 0
    var perRatio = 0
    var rangeEnd = te
    if ((te - ts) % period > 0) {
        rangeEnd = (parseInt(te / period) + 1) * period     // 把rangeEnd处理为period的整倍数
    }
    for (var n = ts; n < rangeEnd; n += period) {
        var dayProfit = 0.0
        var cut = n + period
        while (i < profits.length && profits[i][0] < cut) {    // 确保当时间戳不越界,数组长度也不越界
            dayProfit += (profits[i][1] - preProfit)           // 计算每天的收益
            preProfit = profits[i][1]                          // 记录昨日的收益
            i++                                                // 累加i用于访问下一个profits节点
        }
        perRatio = ((dayProfit / totalAssets) * yearRange) / period   // 计算当时年华的收益率
        sum += perRatio                                               // 累计
        datas.push(perRatio)                                          // 放入数组 datas
    }

    var sharpeRatio = 0                    // 初始夏普比率为0
    var volatility = 0                     // 初始波动率为0
    if (datas.length > 0) {
        var avg = sum / datas.length;      // 求均值
        var std = 0;
        for (i = 0; i < datas.length; i++) {
            std += Math.pow(datas[i] - avg, 2);      // std用于计算后面的方差,后面的std / datas.length就是方差,求算数平方根就是标准差
        }
        volatility = Math.sqrt(std / datas.length);  // 当按年时,波动率就是标准差
        if (volatility !== 0) {
            sharpeRatio = (annualizedReturns - freeProfit) / volatility   // 夏普计算公式计算夏普率:(年华收益率 - 无风险利率) / 标准差
        }
    }

    return {
        totalAssets: totalAssets,
        yearDays: yearDays,
        totalReturns: totalReturns,
        annualizedReturns: annualizedReturns,
        sharpeRatio: sharpeRatio,
        volatility: volatility,
        maxDrawdown: maxDrawdown,
        maxDrawdownTime: maxDrawdownTime,
        maxAssetsTime: maxAssetsTime,
        maxDrawdownStartTime: maxDrawdownStartTime,
        winningRate: winningRate
    }
}
Overall, the algorithm is not complicated, and there may be several concepts that need to be understood beforehand.
-
The difference: This is a collection of earnings data: 1, 2, 3, 4, 5, and so on. The mean of these samples is (((1+2+3+4+5)/5=3, and the difference is the average of the sum of the squares of the differences between the mean of each of the data and their sums.
-
Standard deviation: The square root of the arithmetic mean of the standard deviation.
-
The number of people who are affected: When the scale is calculated in years, the fluctuation is the standard deviation.
Once you understand these concepts and calculation formulas, the Sharpe calculus part of the function becomes clear at once. Sharpe's formula for calculating the Sharpe ratio: (annual Chinese yield - risk-free interest rate) / standard deviation
Have you learned?
- Quantifying Fundamental Analysis in the Cryptocurrency Market: Let Data Speak for Itself!
- Quantified research on the basics of coin circles - stop believing in all kinds of crazy professors, data is objective!
- The inventor of the Quantitative Data Exploration Module, an essential tool in the field of quantitative trading.
- Mastering Everything - Introduction to FMZ New Version of Trading Terminal (with TRB Arbitrage Source Code)
- Get all the details about the new FMZ trading terminal (with the TRB suite source code)
- FMZ Quant: An Analysis of Common Requirements Design Examples in the Cryptocurrency Market (II)
- How to Exploit Brainless Selling Bots with a High-Frequency Strategy in 80 Lines of Code
- FMZ quantification: common demands on the cryptocurrency market design example analysis (II)
- How to exploit brainless robots for sale with high-frequency strategies of 80 lines of code
- FMZ Quant: An Analysis of Common Requirements Design Examples in the Cryptocurrency Market (I)
- FMZ quantification: common demands of the cryptocurrency market design instance analysis (1)
- What You Need to Know to Familiar with MyLanguage on FMZ -- Parameters of MyLanguage Trading Class Library
- What You Need to Know to Familiar with MyLanguage on FMZ -- Interface Charts
- Take you to analyze the Sharpe ratio, maximum drawdown, return rate and other indicator algorithms in the strategy backtesting
- Modeling and Analysis of Bitcoin Volatility Based on ARMA-EGARCH Model