EMA/MACD/RSI Crossover Strategy

Overview
The EMA/MACD/RSI Crossover Strategy is a quantitative trading approach that combines multiple technical indicators. This strategy primarily utilizes crossover signals from Exponential Moving Averages (EMA), Moving Average Convergence Divergence (MACD), and Relative Strength Index (RSI) to assess market trends and generate trading signals. The strategy also incorporates the Average True Range (ATR) for setting dynamic stop-losses, effectively managing risk. This multi-indicator approach aims to enhance the accuracy and reliability of trading signals.
Strategy Principle
The core principle of this strategy is to determine entry and exit points through multiple indicator crossovers and combinations:
- EMA Crossover: The crossover of fast EMA and slow EMA is used to capture short-term trend changes.
- MACD Crossover: The crossover of MACD line and signal line confirms medium-term trend reversals.
- RSI Filter: The RSI indicator is used to filter out potential false breakouts, executing trades only when RSI is not in overbought or oversold territories.
- ATR Stop-Loss: ATR is used to set dynamic stop-losses, adjusting the stop-loss position based on market volatility.
The buy condition is triggered when the fast EMA crosses above the slow EMA or when the MACD line crosses above the signal line, while the RSI is above the oversold level. Sell conditions are the opposite. The strategy also checks the current position status to avoid duplicate entries, improving capital efficiency.
Strategy Advantages
- Multi-Indicator Integration: By combining EMA, MACD, and RSI, the strategy confirms trading signals from different perspectives, reducing the risk of false judgments.
- Balance of Trend Following and Reversal: The use of EMA and MACD allows for both trend capture and timely identification of potential reversals.
- Dynamic Risk Management: The ATR-based dynamic stop-loss enables automatic adjustment of stop points based on market volatility.
- High Flexibility: Strategy parameters can be adjusted for different markets and timeframes, offering strong adaptability.
- Avoidance of Overtrading: Checking existing positions prevents duplicate entries, helping control trading frequency and costs.
Strategy Risks
- Poor Performance in Sideways Markets: In range-bound markets, the strategy may generate frequent false signals, leading to overtrading and losses.
- Parameter Sensitivity: Strategy performance is highly dependent on the parameter settings of EMA, MACD, and RSI, potentially requiring frequent adjustments for different markets.
- Lag: As lagging indicators, EMA and MACD may not respond quickly enough in highly volatile markets.
- Signal Conflicts: Multiple indicators may sometimes give contradictory signals, increasing decision-making complexity.
- Overreliance on Technical Analysis: The strategy does not consider fundamental factors and may fail under the influence of significant news or events.
Strategy Optimization Directions
- Incorporate Volatility Filtering: Consider adjusting strategy parameters or pausing trading in high volatility environments to handle extreme market fluctuations.
- Add Trend Strength Assessment: Introduce trend strength indicators like ADX, adopting more aggressive strategies in strong trend markets and more conservative approaches in weak trend markets.
- Optimize Profit-Taking Mechanism: The current strategy only has stop-loss settings. Consider adding ATR-based or fixed percentage profit-taking mechanisms to lock in gains.
- Timeframe Synergy: Consider validating signals across multiple timeframes to enhance trading decision reliability.
- Include Volume Analysis: Integrate volume indicators such as OBV or CMF to confirm the validity of price movements.
- Machine Learning Optimization: Use machine learning algorithms to dynamically adjust indicator parameters, improving the strategy's adaptability to market changes.
Conclusion
The EMA/MACD/RSI Crossover Strategy is a comprehensive technical analysis trading system that identifies trading opportunities and manages risks through the synergy of multiple indicators. The main advantages of this strategy lie in its multidimensional market analysis perspective and flexible risk management mechanism. However, users need to be aware of the strategy's performance differences in various market environments and optimize parameters for specific trading instruments and market conditions. Through continuous improvement and optimization, such as introducing more indicators and refining profit-taking and stop-loss mechanisms, this strategy has the potential to become a robust quantitative trading tool. In practical application, it is recommended to conduct thorough backtesting and simulated trading, combined with market insights and risk management principles, to achieve optimal trading results.
/*backtest
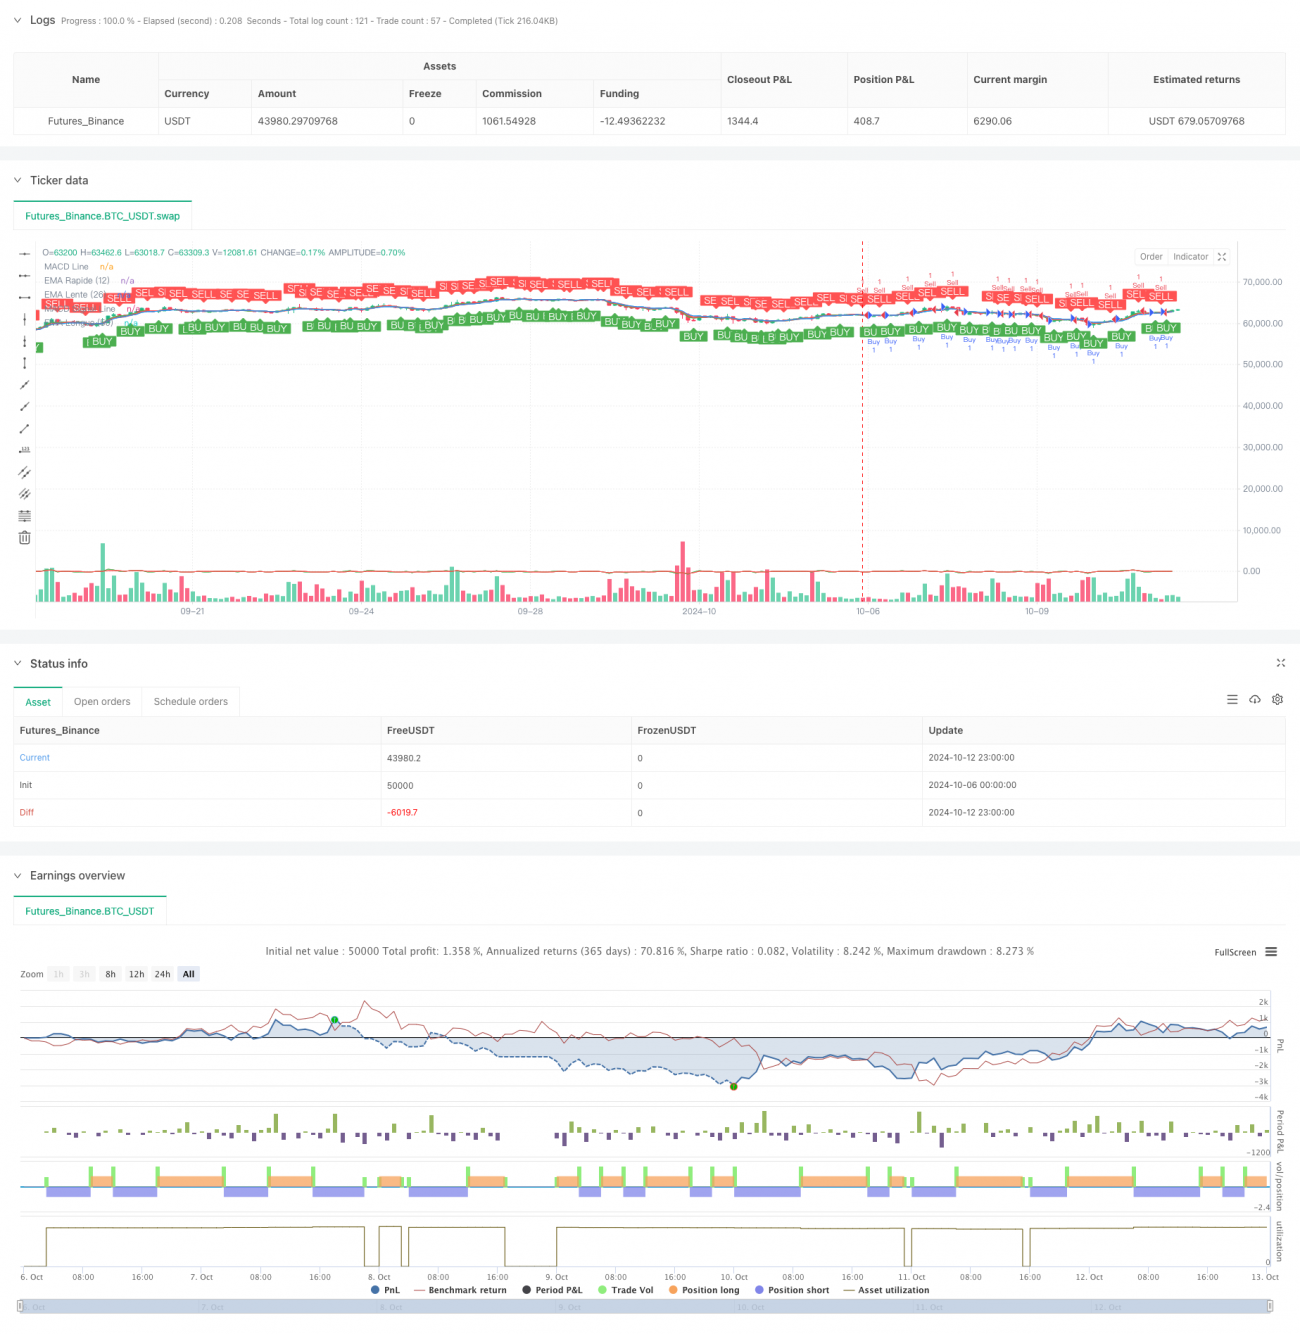
start: 2024-10-06 00:00:00
end: 2024-10-13 00:00:00
period: 3h
basePeriod: 3h
exchanges: [{"eid":"Futures_Binance","currency":"BTC_USDT"}]
*/
//@version=5
strategy("Mister Buy / sell signals", overlay=true, shorttitle="Mister Buy / sell signals")
// ─────────────────────────────────────────────────────────────- 1