
概述
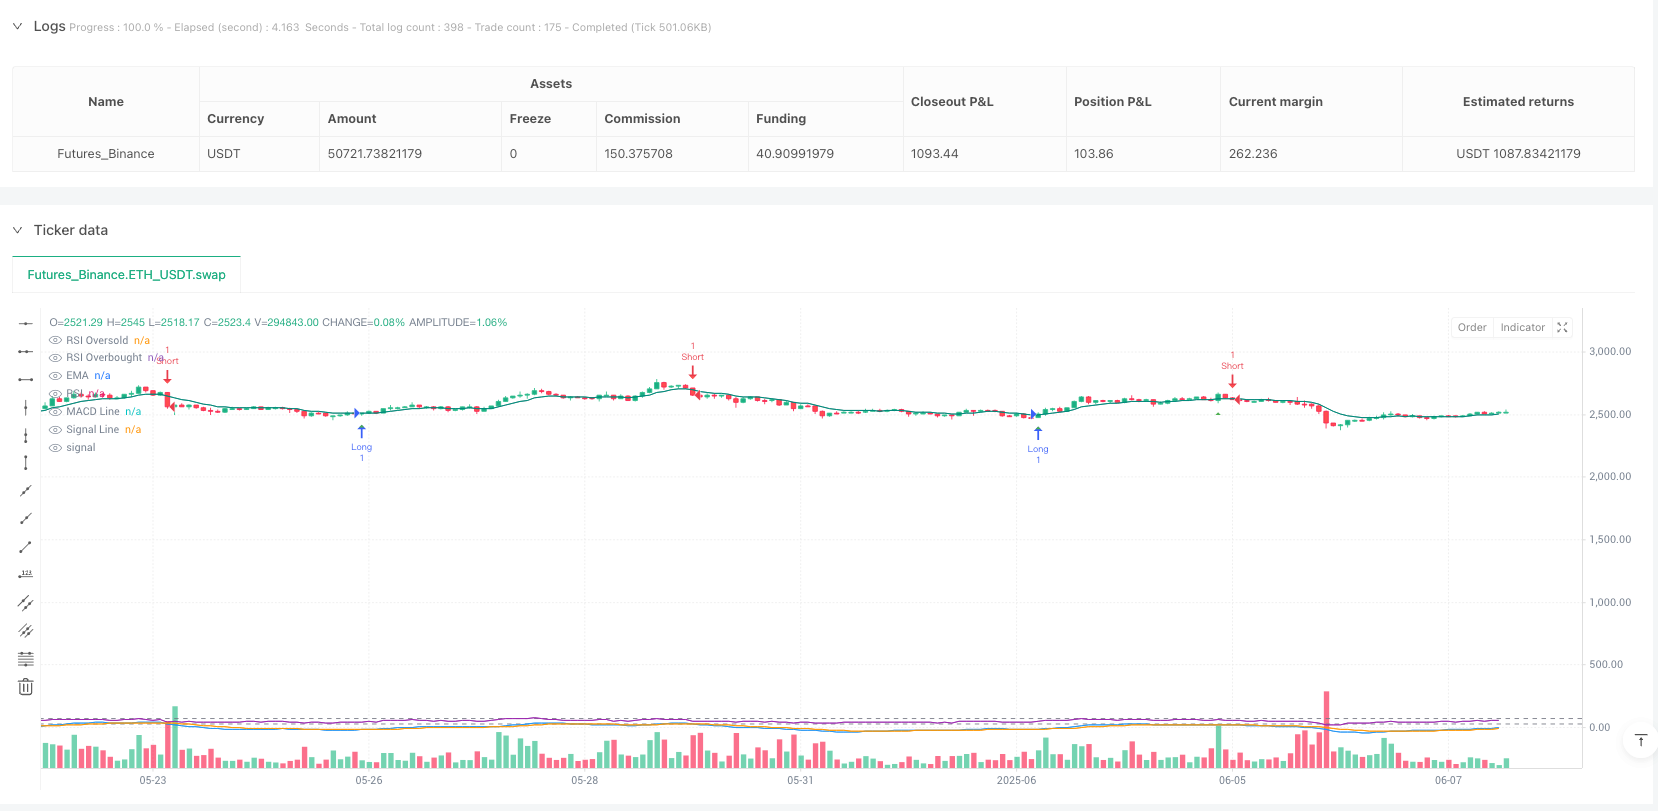
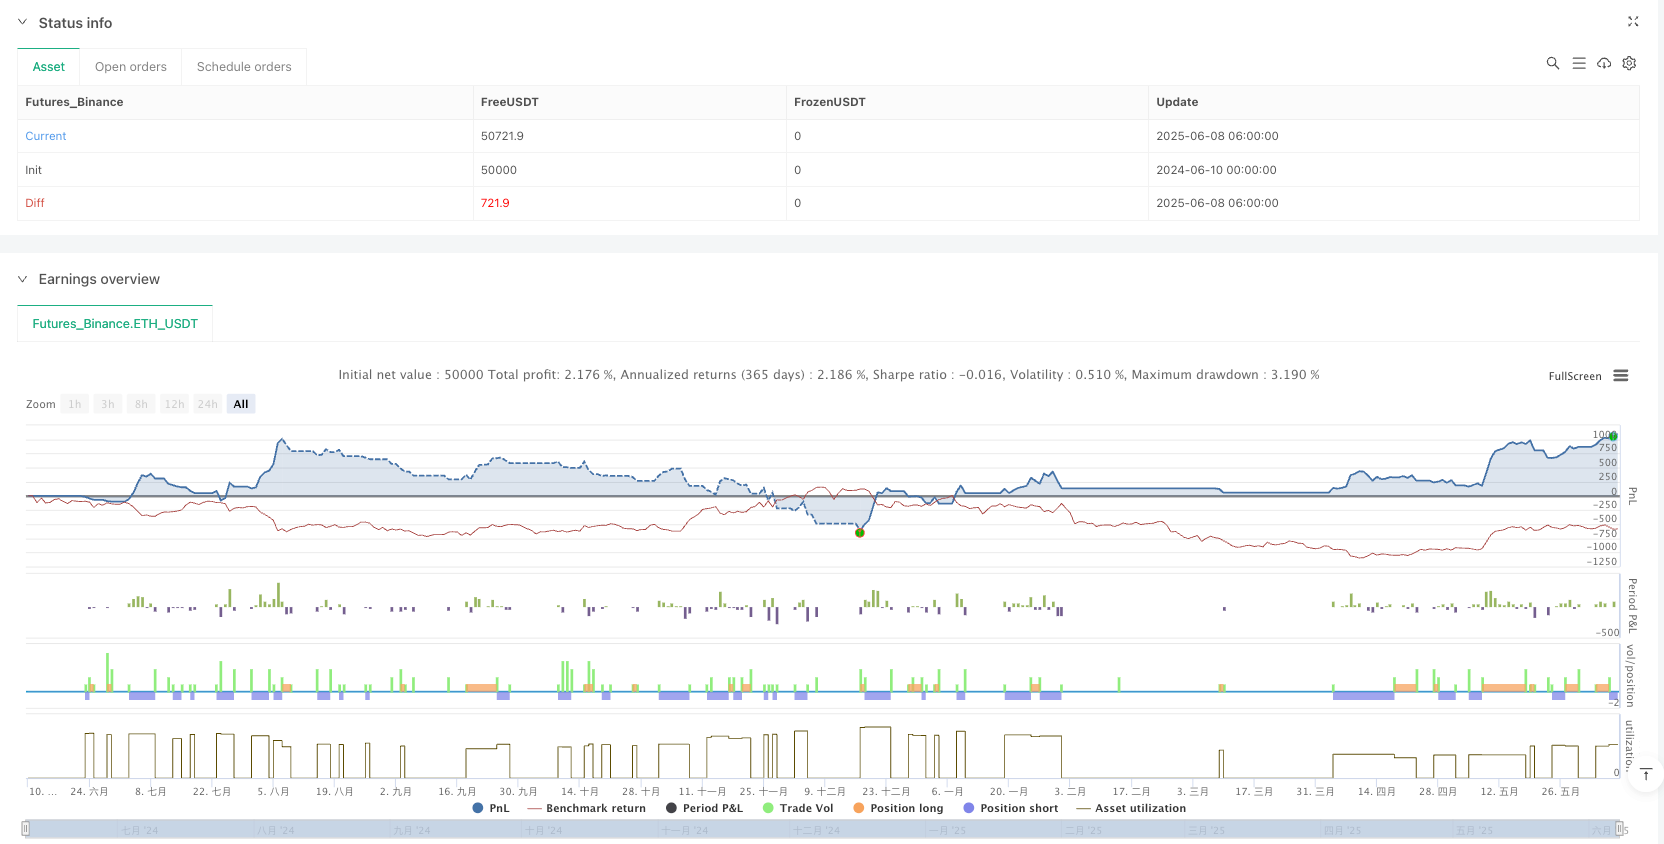
本策略是一个基于多重技术指标的高频交易系统,综合运用了相对强弱指数(RSI)、移动平均线收敛散度指标(MACD)以及指数移动平均线(EMA)三大核心指标,并配合自适应止损机制进行风险管理。该策略主要通过EMA价格交叉作为主要信号,并结合RSI超买超卖区域判断和MACD线交叉提供辅助确认,形成一套高效的交易决策系统。策略设计初衷是为了捕捉市场的短期波动,适合在波动性较大的市场环境中进行高频交易操作。
策略原理
该策略的核心原理是通过多指标交叉信号的组合确认来提高交易频率和准确性:
EMA交叉作为主要信号:策略采用9周期的EMA指标,当价格向上穿越EMA时产生买入信号基础,当价格向下穿越EMA时产生卖出信号基础。
MACD信号确认:使用12-26-9参数设置的MACD指标,当MACD线上穿信号线时视为看涨确认,当MACD线下穿信号线时视为看跌确认。
RSI边界条件判断:采用14周期RSI指标,设定30为超卖水平,70为超买水平。策略在买入条件中结合了RSI<35的判断(放宽条件),卖出条件中结合了RSI>65的判断(放宽条件)。
信号组合逻辑:
- 买入信号 = EMA买入条件 AND (MACD买入条件 OR RSI接近超卖区域)
- 卖出信号 = EMA卖出条件 AND (MACD卖出条件 OR RSI接近超买区域)
自适应止损机制:基于14周期ATR指标计算动态止损位,止损乘数设置为2.0,为每笔交易提供风险控制措施。
退出条件:当价格反向穿越EMA或价格已经位于不利方向的EMA一侧时,策略将退出当前头寸。
策略优势
高频交易设计:通过简化和优化信号组合,策略能够产生更频繁的交易信号,适合短线交易者捕捉市场波动。
多指标确认:结合三种不同类型的技术指标(趋势型、动量型、震荡型),提高了信号的可靠性,减少了假信号的干扰。
灵活的条件组合:买入和卖出信号采用了”主要条件AND(次要条件1 OR 次要条件2)“的逻辑结构,在保证信号质量的同时提高了信号频率。
自适应风险管理:使用基于ATR的动态止损,止损位会根据市场波动性自动调整,使风险控制更加灵活和有效。
对称交易策略:买入和卖出条件设计对称,使策略在多空两个方向都有均衡的表现,适合双向交易。
直观的可视化:策略提供了信号和指标的可视化展示,便于交易者分析和优化交易决策。
策略风险
过度交易风险:高频策略可能产生过多交易信号,导致交易成本增加,尤其在横盘市场中可能出现频繁的假突破。
- 解决方法:可以考虑增加交易过滤器,如最小波动幅度要求或时间过滤器。
止损位设置风险:ATR乘数固定为2.0可能在不同市场条件下不够灵活,有时止损过紧或过松。
- 解决方法:可以根据市场波动性动态调整ATR乘数,或结合支撑阻力位设置止损。
参数敏感性:多个技术指标的参数设置对策略性能有重大影响,参数不当可能导致表现不佳。
- 解决方法:进行全面的参数优化和回测,找到最适合特定市场的参数组合。
市场条件依赖性:在不同的市场阶段(趋势、区间、高波动性等),策略表现可能有较大差异。
- 解决方法:加入市场状态识别机制,在不同市场条件下调整策略参数或暂停交易。
指标滞后性:所有技术指标都存在一定滞后性,可能导致入场或出场时机不理想。
- 解决方法:考虑引入价格行为分析或更快速的指标作为补充,减少滞后影响。
策略优化方向
动态参数调整:
- 可以根据市场波动性自动调整RSI的超买超卖阈值和MACD参数,使策略更好地适应不同市场环境。
- 原理:在高波动市场中适当放宽阈值,在低波动市场中收紧阈值,以平衡信号质量和频率。
市场状态识别:
- 增加市场状态识别模块,如ADX指标判断趋势强度,在强趋势市场中更倾向于顺势交易,在区间市场中更注重反转信号。
- 原理:不同市场状态适合不同交易策略,自适应调整可以提高整体表现。
时间框架协同:
- 引入多时间框架分析,使用更高级别时间框架确定主要趋势方向,只在趋势方向上开仓。
- 原理:遵循”顺大势、逆小势”的交易原则,提高胜率。
止盈机制设计:
- 当前策略仅有止损和基于EMA的退出机制,可以加入基于ATR的动态止盈或基于波动的部分获利了结机制。
- 原理:良好的止盈机制可以锁定利润,提高策略的风险回报比。
交易量过滤:
- 增加交易量确认条件,只在交易量上升时确认信号有效,过滤低交易量的假突破。
- 原理:价格变动应该伴随着交易量的变化,这有助于验证信号的可靠性。
机器学习优化:
- 考虑引入机器学习算法动态优化策略参数或生成交易信号的权重。
- 原理:机器学习可以发现传统技术分析中难以识别的模式,提高策略适应性。
总结
高频RSI-MACD-EMA组合技术分析策略是一个综合运用多种技术指标的交易系统,通过EMA交叉作为主导信号,结合MACD和RSI提供确认,形成高频交易决策机制。该策略的主要优势在于能够频繁捕捉市场短期波动,结合多指标确认提高信号可靠性,并通过基于ATR的动态止损进行风险管理。
然而,策略也面临过度交易、参数敏感性和市场条件依赖等挑战。未来优化方向包括动态参数调整、市场状态识别、多时间框架分析、完善止盈机制、交易量过滤以及机器学习应用等方面。通过这些优化,可以进一步提高策略的稳定性、适应性和盈利能力。
总体而言,这是一个设计合理、逻辑清晰的高频交易策略框架,具有良好的实用性和扩展性。对于追求短期市场机会的交易者而言,该策略提供了一个可靠的决策依据,但使用者需要根据自身风险承受能力和交易目标进行适当的参数调整和优化。
/*backtest
start: 2024-06-10 00:00:00
end: 2025-06-08 08:00:00
period: 2h
basePeriod: 2h
exchanges: [{"eid":"Futures_Binance","currency":"ETH_USDT"}]
*/

// This Pine Script™ code is subject to the terms of the Mozilla Public License 2.0 at https://mozilla.org/MPL/2.0/
// © Manus AI

//@version=5
strategy("RSI MACD EMA Strategy with SL (Higher Frequency)", overlay=true)

// MACD Inputs
fast_length = input(12, "MACD Fast Length")
slow_length = input(26, "MACD Slow Length")
signal_length = input(9, "MACD Signal Length")

// RSI Inputs
rsi_length = input(14, "RSI Length")
rsi_oversold = input(30, "RSI Oversold Level (Relaxed)") // Relaxed from 35 to 30 for more signals
rsi_overbought = input(70, "RSI Overbought Level (Relaxed)") // Relaxed from 65 to 70 for more signals

// EMA Inputs
ema_length = input(9, "EMA Length")

// Stop Loss Inputs
atr_length = input(14, "ATR Length for Stop Loss")
sl_multiplier = input.float(2.0, "Stop Loss Multiplier")

// Calculate MACD
[macd_line, signal_line, hist_line] = ta.macd(close, fast_length, slow_length, signal_length)

// Calculate RSI
rsi_value = ta.rsi(close, rsi_length)

// Calculate EMA
ema_value = ta.ema(close, ema_length)

// Calculate ATR for Stop Loss
atr_value = ta.atr(atr_length)

// MACD Conditions (Simplified/Direct Cross)
macd_buy_condition = ta.crossover(macd_line, signal_line) // Using crossover for direct signal
macd_sell_condition = ta.crossunder(macd_line, signal_line) // Using crossunder for direct signal

// RSI Conditions (Simplified for higher frequency)
// Instead of complex divergence, let's go back to simpler overbought/oversold crosses
rsi_buy_condition = ta.crossover(rsi_value, rsi_oversold) // Buy when RSI crosses above oversold
rsi_sell_condition = ta.crossunder(rsi_value, rsi_overbought) // Sell when RSI crosses below overbought

// EMA Conditions (Direct Cross)
ema_buy_condition = ta.crossover(close, ema_value)
ema_sell_condition = ta.crossunder(close, ema_value)

// Buy/Long Entry - Significantly simplified for higher frequency
// We'll combine fewer conditions, focusing on the most immediate signals.
// Let's use either MACD + EMA, or RSI + EMA, or a combination that is less strict.
// Option 1: MACD cross AND EMA cross (stronger than just one, but still fewer than before)
// buy_signal = macd_buy_condition and ema_buy_condition

// Option 2: RSI cross AND EMA cross (another common combination)
// buy_signal = rsi_buy_condition and ema_buy_condition

// Option 3: A more aggressive combination (e.g., any two of the three main signals)
// For maximum frequency, let's primarily use EMA cross with a supporting indicator.
// We'll prioritize the EMA cross as it's often the fastest price-action related signal.
buy_signal = ema_buy_condition and (macd_buy_condition or rsi_value < rsi_oversold + 5) // EMA cross up AND (MACD cross up OR RSI is near oversold)

// Sell/Short Entry - Significantly simplified for higher frequency
// Similar logic for short signals.
sell_signal = ema_sell_condition and (macd_sell_condition or rsi_value > rsi_overbought - 5) // EMA cross down AND (MACD cross down OR RSI is near overbought)


// Exit Conditions (Kept as previously tightened, as frequent exits complement frequent entries)
long_exit_condition = ta.crossunder(close, ema_value) or (close < ema_value)
short_exit_condition = ta.crossover(close, ema_value) or (close > ema_value)


// Stop Loss Calculation (Kept as previously loosened, but could be tightened for faster exits on losses)
long_stop_loss_price = strategy.position_avg_price - (atr_value * sl_multiplier)
short_stop_loss_price = strategy.position_avg_price + (atr_value * sl_multiplier)

// Strategy orders
if buy_signal
    strategy.entry("Long", strategy.long)

if sell_signal
    strategy.entry("Short", strategy.short)

if strategy.position_size > 0 // If currently in a long position
    strategy.exit("Long Exit", from_entry="Long", stop=long_stop_loss_price, when=long_exit_condition)

if strategy.position_size < 0 // If currently in a short position
    strategy.exit("Short Exit", from_entry="Short", stop=short_stop_loss_price, when=short_exit_condition)

// Plotting signals (optional, for visualization)
plotshape(buy_signal, title="Buy Signal", location=location.belowbar, color=color.green, style=shape.triangleup, size=size.small)
plotshape(sell_signal, title="Sell Signal", location=location.abovebar, color=color.red, style=shape.triangledown, size=size.small)

// Plotting indicators (optional, for visualization)
plot(macd_line, "MACD Line", color.blue)
plot(signal_line, "Signal Line", color.orange)
plot(rsi_value, "RSI", color.purple)
plot(ema_value, "EMA", color.teal)

hline(rsi_oversold, "RSI Oversold", color.gray)
hline(rsi_overbought, "RSI Overbought", color.gray)