
Overview
This strategy is a trading system based on multiple technical indicators, primarily combining Exponential Moving Averages (EMA), Relative Strength Index (RSI), and distance calculations. The strategy dynamically monitors market trend strength and momentum changes, maintaining signal stability while effectively avoiding false breakouts and choppy markets. The system employs multiple confirmation mechanisms and calculates relative distances between indicators and dynamic thresholds to achieve precise market state assessment.
Strategy Principle
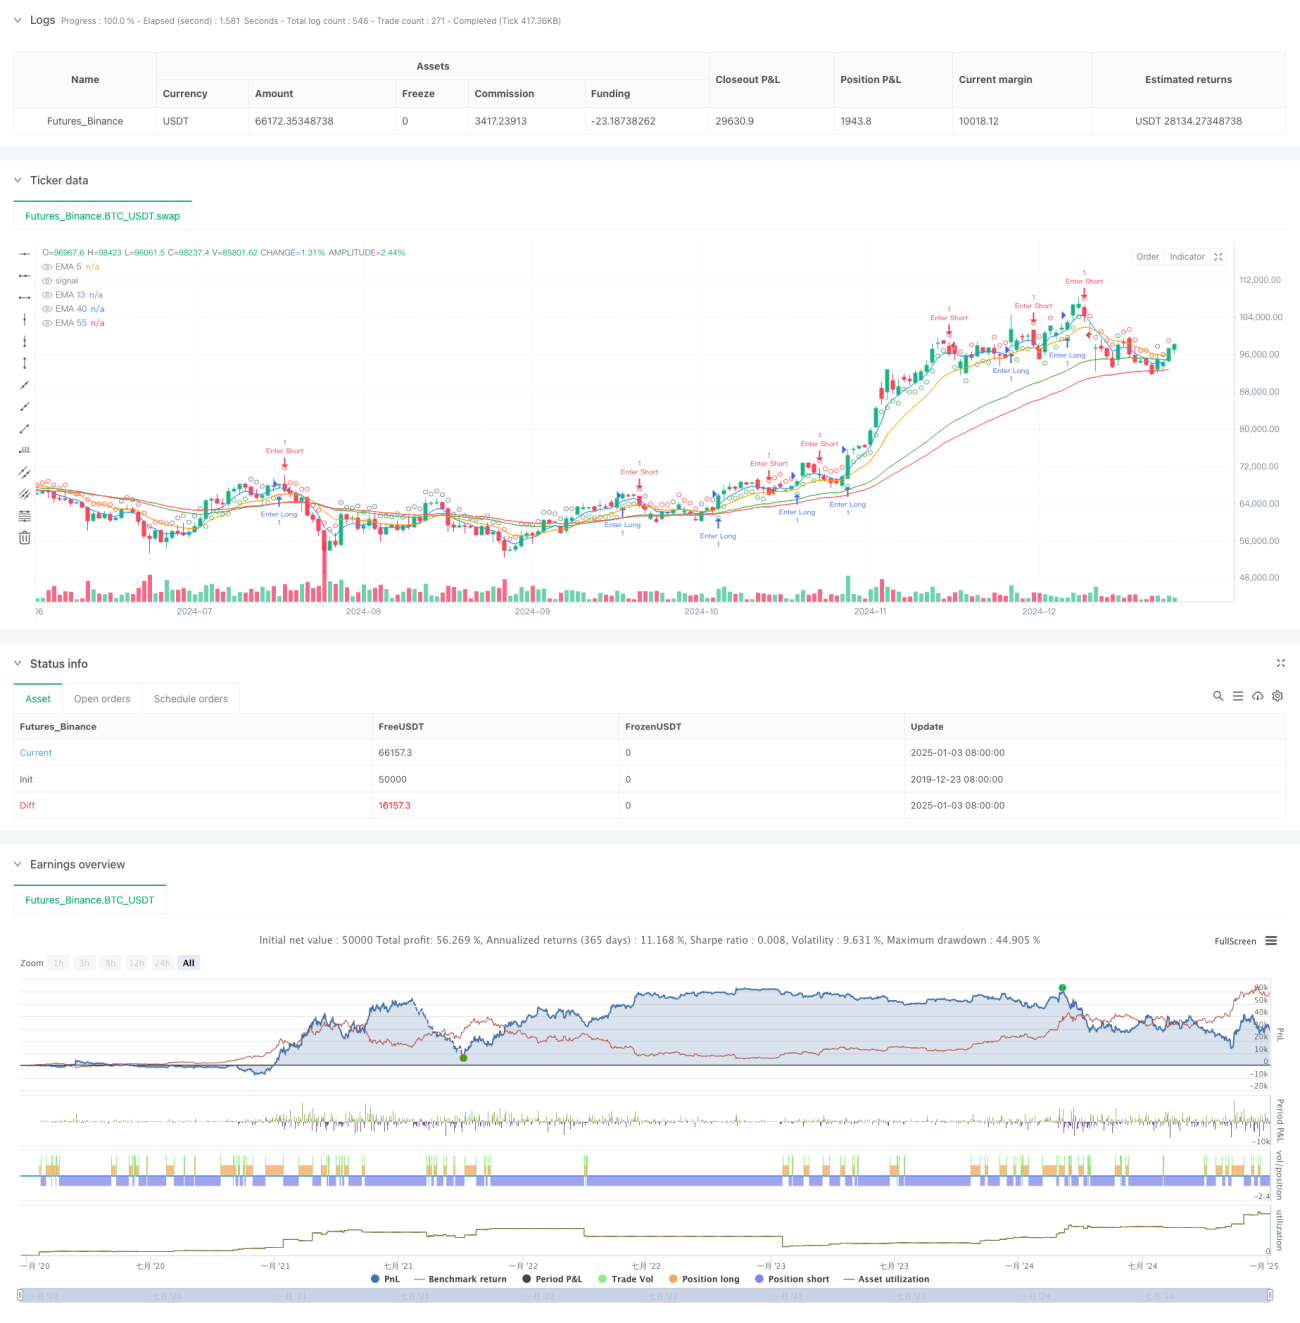
The strategy utilizes four EMAs of different periods (5, 13, 40, 55) to construct a trend framework, enhanced by the RSI indicator (14-period) for market direction judgment. Specifically:
- Long signals are generated when the 5-period EMA crosses above the 13-period EMA and the 40-period EMA crosses above the 55-period EMA
- Trend confirmation requires RSI above 50 and higher than its 14-period average
- The system calculates the distance between EMA5 and EMA13, comparing it with the average distance of the past 5 candles to judge trend strength
- Strong buy signals are issued when RSI exceeds 60, and strong sell signals when below 40
- Trend persistence is verified by calculating distance changes between EMA40 and EMA13
Strategy Advantages
- Multiple confirmation mechanisms significantly reduce false signals
- Dynamic distance calculations help identify trend strength changes
- RSI threshold design provides additional market strength assessment
- Signal persistence mechanism reduces frequent trading risks
- Trend reversal early warning function aids in advance positioning
- System demonstrates good adaptability to different market environments
Strategy Risks
- May generate excessive neutral signals in sideways markets
- Multiple indicators might lead to signal lag
- Parameter optimization could result in overfitting
- Large drawdowns possible during rapid trend reversals
- False breakouts from EMA crossovers require additional filtering
Strategy Optimization Directions
- Incorporate volume indicators to enhance signal reliability
- Optimize RSI parameters to improve market turning point prediction
- Add ATR indicator for dynamic stop-loss adjustment
- Develop adaptive parameter system to enhance strategy stability
- Build multi-timeframe signal confirmation mechanism
- Implement volatility filters to reduce false signals
Summary
This strategy achieves effective risk control while maintaining signal stability through the synergy of multiple technical indicators. The system design thoroughly considers market diversity, employing dynamic thresholds and distance calculations to enhance adaptability. Through continuous optimization and improvement, the strategy shows promise in maintaining stable performance across various market conditions.
/*backtest
start: 2019-12-23 08:00:00
end: 2025-01-04 08:00:00
period: 1d
basePeriod: 1d
exchanges: [{"eid":"Futures_Binance","currency":"BTC_USDT"}]
*/

//@version=6
strategy("EMA Crossover Strategy with RSI Average, Distance, and Signal Persistence", overlay=true, fill_orders_on_standard_ohlc=true)

// Define EMAs- 1