Utilice la función KLineChart para hacer más fácil el diseño del dibujo de estrategias
El autor:Un sueño pequeño., Creado: 2022-07-05 15:13:55, Actualizado: 2023-09-25 19:49:32
Utilice la función KLineChart para hacer más fácil el diseño del dibujo de estrategias
Al diseñar una estrategia, a menudo es necesario diseñar un gráfico de estrategia para mostrar, al escribir estrategias en lenguaje JavaScript, lenguaje Python, los usuarios que no están familiarizados con la programación o la biblioteca de gráficos utilizada en la plataforma FMZ a menudo luchan con el diseño de código para dibujar en gráficos personalizados.
Esta forma sencilla y poderosa de dibujar se puede ver en el lenguaje Pine, que es conocido por sus ricas funciones de dibujo. Si la interfaz de dibujo del lenguaje Pine puede conectarse a las estrategias de los lenguajes JavaScript y Python, facilitará enormemente la función de dibujo de la estrategia de diseño del desarrollador. Por lo tanto, en base a esta demanda, la plataforma FMZ ha actualizado la función de dibujo personalizado y ampliado la forma de usar elKLineChartPuede consultar la documentación API en:https://www.fmz.com/api#klinechart
Comencemos escribiendo un ejemplo simple usando el lenguaje JavaScript para la transición.
Ejemplo simple
/*backtest
start: 2022-03-21 09:00:00
end: 2022-06-21 15:00:00
period: 30m
basePeriod: 15m
exchanges: [{"eid":"Binance","currency":"BTC_USDT"}]
*/

function main() {
    var c = KLineChart()
    while (true) {
        var bars = _C(exchange.GetRecords)
        for (var i = 0 ; i < bars.length ; i++) {
            var bar = bars[i]
            c.begin(bar)
            c.plot(bar.Volume, "Close")
            c.close()
        }
        Sleep(1000)
    }
}
Este ejemplo es muy simple, simplemente dibuja un gráfico de K-línea en el área de dibujo personalizado de la estrategia, y dibuja una curva de volumen correspondiente a cada K-línea BAR en la posición de sub-gráfico del gráfico.
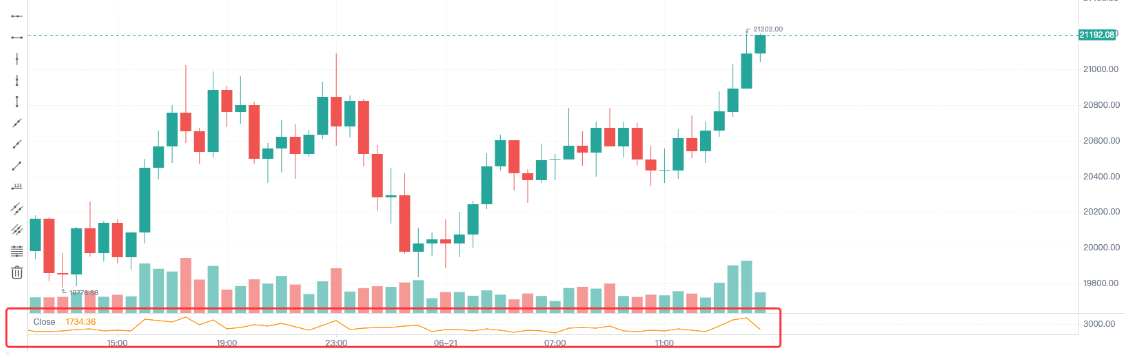
En el código, usamosvar c = KLineChart()Para crear un objeto de gráfico primero, y luego usar su método para dibujar un gráfico. Luego en el bucle, obtenemos los datos de la línea K (estructura de matriz), y atravesamos la matriz de líneas K. Se puede atravesar usando un bucle simple como en el ejemplo, o se puede atravesar de otras maneras.
La operación de dibujo comienza con elc.begin(bar)Función y finaliza con elc.close()La funciónbeginycloselas funciones son todos los métodos del objeto del gráfico c. A continuación, utilizar la función de dibujo más comúnmente utilizadoplotpara dibujar la curva de volumen en cada BAR.
Un ejemplo más complejo
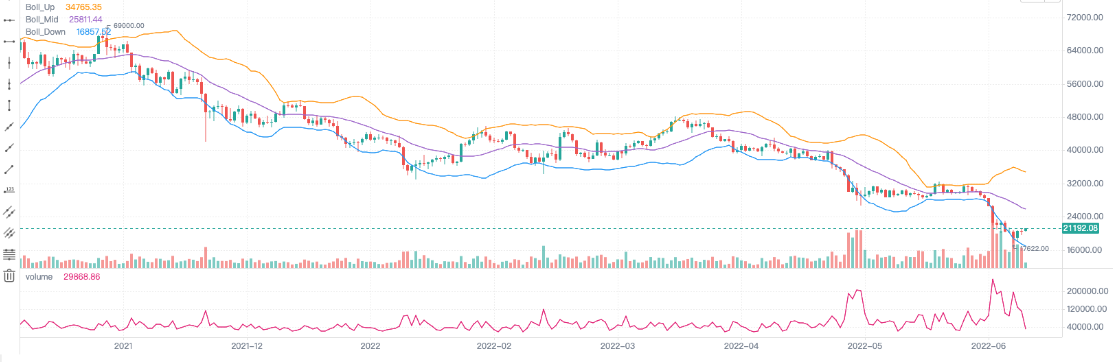
Supongamos que queremos diseñar un gráfico con el indicador de Bollinger adjunto. y también viene con un gráfico de volumen de cada BAR, que se puede diseñar así:
/*backtest
start: 2022-03-21 09:00:00
end: 2022-06-21 15:00:00
period: 1d
basePeriod: 1h
exchanges: [{"eid":"Binance","currency":"BTC_USDT"}]
*/

function main() {
    var c = KLineChart()

    // main strategy loop
    while(true) {
        // polling interval
        Sleep(500)

        // get K-line data
        let bars = exchange.GetRecords()
        if (!bars || bars.length <= 20) {
            continue
        }

        // calculate the Bollinger indicator
        var boll = TA.BOLL(bars)

        bars.forEach(function(bar, index) {
            c.begin(bar)
            // drawing operation
            c.plot(boll[0][index], "Boll_Up", {overlay: true})     // Draw on the main chart
            c.plot(boll[1][index], "Boll_Mid", {overlay: true})    // Draw on the main chart
            c.plot(boll[2][index], "Boll_Down", {overlay: true})   // Draw on the main chart
            c.plot(bar.Volume, "volume")                           // Draw on the sub-chart
            c.close()
        })

        // Strategy trading logic
        // ...
        // ..
    }
}
Como podemos ver en el código, nuestra información de configuración backtest en la plataforma FMZ es:
/*backtest
start: 2022-03-21 09:00:00
end: 2022-06-21 15:00:00
period: 1d
basePeriod: 1h
exchanges: [{"eid":"Binance","currency":"BTC_USDT"}]
*/
Tal configuración es usar la prueba de backtesting de objeto de intercambio Binance spot.
Se puede ver que usamos el método de dibujo de Pine
Escribir indicadores y otros datos para dibujar gráficos
Las operaciones de obtención de datos de línea K y cálculo de indicadores son comunes y simples en los ejemplos de estrategia en el cuadrado de estrategia de la plataforma y en la documentación de la API.
        // obtain K-line data
        let bars = exchange.GetRecords()
        if (!bars || bars.length <= 20) {
            // If the acquisition of the K line fails, that is, if !bar is true, execute continue, ignore the following code, and re-execute the loop
            // If bars.length is less than or equal to 20, that is, the number of K-line BAR (bar) is less than 20, the indicator cannot be calculated, and continue is also executed
            continue
        }

        // Calculate the Bollinger indicator
        var boll = TA.BOLL(bars)
La función de cálculo del indicador Bollinger TA.BOLL, si no se especifican los parámetros del indicador Bollinger, los parámetros predeterminadosBOLL(20, 2)El indicador de Bollinger tiene tres líneas, por lo que los datos devueltos por la función TA.BOLL son una matriz bidimensional. boll[0], boll[1], y boll[2] son los tres elementos de la matriz de boll, cada uno de los cuales representa una línea y es una matriz.
- Bollinger Bands hacia arriba en línea
- boll[1]: Línea media de las bandas de Bollinger
- boll[2]: Bandas de Bollinger hacia abajo
Luego veremos cómo dibujar el volumen de los datos de la línea K, es decir, el volumen, y los datos del indicador de Bollinger calculados en el gráfico.
Dibujamos los datos K-línea barra por barra, por lo que tenemos que atravesar toda la matriz K-línea, es decir, atravesar la matriz de barras en el código.forEachEl método se utiliza aquí para atravesar, o el bucle for se puede utilizar para atravesar.
        bars.forEach(function(bar, index) {
            c.begin(bar)
            // Drawing operations
            c.plot(boll[0][index], "Boll_Up", {overlay: true})     // {overlay: true} Parameter control, drawn on the main chart
            c.plot(boll[1][index], "Boll_Mid", {overlay: true})    // Draw on the main chart
            c.plot(boll[2][index], "Boll_Down", {overlay: true})   // Draw on the main chart
            c.plot(bar.Volume, "volume")                           // Draw on the sub-chart
            c.close()
        })
Debe tenerse en cuenta que cada vez que comience una operación de dibujo de gráficos en una barra, debe hacer unc.begin(bar)La función de llamada primero.beginFunción es uno de nuestros objetos de gráfico método c. Al final de la operación de dibujo,c.close()- ¿Por qué no lo llamas?beginLa función y elcloseFunción es la función de dibujo que llamamos similar al método de dibujo del lenguaje Pine.barcolor bgcolor plot fill hline plotarrow plotshape plotchar plotcandle signal, puede dibujar líneas, flechas, marcar información, etc. Los parámetros de estas funciones son los mismos que los parámetros de función correspondientes al lenguaje Pine, y las funciones de dibujo también son las mismas.
Añadir el dibujo de flechas de señales de negociación, marcadores, líneas horizontales, etc.
Añadir algunas flechas de señal de trading, marcadores, líneas horizontales al ejemplo de gráfico de Bollinger Bands anterior.
/*backtest
start: 2022-03-21 09:00:00
end: 2022-06-21 15:00:00
period: 1d
basePeriod: 1h
exchanges: [{"eid":"Binance","currency":"BTC_USDT"}]
*/

function main() {
    var c = KLineChart({overlay : true})

    // Strategy main loop
    while(true) {
        // Polling interval
        Sleep(500)

        // Obtain K-line data
        let bars = exchange.GetRecords()
        if (!bars || bars.length <= 20) {
            continue
        }

        // Calculate Bollinger indicator
        var boll = TA.BOLL(bars)

        bars.forEach(function(bar, index) {
            c.begin(bar)
            // Drawing operations
            c.plot(boll[0][index], "Boll_Up", {overlay: true})     // Draw on the main chart
            c.plot(boll[1][index], "Boll_Mid", {overlay: true})    // Draw on the main chart
            c.plot(boll[2][index], "Boll_Down", {overlay: true})   // Draw on the main chart
            c.plot(bar.Volume, "volume", {overlay: false})         // Draw on the sub-chart

            c.hline(bar.Open, {overlay: true})                          // Horizontal line
            c.plotarrow(bar.Close - bar.Open, {overlay: true})          // Arrow
            c.plotshape(bar.Close - bar.Open > 0, {style: 'square'})    // Draw square markers
            c.plotchar(bar.Close - bar.Open < 0, {char: 'X'})           // Draw the character X

            c.close()
        })

        // Strategy trading logic
        // ...
        // ..
    }
}

Objeto de configuración de gráfico
Se puede declarar una estructura para configurar el estilo del gráfico. Por ejemplo, la siguiente variable chartCfg representa la información de configuración de una línea de cuadrícula.
    var chartCfg = {
        grid: {
            show: true,
            // Grid horizontal line
            horizontal: {
                show: true,
                size: 2,
                color: '#FF0000',    // Color of horizontal grid line
                // 'solid'|'dash'
                style: 'dash',       // Type of line
                dashValue: [2, 2]
            },
   	        // Grid vertical line
            vertical: {
                show: true,
                size: 2,
                color: '#32CD32',
                // 'solid'|'dash'
                style: 'solid',
                dashValue: [2, 2]
            }
        },
    }
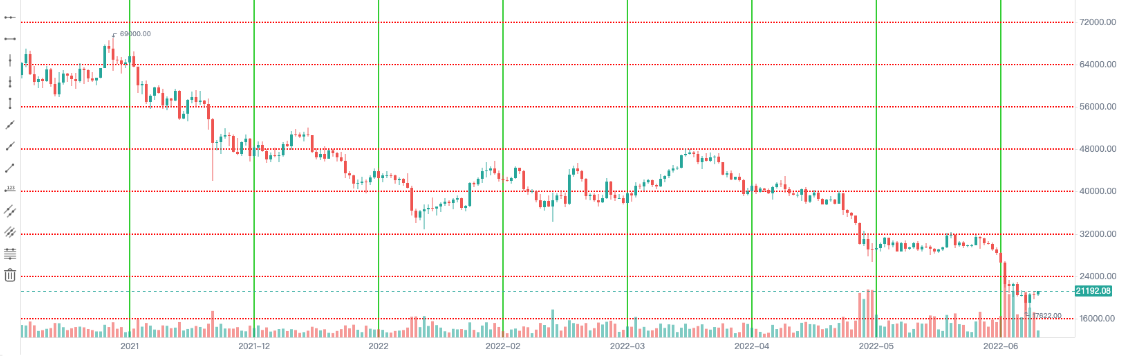
El objeto de configuración del gráfico es la estructura de datos que establece algunas propiedades y apariencia del gráfico. Por ejemplo, se utiliza una configuración de estilo de línea de cuadrícula en el ejemplo. También hay muchas opciones que se pueden configurar y modificar, como el eje X, la configuración relacionada con el eje Y, la configuración de la línea del cursor, la configuración del mensaje de alerta, la configuración del estilo del indicador técnico, la configuración del estilo BAR de la línea K, etc.
Por supuesto, si usted no está familiarizado con estos, no se puede pasar en el objeto de configuración de gráfico al llamar a laKLineChartEntonces el gráfico creado es el estilo predeterminado.KLineChartfunción de la plataforma FMZ para crear un objeto de gráfico:
var c = KLineChart(chartCfg)
Código de ensayo para dibujar líneas de cuadrícula:
/*backtest
start: 2022-03-21 09:00:00
end: 2022-06-21 15:00:00
period: 1d
basePeriod: 1h
exchanges: [{"eid":"Binance","currency":"BTC_USDT"}]
*/

function main() {
    var chartCfg = {
        grid: {
            show: true,
            // Grid horizontal line
            horizontal: {
                show: true,
                size: 2,
                color: '#FF0000',
                // 'solid'|'dash'
                style: 'dash',
                dashValue: [2, 2]
            },
   	        // Grid vertical line
            vertical: {
                show: true,
                size: 2,
                color: '#32CD32',
                // 'solid'|'dash'
                style: 'solid',
                dashValue: [2, 2]
            }
        },
    }

    var c = KLineChart(chartCfg)

    // Strategy main loop
    while(true) {
        // Polling interval
        Sleep(500)

        // Obtain K-line data
        var bars = _C(exchange.GetRecords)
        bars.forEach(function(bar, index) {
            c.begin(bar)
            c.close()
        })

        // Strategy trading logic
        // ...
        // ..
    }
}
Ejemplo de estilo de configuración de gráfico
Se puede utilizar para referirse a la configuración de configuración de gráficos.
{
// Gridlines
grid: {
show: true,
// Grid horizontal line
horizontal: {
show: true,
size: 1,
color: '#393939',
// 'solid'|'dash'
style: 'dash',
dashValue: [2, 2]
},
// Grid vertical line
vertical: {
show: false,
size: 1,
color: '#393939',
// 'solid'|'dash'
style: 'dash',
dashValue: [2, 2]
}
},
// Candlestick chart
candle: {
// The distance between the top and bottom of the candlestick chart, greater than 1 is the absolute value, greater than 0, and 1 is the proportion
margin: {
top: 0.2,
bottom: 0.1
},
// Type of Candlestick Charts 'candle_solid'|'candle_stroke'|'candle_up_stroke'|'candle_down_stroke'|'ohlc'|'area'
type: 'candle_solid',
// Candle pillar
bar: {
upColor: '#26A69A',
downColor: '#EF5350',
noChangeColor: '#888888'
},
// Area map
area: {
lineSize: 2,
lineColor: '#2196F3',
value: 'close',
backgroundColor: [{
offset: 0,
color: 'rgba(33, 150, 243, 0.01)'
}, {
offset: 1,
color: 'rgba(33, 150, 243, 0.2)'
}]
},
priceMark: {
show: true,
// Highest price marker
high: {
show: true,
color: '#D9D9D9',
textMargin: 5,
textSize: 10,
textFamily: 'Helvetica Neue',
textWeight: 'normal'
},
// Lowest price marker
low: {
show: true,
color: '#D9D9D9',
textMargin: 5,
textSize: 10,
textFamily: 'Helvetica Neue',
textWeight: 'normal',
},
// Latest price marker
last: {
show: true,
upColor: '#26A69A',
downColor: '#EF5350',
noChangeColor: '#888888',
line: {
show: true,
// 'solid'|'dash'
style: 'dash',
dashValue: [4, 4],
size: 1
},
text: {
show: true,
size: 12,
paddingLeft: 2,
paddingTop: 2,
paddingRight: 2,
paddingBottom: 2,
color: '#FFFFFF',
family: 'Helvetica Neue',
weight: 'normal',
borderRadius: 2
}
}
},
// Tips
tooltip: {
// 'always' | 'follow_cross' | 'none'
showRule: 'always',
// 'standard' | 'rect'
showType: 'standard',
labels: ['time', 'open', 'close', 'high', 'low', 'volume'],
values: null,
defaultValue: 'n/a',
rect: {
paddingLeft: 0,
paddingRight: 0,
paddingTop: 0,
paddingBottom: 6,
offsetLeft: 8,
offsetTop: 8,
offsetRight: 8,
borderRadius: 4,
borderSize: 1,
borderColor: '#3f4254',
backgroundColor: 'rgba(17, 17, 17, .3)'
},
text: {
size: 12,
family: 'Helvetica Neue',
weight: 'normal',
color: '#D9D9D9',
marginLeft: 8,
marginTop: 6,
marginRight: 8,
marginBottom: 0
}
}
},
// Technical indicators
technicalIndicator: {
margin: {
top: 0.2,
bottom: 0.1
},
bar: {
upColor: '#26A69A',
downColor: '#EF5350',
noChangeColor: '#888888'
},
line: {
size: 1,
colors: ['#FF9600', '#9D65C9', '#2196F3', '#E11D74', '#01C5C4']
},
circle: {
upColor: '#26A69A',
downColor: '#EF5350',
noChangeColor: '#888888'
},
// Latest value marker
lastValueMark: {
show: false,
text: {
show: false,
color: '#ffffff',
size: 12,
family: 'Helvetica Neue',
weight: 'normal',
paddingLeft: 3,
paddingTop: 2,
paddingRight: 3,
paddingBottom: 2,
borderRadius: 2
}
},
// Tips
tooltip: {
// 'always' | 'follow_cross' | 'none'
showRule: 'always',
// 'standard' | 'rect'
showType: 'standard',
showName: true,
showParams: true,
defaultValue: 'n/a',
text: {
size: 12,
family: 'Helvetica Neue',
weight: 'normal',
color: '#D9D9D9',
marginTop: 6,
marginRight: 8,
marginBottom: 0,
marginLeft: 8
}
}
},
// x-axis
xAxis: {
show: true,
height: null,
// x-axis line
axisLine: {
show: true,
color: '#888888',
size: 1
},
// x-axis split text
tickText: {
show: true,
color: '#D9D9D9',
family: 'Helvetica Neue',
weight: 'normal',
size: 12,
paddingTop: 3,
paddingBottom: 6
},
// x-axis split line
tickLine: {
show: true,
size: 1,
length: 3,
color: '#888888'
}
},
// y-axis
yAxis: {
show: true,
width: null,
// 'left' | 'right'
position: 'right',
// 'normal' | 'percentage' | 'log'
type: 'normal',
inside: false,
reverse: false,
// y-axis line
axisLine: {
show: true,
color: '#888888',
size: 1
},
// y-axis split text
tickText: {
show: true,
color: '#D9D9D9',
family: 'Helvetica Neue',
weight: 'normal',
size: 12,
paddingLeft: 3,
paddingRight: 6
},
// y-axis split line
tickLine: {
show: true,
size: 1,
length: 3,
color: '#888888'
}
},
// Split line between charts
separator: {
size: 1,
color: '#888888',
fill: true,
activeBackgroundColor: 'rgba(230, 230, 230, .15)'
},
// Crosshair
crosshair: {
show: true,
// Horizontal line and text of crosshair
horizontal: {
show: true,
line: {
show: true,
// 'solid'|'dash'
style: 'dash',
dashValue: [4, 2],
size: 1,
color: '#888888'
},
text: {
show: true,
color: '#D9D9D9',
size: 12,
family: 'Helvetica Neue',
weight: 'normal',
paddingLeft: 2,
paddingRight: 2,
paddingTop: 2,
paddingBottom: 2,
borderSize: 1,
borderColor: '#505050',
borderRadius: 2,
backgroundColor: '#505050'
}
},
// Vertical line and text of crosshair
vertical: {
show: true,
line: {
show: true,
// 'solid'|'dash'
style: 'dash',
dashValue: [4, 2],
size: 1,
color: '#888888'
},
text: {
show: true,
color: '#D9D9D9',
size: 12,
family: 'Helvetica Neue',
weight: 'normal',
paddingLeft: 2,
paddingRight: 2,
paddingTop: 2,
paddingBottom: 2,
borderSize: 1,
borderColor: '#505050',
borderRadius: 2,
backgroundColor: '#505050'
}
}
},
// Graph
shape: {
point: {
backgroundColor: '#2196F3',
borderColor: '#2196F3',
borderSize: 1,
radius: 4,
activeBackgroundColor: '#2196F3',
activeBorderColor: '#2196F3',
activeBorderSize: 1,
activeRadius: 6
},
line: {
// 'solid'|'dash'
style: 'solid'
color: '#2196F3',
size: 1,
dashValue: [2, 2]
},
polygon: {
// 'stroke'|'fill'
style: 'stroke',
stroke: {
// 'solid'|'dash'
style: 'solid',
size: 1,
color: '#2196F3',
dashValue: [2, 2]
},
fill: {
color: 'rgba(33, 150, 243, 0.1)'
}
},
arc: {
// 'stroke'|'fill'
style: 'stroke',
stroke: {
// 'solid'|'dash'
style: 'solid',
size: 1,
color: '#2196F3',
dashValue: [2, 2]
},
fill: {
color: '#2196F3'
}
},
text: {
style: 'fill',
color: '#2196F3',
size: 12,
family: 'Helvetica Neue',
weight: 'normal',
offset: [0, 0]
}
},
annotation: {
// 'top' | 'bottom' | 'point'
position: 'top',
offset: [20, 0]
symbol: {
// 'diamond' | 'circle' | 'rect' | 'triangle' | 'custom' | 'none'
type: 'diamond',
size: 8,
color: '#2196F3',
activeSize: 10,
activeColor: '#FF9600'
}
},
tag: {
// 'top' | 'bottom' | 'point'
position: 'point',
offset: 0,
line: {
show: true,
style: LineStyle.DASH,
dashValue: [4, 2],
size: 1,
color: '#2196F3'
},
text: {
color: '#FFFFFF',
backgroundColor: '#2196F3',
size: 12,
family: 'Helvetica Neue',
weight: 'normal',
paddingLeft: 2,
paddingRight: 2,
paddingTop: 2,
paddingBottom: 2,
borderRadius: 2,
borderSize: 1,
borderColor: '#2196F3'
},
mark: {
offset: 0,
color: '#FFFFFF',
backgroundColor: '#2196F3',
size: 12,
family: 'Helvetica Neue',
weight: 'normal',
paddingLeft: 2,
paddingRight: 2,
paddingTop: 2,
paddingBottom: 2,
borderRadius: 2,
borderSize: 1,
borderColor: '#2196F3'
}
}
}
¿No facilita esto el diseño de estrategias?
- Cuantificar el análisis fundamental en el mercado de criptomonedas: ¡Deja que los datos hablen por sí mismos!
- La investigación cuantitativa básica del círculo monetario - ¡No confíes más en los profesores de idiomas, los datos hablan objetivamente!
- Una herramienta esencial en el campo de la transacción cuantitativa - inventor de módulos de exploración de datos cuantitativos
- Dominarlo todo - Introducción a FMZ Nueva versión de la terminal de negociación (con el código fuente de TRB Arbitrage)
- Conozca todo acerca de la nueva versión del terminal de operaciones de FMZ (con código de código de TRB)
- FMZ Quant: Análisis de ejemplos de diseño de requisitos comunes en el mercado de criptomonedas (II)
- Cómo explotar robots de venta sin cerebro con una estrategia de alta frecuencia en 80 líneas de código
- Cuantificación FMZ: Desarrollo de casos de diseño de necesidades comunes en el mercado de criptomonedas (II)
- Cómo utilizar una estrategia de alta frecuencia de 80 líneas de código para explotar y vender robots sin cerebro
- FMZ Quant: Análisis de ejemplos de diseño de requisitos comunes en el mercado de criptomonedas (I)
- Cuantificación FMZ: Desarrollo de casos de diseño de necesidades comunes en el mercado de criptomonedas (1)