Comercio cuantitativo de criptomonedas para principiantes - acercándote a la criptomoneda cuantitativa (5)
El autor:- ¿ Por qué?, Creado: 2022-08-03 16:08:50, Actualizado: 2023-09-21 21:07:02
En el artículo anterior, explicamos el análisis de la lógica de negociación de una estrategia de cuadrícula simple.
-
Análisis de la lógica de negociación Como mencionamos en el artículo anterior, puede desencadenar una acción comercial atravesando cada línea de la cuadrícula y juzgando el cruce de precios actual por encima o por debajo.
El primer detalle que tenemos que considerar es el diseño de la red infinita.
createNetEsta función genera una estructura de datos de red con un número finito de líneas de red. Entonces, ¿qué pasa si el precio va más allá de los límites de esta estructura de datos de red (más allá de la línea de red superior donde el precio es el más alto, y la línea de red inferior donde el precio es el más bajo) cuando la estrategia se está ejecutando? Así que necesitamos añadir un mecanismo de extensión a la estructura de datos de la red primero.Comencemos a escribir la función principal de la estrategia, que es el código donde la estrategia comienza a ejecutarse
var diff = 50                                 // Global variables and grid spacing can be designed as parameters for easy explanation. We write this parameter into the code.
function main() {
    // After the real bot starts running, execute the strategy code from here
    var ticker = _C(exchange.GetTicker)       // To get the latest market data ticker, please refer to the FMZ API documentation for the structure of the ticker data: https://www.fmz.com/api#ticker
    var net = createNet(ticker.Last, diff)    // The function we designed in the previous article to construct the grid data structure initially, here we construct a grid data structure net

    while (true) {                            // Then the program logic enters this while infinite loop, and the strategy execution will continue to execute the code within the {} symbol here.
        ticker = _C(exchange.GetTicker)       // The first line of the infinite loop code section, get the latest market data and update it to the ticker variable
        // Check the grid range
        while (ticker.Last >= net[net.length - 1].price) {
            net.push({
                buy : false,
                sell : false,
                price : net[net.length - 1].price + diff,
            })
        }
        while (ticker.Last <= net[0].price) {
            var price = net[0].price - diff
            if (price <= 0) {
                break
            }
            net.unshift({
                buy : false,
                sell : false,
                price : price,
            })
        }

        // There are other codes...
    }
}
Para que la estructura de datos de la red sea extensible, se utiliza este código (extraído del código anterior):
      // Check the grid range
      while (ticker.Last >= net[net.length - 1].price) {   // If the price exceeds the grid line of the highest price of the grid
          net.push({                                       // Just add a new grid line after the grid line with the highest price of the grid
              buy : false,                                 // Initialize sell marker
              sell : false,                                // Initialize buy marker
              price : net[net.length - 1].price + diff,    // dd a grid spacing to the previous highest price
          })
      }
      while (ticker.Last <= net[0].price) {                // If the price is lower than the grid line of the lowest price of the grid
          var price = net[0].price - diff                  // Different from adding upwards, it should be noted that the price of adding new grid lines downwards cannot be less than or equal to 0, so it is necessary to judge here
          if (price <= 0) {                                // Less than or equal to 0 will not be added, jump out of this loop
              break
          }
          net.unshift({                                    // Add a new grid line just before the grid line with the lowest price of the grid
              buy : false,
              sell : false,
              price : price,
          })
      }
El siguiente paso es considerar cómo implementar el activador de negociación específicamente.
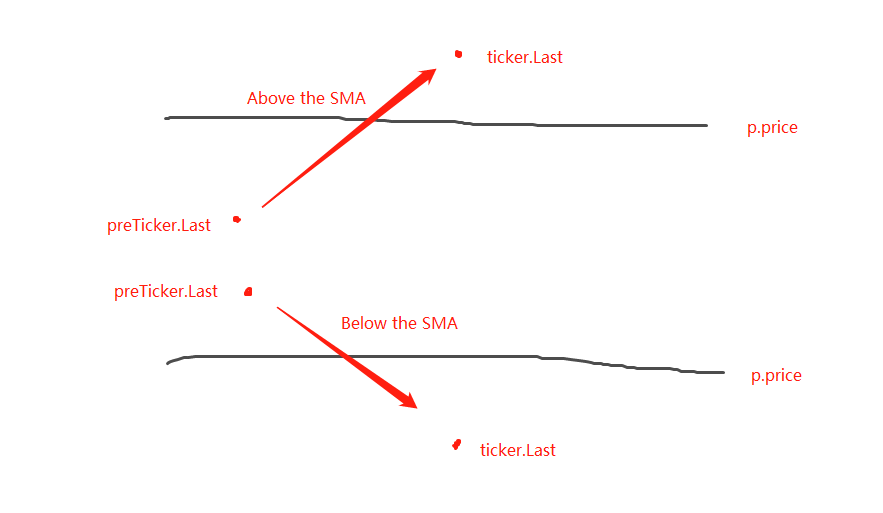
var diff = 50
var amount = 0.002       // Add a global variable, which can also be designed as a parameter. Of course, for the sake of simplicity, we also write it in the strategy code.
                         // This parameter controls the trade volume each time a trade is triggered on the grid line
function main() {
    var ticker = _C(exchange.GetTicker)
    var net = createNet(ticker.Last, diff)
    var preTicker = ticker       // Before the main loop (fixed loop) starts, set a variable to record the last market data
    while (true) {
        ticker = _C(exchange.GetTicker)
        // Check the grid range
        while (ticker.Last >= net[net.length - 1].price) {
            net.push({
                buy : false,
                sell : false,
                price : net[net.length - 1].price + diff,
            })
        }
        while (ticker.Last <= net[0].price) {
            var price = net[0].price - diff
            if (price <= 0) {
                break
            }
            net.unshift({
                buy : false,
                sell : false,
                price : price,
            })
        }

        // Retrieve grid
        for (var i = 0 ; i < net.length ; i++) {     // Iterate over all grid lines in the grid data structure
            var p = net[i]
            if (preTicker.Last < p.price && ticker.Last > p.price) {         // Above the SMA, sell, the current node has already traded, regardless of SELL BUY, it will no longer be traded
                if (i != 0) {
                    var downP = net[i - 1]
                    if (downP.buy) {
                        exchange.Sell(-1, amount, ticker)
                        downP.buy = false
                        p.sell = false
                        continue
                    }
                }
                if (!p.sell && !p.buy) {
                    exchange.Sell(-1, amount, ticker)
                    p.sell = true
                }
            } else if (preTicker.Last > p.price && ticker.Last < p.price) {  // Below the SMA, buy
                if (i != net.length - 1) {
                    var upP = net[i + 1]
                    if (upP.sell) {
                        exchange.Buy(-1, amount * ticker.Last, ticker)
                        upP.sell = false
                        p.buy = false
                        continue
                    }
                }
                if (!p.buy && !p.sell) {
                    exchange.Buy(-1, amount * ticker.Last, ticker)
                    p.buy = true
                }
            }
        }
        preTicker = ticker    // Record the current market data in preTicker, and in the next cycle, use it as a comparison between the "previous" market data and the latest one to judge whether to be above the SMA or below the SMA.
        Sleep(500)
    }
}
Se puede ver que:
- Condición para el cruce por encima de las líneas de la red:
preTicker.Last < p.price && ticker.Last > p.price - Condición para cruzar por debajo de las líneas de la red:
preTicker.Last > p.price && ticker.Last < p.price
Esto es lo que dijimos en el post anterior:
- Condición para el cruce por encima de las líneas de la red:
La determinación de si se debe situar por encima o por debajo de la SMA es sólo el primer paso para determinar si se puede realizar un pedido, y también es necesario evaluar las marcas de los datos de la línea de la red.
Si está por encima de la SMA, se juzga que el precio es inferior a la línea de la red actual y la marca de compra en la línea de la red más cercana.
Después de juzgar las condiciones, si no hay disparador, continúa juzgando. Si las marcas de compra / venta en la línea de red actual son ambas falsas, significa que la línea de red actual se puede negociar. Dado que está por encima de la SMA, realizaremos una operación de venta aquí. Después de la ejecución, marque la marca de venta de la línea de red actual como verdadera.
La lógica de procesamiento es la misma para estar por debajo de la SMA (a la izquierda para los principiantes a pensar aquí).
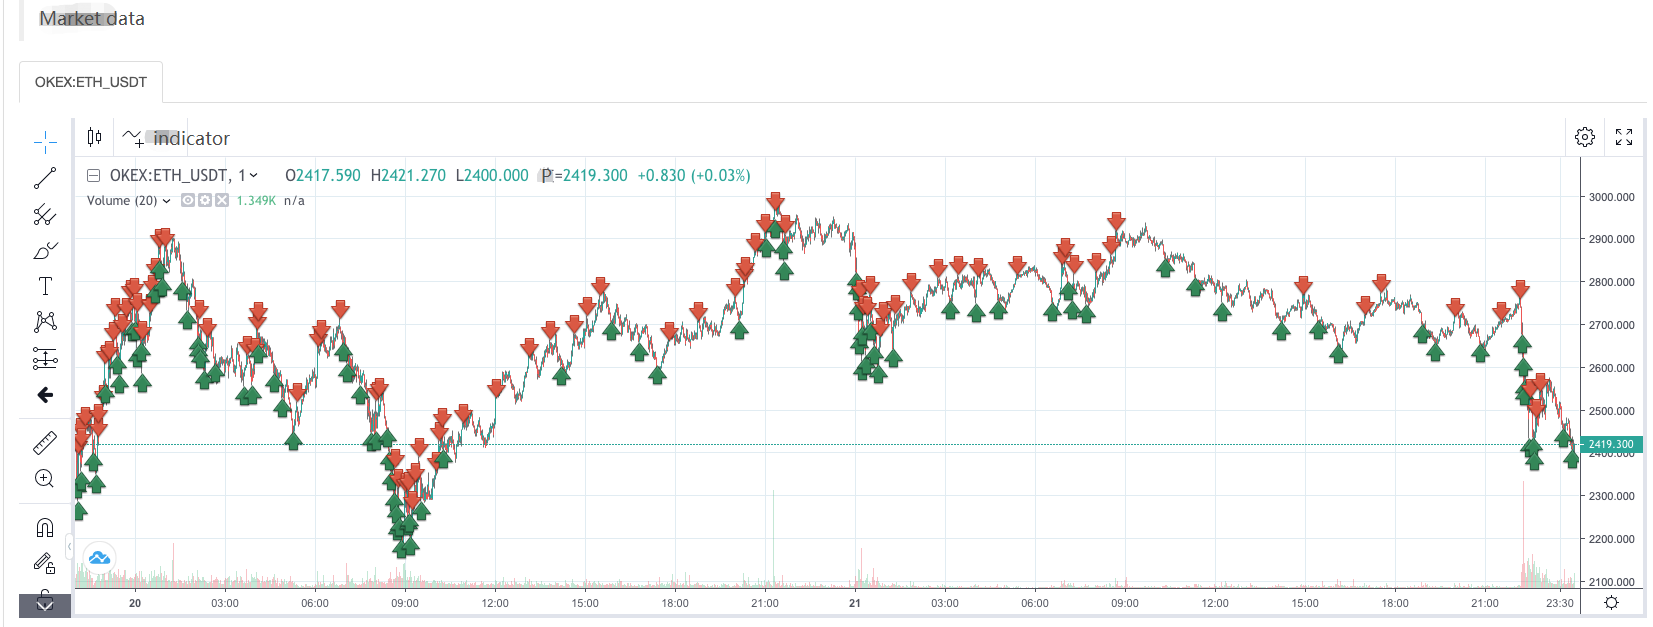
Pruebas posteriores completas de la estrategia
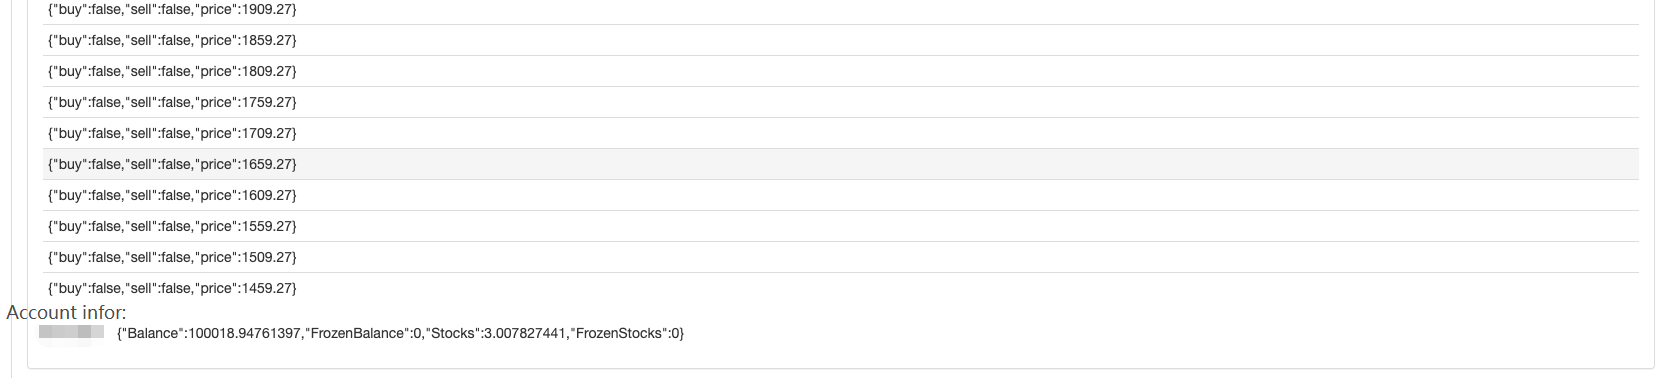
Para ver algunos datos durante backtesting, una funciónshowTblse escribe para mostrar los datos.
function showTbl(arr) {
    var tbl = {
        type : "table",
        title : "grid",
        cols : ["grid information"],
        rows : []
    }
    var arrReverse = arr.slice(0).reverse()
    _.each(arrReverse, function(ele) {
        var color = ""
        if (ele.buy) {
            color = "#FF0000"
        } else if (ele.sell) {
            color = "#00FF00"
        }
        tbl.rows.push([JSON.stringify(ele) + color])
    })
    LogStatus(_D(), "\n`" + JSON.stringify(tbl) + "`", "\n account Information:", exchange.GetAccount())
}
Código completo de la estrategia:
/*backtest
start: 2021-04-01 22:00:00
end: 2021-05-22 00:00:00
period: 1d
basePeriod: 1m
exchanges: [{"eid":"OKEX","currency":"ETH_USDT","balance":100000}]
*/

var diff = 50
var amount = 0.002
function createNet(begin, diff) {
    var oneSideNums = 10
    var up = []
    var down = []
    for (var i = 0 ; i < oneSideNums ; i++) {
        var upObj = {
            buy : false,
            sell : false,
            price : begin + diff / 2 + i * diff,
        }
        up.push(upObj)

        var j = (oneSideNums - 1) - i
        var downObj = {
            buy : false,
            sell : false,
            price : begin - diff / 2 - j * diff,
        }
        if (downObj.price <= 0) {  // The price cannot be less than or equal to 0
            continue
        }
        down.push(downObj)
    }

    return down.concat(up)
}

function showTbl(arr) {
    var tbl = {
        type : "table",
        title : "grid",
        cols : ["grid Information"],
        rows : []
    }
    var arrReverse = arr.slice(0).reverse()
    _.each(arrReverse, function(ele) {
        var color = ""
        if (ele.buy) {
            color = "#FF0000"
        } else if (ele.sell) {
            color = "#00FF00"
        }
        tbl.rows.push([JSON.stringify(ele) + color])
    })
    LogStatus(_D(), "\n`" + JSON.stringify(tbl) + "`", "\n account Information:", exchange.GetAccount())
}

function main() {
    var ticker = _C(exchange.GetTicker)
    var net = createNet(ticker.Last, diff)
    var preTicker = ticker
    while (true) {
        ticker = _C(exchange.GetTicker)
        // Check the grid range
        while (ticker.Last >= net[net.length - 1].price) {
            net.push({
                buy : false,
                sell : false,
                price : net[net.length - 1].price + diff,
            })
        }
        while (ticker.Last <= net[0].price) {
            var price = net[0].price - diff
            if (price <= 0) {
                break
            }
            net.unshift({
                buy : false,
                sell : false,
                price : price,
            })
        }

        // Retrieve grid
        for (var i = 0 ; i < net.length ; i++) {
            var p = net[i]
            if (preTicker.Last < p.price && ticker.Last > p.price) {         // Being above the SMA, sell, the current node has already traded, regardless of SELL BUY, it will no longer be traded
                if (i != 0) {
                    var downP = net[i - 1]
                    if (downP.buy) {
                        exchange.Sell(-1, amount, ticker)
                        downP.buy = false
                        p.sell = false
                        continue
                    }
                }
                if (!p.sell && !p.buy) {
                    exchange.Sell(-1, amount, ticker)
                    p.sell = true
                }
            } else if (preTicker.Last > p.price && ticker.Last < p.price) {  // Being below the SMA, buy
                if (i != net.length - 1) {
                    var upP = net[i + 1]
                    if (upP.sell) {
                        exchange.Buy(-1, amount * ticker.Last, ticker)
                        upP.sell = false
                        p.buy = false
                        continue
                    }
                }
                if (!p.buy && !p.sell) {
                    exchange.Buy(-1, amount * ticker.Last, ticker)
                    p.buy = true
                }
            }
        }

        showTbl(net)
        preTicker = ticker
        Sleep(500)
    }
}
Pruebas de estrategia:
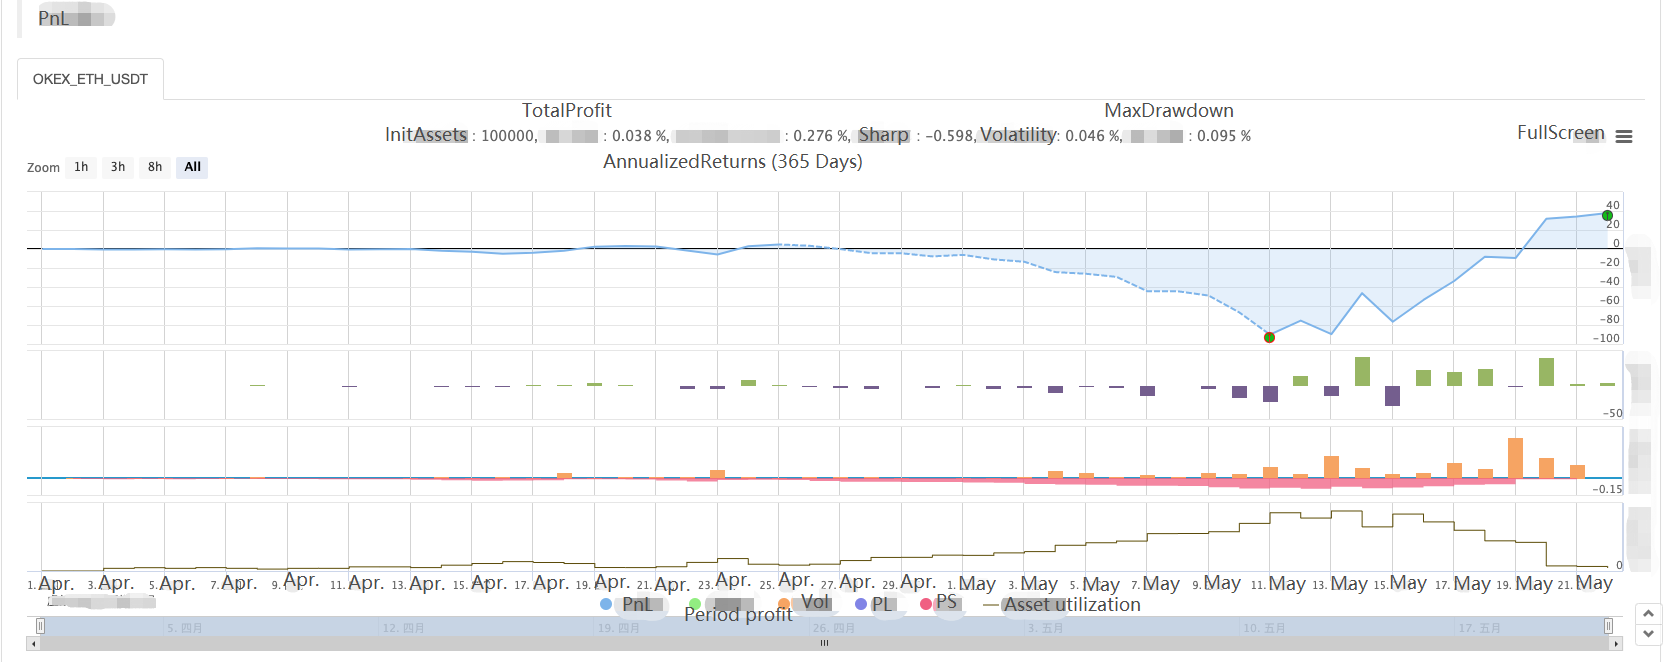
Así que podemos ver las características de la estrategia de red, cuando hay un mercado de tendencia, habrá una gran pérdida flotante, y la ganancia se recuperará en un mercado volátil.
Por lo tanto, la estrategia de red no está exenta de riesgos. La estrategia al contado todavía puede ser
- Cuantificar el análisis fundamental en el mercado de criptomonedas: ¡Deja que los datos hablen por sí mismos!
- La investigación cuantitativa básica del círculo monetario - ¡No confíes más en los profesores de idiomas, los datos hablan objetivamente!
- Una herramienta esencial en el campo de la transacción cuantitativa - inventor de módulos de exploración de datos cuantitativos
- Dominarlo todo - Introducción a FMZ Nueva versión de la terminal de negociación (con el código fuente de TRB Arbitrage)
- Conozca todo acerca de la nueva versión del terminal de operaciones de FMZ (con código de código de TRB)
- FMZ Quant: Análisis de ejemplos de diseño de requisitos comunes en el mercado de criptomonedas (II)
- Cómo explotar robots de venta sin cerebro con una estrategia de alta frecuencia en 80 líneas de código
- Cuantificación FMZ: Desarrollo de casos de diseño de necesidades comunes en el mercado de criptomonedas (II)
- Cómo utilizar una estrategia de alta frecuencia de 80 líneas de código para explotar y vender robots sin cerebro
- FMZ Quant: Análisis de ejemplos de diseño de requisitos comunes en el mercado de criptomonedas (I)
- Cuantificación FMZ: Desarrollo de casos de diseño de necesidades comunes en el mercado de criptomonedas (1)