Implementación del lenguaje JavaScript de los indicadores de Fisher y dibujo en FMZ
El autor:- ¿ Por qué?, Creado: 2022-11-07 11:37:48, Actualizado: 2023-09-15 21:05:55
Durante el análisis técnico de la negociación, los operadores analizan y estudian los datos del precio de las acciones como los datos de la distribución normal. Sin embargo, la distribución de los datos del precio de las acciones no se ajusta a la distribución normal estándar.Fisher Transformationes un método que puede transformar los datos de precios en una distribución normal.Fisher TransformationLas señales de negociación pueden enviarse utilizando los indicadores del día actual y del día anterior.
Hay muchos contenidos sobre elFisher TransformEn Baidu, Zhihu, aquí no lo repetiremos.
Algoritmo del indicador:
-
Precio medio hoy:
mid=(low + high) / 2 -
Calcule el precio más alto y el precio más bajo en el período:
lowestLow = lowest price in the period,highestHigh = highest price in the period. -
Definir el parámetro de cambio de precio (el
ratioes una constante entre 0 y 1, por ejemplo, 0,5 o 0,33):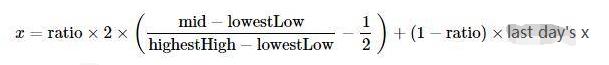
-
Utilizando el
Fishertransformación en el parámetro de cambio de preciox, elFisherse obtiene el indicador: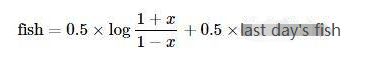
Implementar el algoritmo utilizando el lenguaje JavaScript
Se implementa paso a paso de acuerdo con el algoritmo del indicador.preXypreFish, se establecieron en cero al principio.Math LogEs encontrar el logaritmo basado en la constante natural e. Además, el algoritmo anterior no mencionó la corrección de x, que casi ignoré al escribir:
Corregir el valor de x, forzarlo a ser 0,999 si es mayor que 0,99.
        if (x > 0.99) {
            x = 0.999
        } else if (x < -0.99) {
            x = -0.999
        }
La primera vez que vi el algoritmo y los indicadores, los trasplanté de acuerdo con el algoritmo. No he verificado esta implementación, y algunos que están interesados en la investigación pueden verificar si hay errores. Muchas gracias por señalar los errores.
Fisher Transformcódigo fuente del algoritmo de indicador:
function getHighest(arr, period) {
    if (arr.length == 0 || arr.length - period < 0) {
        return null
    }
    var beginIndex = arr.length - period
    var ret = arr[beginIndex].High
    for (var i = 0 ; i < arr.length - 1 ; i++) {
        if (arr[i + 1].High > ret) {
            ret = arr[i + 1].High
        }
    }
    return ret
}

function getLowest(arr, period) {
    if (arr.length == 0 || arr.length - period < 0) {
        return null
    }
    var beginIndex = arr.length - period
    var ret = arr[beginIndex].Low
    for (var i = 0 ; i < arr.length - 1 ; i++) {
        if (arr[i + 1].Low < ret) {
            ret = arr[i + 1].Low
        }
    }
    return ret
}

function calcFisher(records, ratio, period) {
    var preFish = 0
    var preX = 0
    var arrFish = []
    // When the length of K-line is not enough to meet the period
    if (records.length < period) {
        for (var i = 0 ; i < records.length ; i++) {
            arrFish.push(0)
        }
        return arrFish
    }

    // traverse the K-line
    for (var i = 0 ; i < records.length ; i++) {
        var fish = 0
        var x = 0
        var bar = records[i]
        var mid = (bar.High + bar.Low) / 2
        // When the current BAR is insufficient in period calculation
        if (i < period - 1) {
            fish = 0
            preFish = 0
            arrFish.push(fish)
            continue
        }

        // Calculate the highest and lowest price in the period
        var bars = []
        for (var j = 0 ; j <= i ; j++) {
            bars.push(records[j])
        }
        var lowestLow = getLowest(bars, period)
        var highestHigh = getHighest(bars, period)

        // price change parameters
        x = ratio * 2 * ((mid - lowestLow) / (highestHigh - lowestLow) - 0.5) + (1 - ratio) * preX
        if (x > 0.99) {
            x = 0.999
        } else if (x < -0.99) {
            x = -0.999
        }
        preX = x
        fish = 0.5 * Math.log((1 + x) / (1 - x)) + 0.5 * preFish
        preFish = fish
        arrFish.push(fish)
    }
    return arrFish
}
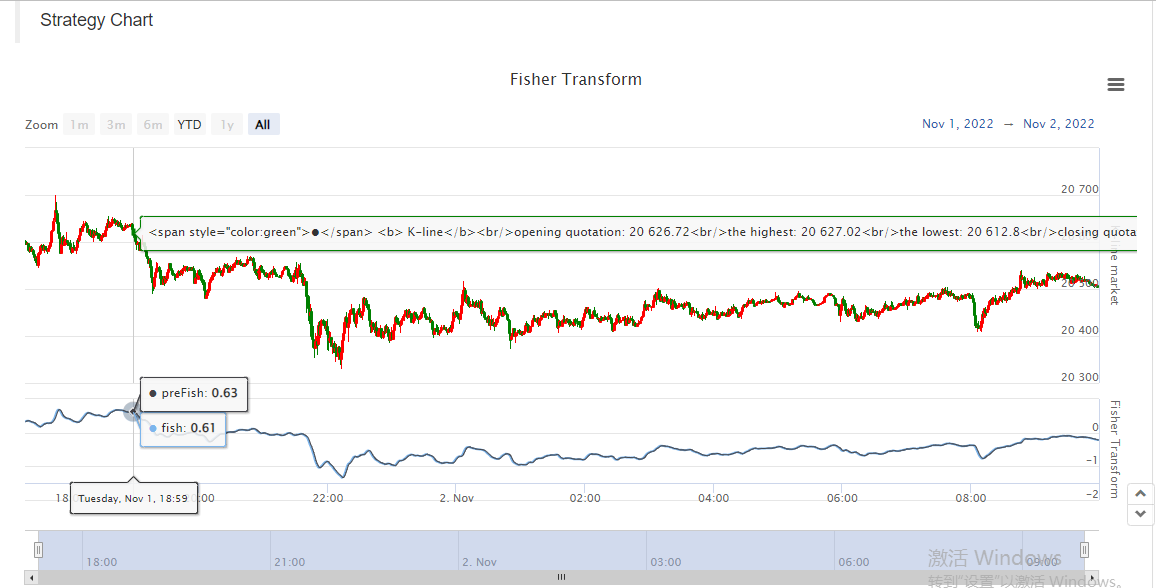
Diagrama de dibujo
Es fácil dibujar en FMZ, Plaza Estratégica:https://www.fmz.com/squaretiene un gran número de ejemplos para su referencia, usted puede buscar en ellos.
var cfg = {    // The object used to initialize chart settings (i.e. chart settings)
    plotOptions: {
        candlestick: {
            color: '#d75442',  // color value
            upColor: '#6ba583' // color value
        }
    },
    title: { text: 'Fisher Transform'},     //title
    subtitle: {text: ''},     //sub-title
    plotOptions: {
        candlestick: {
        tooltip: {
            pointFormat:
            '<span style="color:{point.color}">\u25CF</span> <b> {series.name}</b><br/>' +
            'opening quotation: {point.open}<br/>' +
            'the highest: {point.high}<br/>' +
            'the lowest: {point.low}<br/>' +
            'closing quotation: {point.close}<br/>'
            }
        }
    },
    yAxis: [{
        title: {
            text: 'K-line market'
        },
        height: '70%',
        lineWidth: 1
    }, {
        title: {
            text: 'Fisher Transform'
        },
        top: '75%',
        height: '30%',
        offset: 0,
        lineWidth: 1
    }],
    series: [//series
        {
            type: 'candlestick',
            yAxis: 0,
            name: 'K-line',
            id: 'KLine',
            // Control the candle color with downward trend
            color: 'green',
            lineColor: 'green',
            // Control the candle color with upward trend
            upColor: 'red',
            upLineColor: 'red',
            data: []
        },{
            type: 'line',         // Set the current data series type as line
            yAxis: 1,             // The y-axis used as the y-axis with the index of 0 (a highcharts chart can have multiple y-axes, and the y-axis with the index of 0 is specified here)
            showInLegend: true,   //
            name: 'fish',          // Set it according to the parameter label passed in by the function
            lineWidth: 1,
            data: [],             // Data items of data series
            tooltip: {            // Tooltip
                valueDecimals: 2  // The decimal point of the value is reserved for 5 digits
            }
        },{
            type: 'line',         // Set the current data series type as line
            yAxis: 1,             // The y-axis used as the y-axis with the index of 0 (a highcharts chart can have multiple y-axes, and the y-axis with the index of 0 is specified here)
            showInLegend: true,   //
            name: 'preFish',      // Set it according to the parameter label passed in by the function
            lineWidth: 1,
            data: [],             // Data items of data series
            tooltip: {            // Tooltip
                valueDecimals: 2  // The decimal point of the value is reserved for 5 digits
            }
        }
    ]
}

var chart = Chart(cfg)
function main() {
    var ts = 0
    chart.reset()
    while (true) {
        var r = exchange.GetRecords()
        var fisher = calcFisher(r, 0.33, 10)
        if (!r || !fisher) {
            Sleep(500)
            continue
        }

        for (var i = 0; i < r.length; i++){
            if (ts == r[i].Time) {
                chart.add([0,[r[i].Time, r[i].Open, r[i].High, r[i].Low, r[i].Close], -1])
                chart.add([1,[r[i].Time, fisher[i]], -1])
                if (i - 1 >= 0) {
                    chart.add([2,[r[i].Time, fisher[i - 1]], -1])
                }
            }else if (ts < r[i].Time) {
                chart.add([0,[r[i].Time, r[i].Open, r[i].High, r[i].Low, r[i].Close]])
                chart.add([1,[r[i].Time, fisher[i]]])
                if (i - 1 >= 0) {
                    chart.add([2,[r[i].Time, fisher[i - 1]]])
                }
                ts = r[i].Time
            }
        }
    }
}
Así que es muy conveniente para estudiar los datos, gráfico de visualización y estrategia de diseño en FMZ. Aquí acabamos de demostrar un ejemplo, todos ustedes son bienvenidos a dejar un mensaje.
- Cuantificar el análisis fundamental en el mercado de criptomonedas: ¡Deja que los datos hablen por sí mismos!
- La investigación cuantitativa básica del círculo monetario - ¡No confíes más en los profesores de idiomas, los datos hablan objetivamente!
- Una herramienta esencial en el campo de la transacción cuantitativa - inventor de módulos de exploración de datos cuantitativos
- Dominarlo todo - Introducción a FMZ Nueva versión de la terminal de negociación (con el código fuente de TRB Arbitrage)
- Conozca todo acerca de la nueva versión del terminal de operaciones de FMZ (con código de código de TRB)
- FMZ Quant: Análisis de ejemplos de diseño de requisitos comunes en el mercado de criptomonedas (II)
- Cómo explotar robots de venta sin cerebro con una estrategia de alta frecuencia en 80 líneas de código
- Cuantificación FMZ: Desarrollo de casos de diseño de necesidades comunes en el mercado de criptomonedas (II)
- Cómo utilizar una estrategia de alta frecuencia de 80 líneas de código para explotar y vender robots sin cerebro
- FMZ Quant: Análisis de ejemplos de diseño de requisitos comunes en el mercado de criptomonedas (I)
- Cuantificación FMZ: Desarrollo de casos de diseño de necesidades comunes en el mercado de criptomonedas (1)