La "estrategia mágica de doble EMA" de los veteranos de YouTube
El autor:- ¿ Por qué?, Creado: 2022-11-07 12:02:31, Actualizado: 2023-09-15 20:51:23
La Magic Double EMA Strategy de los Veteranos de YouTube
En este número, vamos a discutir una
Indicadores utilizados por la estrategia
- Indicadores de la EMA
Por el bien de la simplicidad del diseño, no vamos a utilizar el exponencial de promedio móvil que aparece en el video, vamos a utilizar el incorporado ta.ema de la vista de negociación en su lugar (en realidad es lo mismo).
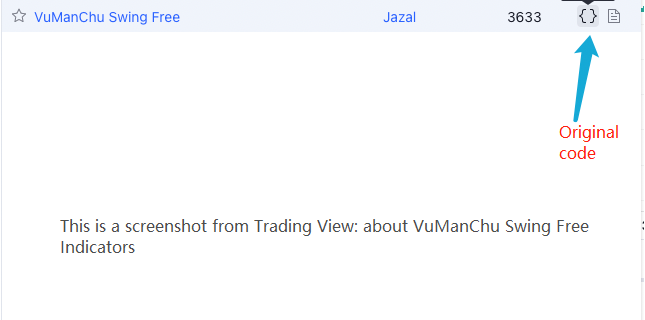
- VuManChu Indicadores de oscilación libre
Este es un indicador en Trading View, tenemos que ir a Trading View y recoger el código fuente.
Código de VuManChu Swing Free:
// This source code is subject to the terms of the Mozilla Public License 2.0 at https://mozilla.org/MPL/2.0/

// Credits to the original Script - Range Filter DonovanWall https://www.tradingview.com/script/lut7sBgG-Range-Filter-DW/
// This version is the old version of the Range Filter with less settings to tinker with

//@version=4
study(title="Range Filter - B&S Signals", shorttitle="RF - B&S Signals", overlay=true)

//-----------------------------------------------------------------------------------------------------------------------------------------------------------------
//Functions
//-----------------------------------------------------------------------------------------------------------------------------------------------------------------

//Range Size Function
rng_size(x, qty, n)=>
//    AC       = Cond_EMA(abs(x - x[1]), 1, n)
    wper      = (n*2) - 1
    avrng     = ema(abs(x - x[1]), n)
    AC = ema(avrng, wper)*qty
    rng_size = AC

//Range Filter Function
rng_filt(x, rng_, n)=>
    r          = rng_
    var rfilt  = array.new_float(2, x)
    array.set(rfilt, 1, array.get(rfilt, 0))
    if x - r > array.get(rfilt, 1)
        array.set(rfilt, 0, x - r)
    if x + r < array.get(rfilt, 1)
        array.set(rfilt, 0, x + r)
    rng_filt1 = array.get(rfilt, 0)

    hi_band   = rng_filt1 + r
    lo_band   = rng_filt1 - r
    rng_filt  = rng_filt1
    [hi_band, lo_band, rng_filt]

//-----------------------------------------------------------------------------------------------------------------------------------------------------------------
//Inputs
//-----------------------------------------------------------------------------------------------------------------------------------------------------------------

//Range Source
rng_src = input(defval=close, type=input.source, title="Swing Source")

//Range Period
rng_per = input(defval=20, minval=1, title="Swing Period")

//Range Size Inputs
rng_qty   = input(defval=3.5, minval=0.0000001, title="Swing Multiplier")

//Bar Colors
use_barcolor = input(defval=false, type=input.bool, title="Bar Colors On/Off")

//-----------------------------------------------------------------------------------------------------------------------------------------------------------------
//Definitions
//-----------------------------------------------------------------------------------------------------------------------------------------------------------------

//Range Filter Values
[h_band, l_band, filt] = rng_filt(rng_src, rng_size(rng_src, rng_qty, rng_per), rng_per)

//Direction Conditions
var fdir = 0.0
fdir    := filt > filt[1] ? 1 : filt < filt[1] ? -1 : fdir
upward   = fdir==1 ? 1 : 0
downward = fdir==-1 ? 1 : 0

//Trading Condition
longCond = rng_src > filt and rng_src > rng_src[1] and upward > 0 or rng_src > filt and rng_src < rng_src[1] and upward > 0
shortCond = rng_src < filt and rng_src < rng_src[1] and downward > 0 or rng_src < filt and rng_src > rng_src[1] and downward > 0

CondIni = 0
CondIni := longCond ? 1 : shortCond ? -1 : CondIni[1]
longCondition = longCond and CondIni[1] == -1
shortCondition = shortCond and CondIni[1] == 1

//Colors
filt_color = upward ? #05ff9b : downward ? #ff0583 : #cccccc
bar_color  = upward and (rng_src > filt) ? (rng_src > rng_src[1] ? #05ff9b : #00b36b) :
             downward and (rng_src < filt) ? (rng_src < rng_src[1] ? #ff0583 : #b8005d) : #cccccc

//-----------------------------------------------------------------------------------------------------------------------------------------------------------------
//Outputs
//-----------------------------------------------------------------------------------------------------------------------------------------------------------------

//Filter Plot
filt_plot = plot(filt, color=filt_color, transp=67, linewidth=3, title="Filter")

//Band Plots
h_band_plot = plot(h_band, color=color.new(#05ff9b, 100), title="High Band")
l_band_plot = plot(l_band, color=color.new(#ff0583, 100), title="Low Band")

//Band Fills
fill(h_band_plot, filt_plot, color=color.new(#00b36b, 92), title="High Band Fill")
fill(l_band_plot, filt_plot, color=color.new(#b8005d, 92), title="Low Band Fill")

//Bar Color
barcolor(use_barcolor ? bar_color : na)

//Plot Buy and Sell Labels
plotshape(longCondition, title = "Buy Signal", text ="BUY", textcolor = color.white, style=shape.labelup, size = size.normal, location=location.belowbar, color = color.new(color.green, 0))
plotshape(shortCondition, title = "Sell Signal", text ="SELL", textcolor = color.white, style=shape.labeldown, size = size.normal, location=location.abovebar, color = color.new(color.red, 0))

//Alerts
alertcondition(longCondition, title="Buy Alert", message = "BUY")
alertcondition(shortCondition, title="Sell Alert", message = "SELL")
Estrategia lógica
El objetivo de los promedios móviles dobles de la EMA es principalmente ayudarnos a determinar la dirección de la tendencia del mercado.
-
acuerdo de posición larga La línea rápida está sobre la línea lenta.
-
acuerdo de posición corta La línea rápida está por debajo de la línea lenta.
VuManChu Swing Free Indicator: El indicador VuManChu Swing Free se utiliza para enviar señales y juzgar si se debe colocar un pedido en combinación con otras condiciones. Se puede ver en el código fuente del indicador VuManChu Swing Free que la variable longCondition representa la señal de compra y la variable shortCondition representa la señal de venta. Estas dos variables se utilizarán para la posterior escritura de las condiciones de colocación del pedido.
Ahora hablemos de las condiciones de activación específicas de la señal de negociación:
-
Reglas para entrar en una posición larga: El precio de cierre de la línea K positiva debe estar por encima de la línea rápida de la EMA, las dos EMA deben ser una posición larga (línea rápida por encima de la línea lenta) y el indicador VuManChu Swing Free debe mostrar una señal de compra (longCondition es verdadera).
-
Reglas para entrar en posición corta (a diferencia de la posición larga): El precio de cierre de la línea K negativa debe estar por debajo de la línea rápida de la EMA, las dos EMA deben ser una posición corta (línea rápida por debajo de la línea lenta) y el indicador VuManChu Swing Free debe mostrar una señal de venta (shortCondition es verdadera).
¿Es la lógica de negociación muy simple? ya que el video de la fuente no especifica el stop de ganancia y stop de pérdida, voy a utilizar un moderado stop de ganancia y stop de pérdida método libremente, utilizando puntos fijos para detener la pérdida, y el seguimiento de la parada de ganancia.
Diseño del código
El código para el indicador VuManChu Swing Free, lo ponemos en nuestro código de estrategia directamente sin ningún cambio.
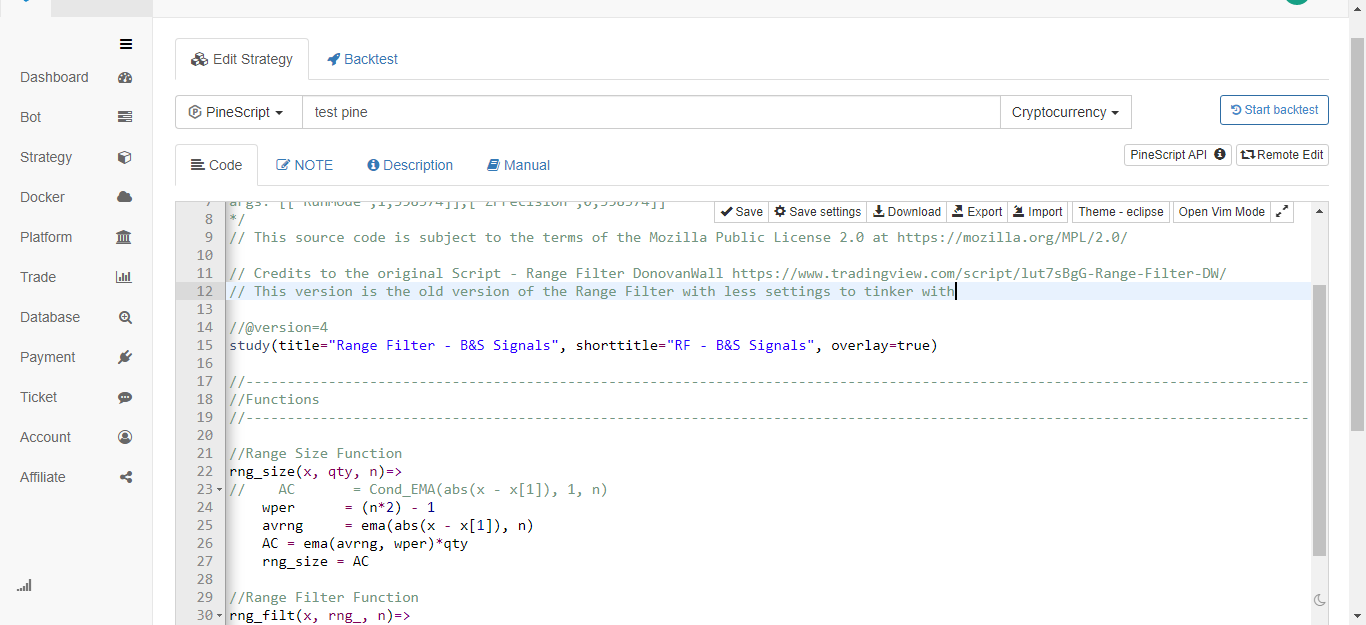
Luego, inmediatamente después, escribimos un código en el lenguaje Pine que implementa la función de negociación:
// extend
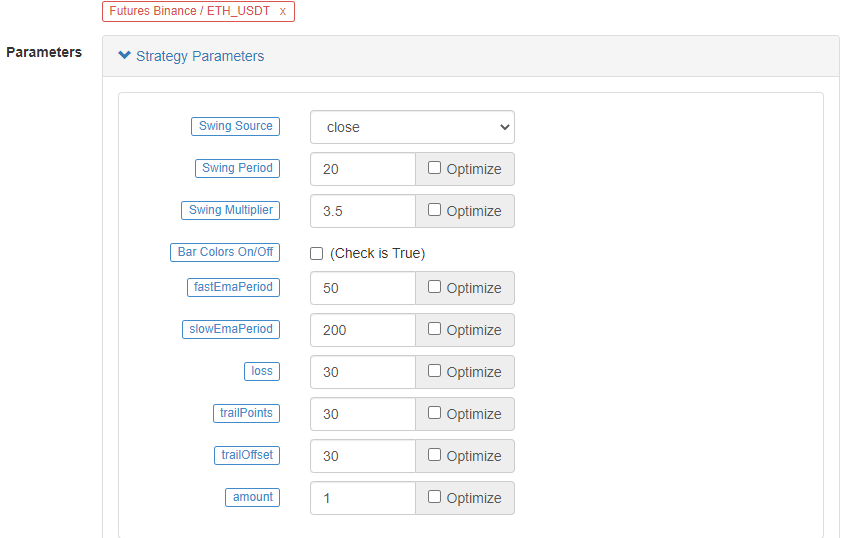
fastEmaPeriod = input(50, "fastEmaPeriod") // fast line period
slowEmaPeriod = input(200, "slowEmaPeriod") // slow line period
loss = input(30, "loss") // stop loss points
trailPoints = input(30, "trailPoints") // number of trigger points for moving stop loss
trailOffset = input(30, "trailOffset") // moving stop profit offset (points)
amount = input(1, "amount") // order amount
emaFast = ta.ema(close, fastEmaPeriod) // calculate the fast line EMA
emaSlow = ta.ema(close, slowEmaPeriod) // calculate the slow line EMA
buyCondition = longCondition and emaFast > emaSlow and close > open and close > emaFast // entry conditions for long positions
sellCondition = shortCondition and emaFast < emaSlow and close < open and close < emaFast // entry conditions for short positions
if buyCondition and strategy.position_size == 0
strategy.entry("long", strategy.long, amount)
strategy.exit("exit_long", "long", amount, loss=loss, trail_points=trailPoints, trail_offset=trailOffset)
if sellCondition and strategy.position_size == 0
strategy.entry("short", strategy.short, amount)
strategy.exit("exit_short", "short", amount, loss=loss, trail_points=trailPoints, trail_offset=trailOffset)
A.Itse puede ver que cuando buyCondition es verdad, es decir:
- Variable longCondition es verdadero (el indicador VuManChu Swing Free envía una señal de posición larga).
- EmaFast > emaSlow (alineación de la posición larga de la EMA).
- cierre > abierto (significa que el BAR actual es positivo), cierre > emaFast (significa que el precio de cierre está por encima de la línea rápida de la EMA).
Las tres condiciones para ir a largo plazo.
B.Cuando la condición de venta es verdadera, las tres condiciones para hacer una posición corta se mantienen (no se repiten aquí).
Luego utilizamos la función strategy.entry para entrar y abrir una posición en el caso de un si condición de juicio de la señal de disparo, y establecer elstrategy.exitFunción para detener pérdidas y rastrear beneficios al mismo tiempo.
Código completo
/*backtest
start: 2022-01-01 00:00:00
end: 2022-10-08 00:00:00
period: 15m
basePeriod: 5m
exchanges: [{"eid":"Futures_Binance","currency":"ETH_USDT"}]
args: [["ZPrecision",0,358374]]
*/

// This source code is subject to the terms of the Mozilla Public License 2.0 at https://mozilla.org/MPL/2.0/

// Credits to the original Script - Range Filter DonovanWall https://www.tradingview.com/script/lut7sBgG-Range-Filter-DW/
// This version is the old version of the Range Filter with less settings to tinker with

//@version=4
study(title="Range Filter - B&S Signals", shorttitle="RF - B&S Signals", overlay=true)

//-----------------------------------------------------------------------------------------------------------------------------------------------------------------
//Functions
//-----------------------------------------------------------------------------------------------------------------------------------------------------------------

//Range Size Function
rng_size(x, qty, n)=>
//    AC       = Cond_EMA(abs(x - x[1]), 1, n)
    wper      = (n*2) - 1
    avrng     = ema(abs(x - x[1]), n)
    AC = ema(avrng, wper)*qty
    rng_size = AC

//Range Filter Function
rng_filt(x, rng_, n)=>
    r          = rng_
    var rfilt  = array.new_float(2, x)
    array.set(rfilt, 1, array.get(rfilt, 0))
    if x - r > array.get(rfilt, 1)
        array.set(rfilt, 0, x - r)
    if x + r < array.get(rfilt, 1)
        array.set(rfilt, 0, x + r)
    rng_filt1 = array.get(rfilt, 0)

    hi_band   = rng_filt1 + r
    lo_band   = rng_filt1 - r
    rng_filt  = rng_filt1
    [hi_band, lo_band, rng_filt]

//-----------------------------------------------------------------------------------------------------------------------------------------------------------------
//Inputs
//-----------------------------------------------------------------------------------------------------------------------------------------------------------------

//Range Source
rng_src = input(defval=close, type=input.source, title="Swing Source")

//Range Period
rng_per = input(defval=20, minval=1, title="Swing Period")

//Range Size Inputs
rng_qty   = input(defval=3.5, minval=0.0000001, title="Swing Multiplier")

//Bar Colors
use_barcolor = input(defval=false, type=input.bool, title="Bar Colors On/Off")

//-----------------------------------------------------------------------------------------------------------------------------------------------------------------
//Definitions
//-----------------------------------------------------------------------------------------------------------------------------------------------------------------

//Range Filter Values
[h_band, l_band, filt] = rng_filt(rng_src, rng_size(rng_src, rng_qty, rng_per), rng_per)

//Direction Conditions
var fdir = 0.0
fdir    := filt > filt[1] ? 1 : filt < filt[1] ? -1 : fdir
upward   = fdir==1 ? 1 : 0
downward = fdir==-1 ? 1 : 0

//Trading Condition
longCond = rng_src > filt and rng_src > rng_src[1] and upward > 0 or rng_src > filt and rng_src < rng_src[1] and upward > 0
shortCond = rng_src < filt and rng_src < rng_src[1] and downward > 0 or rng_src < filt and rng_src > rng_src[1] and downward > 0

CondIni = 0
CondIni := longCond ? 1 : shortCond ? -1 : CondIni[1]
longCondition = longCond and CondIni[1] == -1
shortCondition = shortCond and CondIni[1] == 1

//Colors
filt_color = upward ? #05ff9b : downward ? #ff0583 : #cccccc
bar_color  = upward and (rng_src > filt) ? (rng_src > rng_src[1] ? #05ff9b : #00b36b) :
             downward and (rng_src < filt) ? (rng_src < rng_src[1] ? #ff0583 : #b8005d) : #cccccc

//-----------------------------------------------------------------------------------------------------------------------------------------------------------------
//Outputs
//-----------------------------------------------------------------------------------------------------------------------------------------------------------------

//Filter Plot
filt_plot = plot(filt, color=filt_color, transp=67, linewidth=3, title="Filter")

//Band Plots
h_band_plot = plot(h_band, color=color.new(#05ff9b, 100), title="High Band")
l_band_plot = plot(l_band, color=color.new(#ff0583, 100), title="Low Band")

//Band Fills
fill(h_band_plot, filt_plot, color=color.new(#00b36b, 92), title="High Band Fill")
fill(l_band_plot, filt_plot, color=color.new(#b8005d, 92), title="Low Band Fill")

//Bar Color
barcolor(use_barcolor ? bar_color : na)

//Plot Buy and Sell Labels
plotshape(longCondition, title = "Buy Signal", text ="BUY", textcolor = color.white, style=shape.labelup, size = size.normal, location=location.belowbar, color = color.new(color.green, 0))
plotshape(shortCondition, title = "Sell Signal", text ="SELL", textcolor = color.white, style=shape.labeldown, size = size.normal, location=location.abovebar, color = color.new(color.red, 0))

//Alerts
alertcondition(longCondition, title="Buy Alert", message = "BUY")
alertcondition(shortCondition, title="Sell Alert", message = "SELL")


// extend
fastEmaPeriod = input(50, "fastEmaPeriod")
slowEmaPeriod = input(200, "slowEmaPeriod")
loss = input(30, "loss")
trailPoints = input(30, "trailPoints")
trailOffset = input(30, "trailOffset")
amount = input(1, "amount")

emaFast = ta.ema(close, fastEmaPeriod)
emaSlow = ta.ema(close, slowEmaPeriod)

buyCondition = longCondition and emaFast > emaSlow and close > open and close > emaFast
sellCondition = shortCondition and emaFast < emaSlow and close < open and close < emaFast

if buyCondition and strategy.position_size == 0
    strategy.entry("long", strategy.long, amount)
    strategy.exit("exit_long", "long", amount, loss=loss, trail_points=trailPoints, trail_offset=trailOffset)
if sellCondition and strategy.position_size == 0
    strategy.entry("short", strategy.short, amount)
    strategy.exit("exit_short", "short", amount, loss=loss, trail_points=trailPoints, trail_offset=trailOffset)
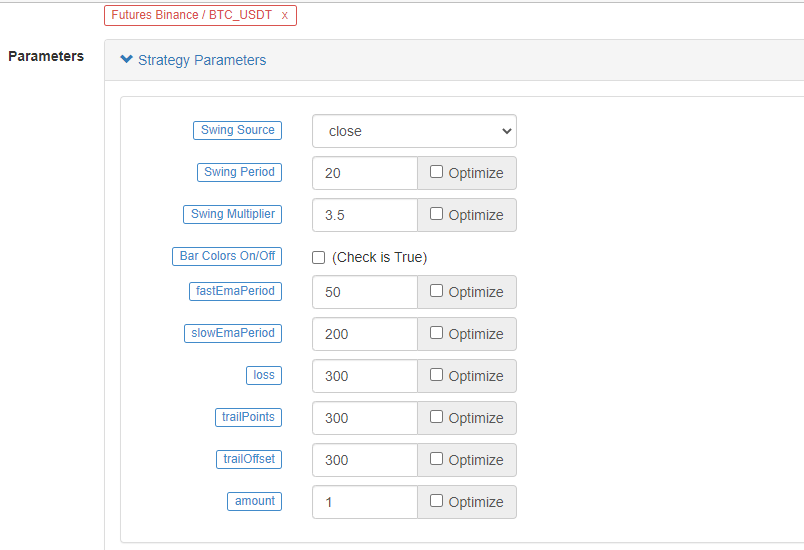
Prueba de retroceso
El rango de tiempo de la prueba de retroceso es de enero de 2022 a octubre de 2022. El período de la línea K es de 15 minutos y el modelo de precio de cierre se utiliza para la prueba de retroceso. El mercado elige el contrato perpetuo Binance ETH_USDT. Los parámetros se establecen de acuerdo con los 50 períodos de línea rápida y 200 períodos de línea lenta en el video de origen. Otros parámetros permanecen sin cambios por defecto. Establezco los puntos de stop loss y seguimiento de stop profit a 30 puntos subjetivamente.
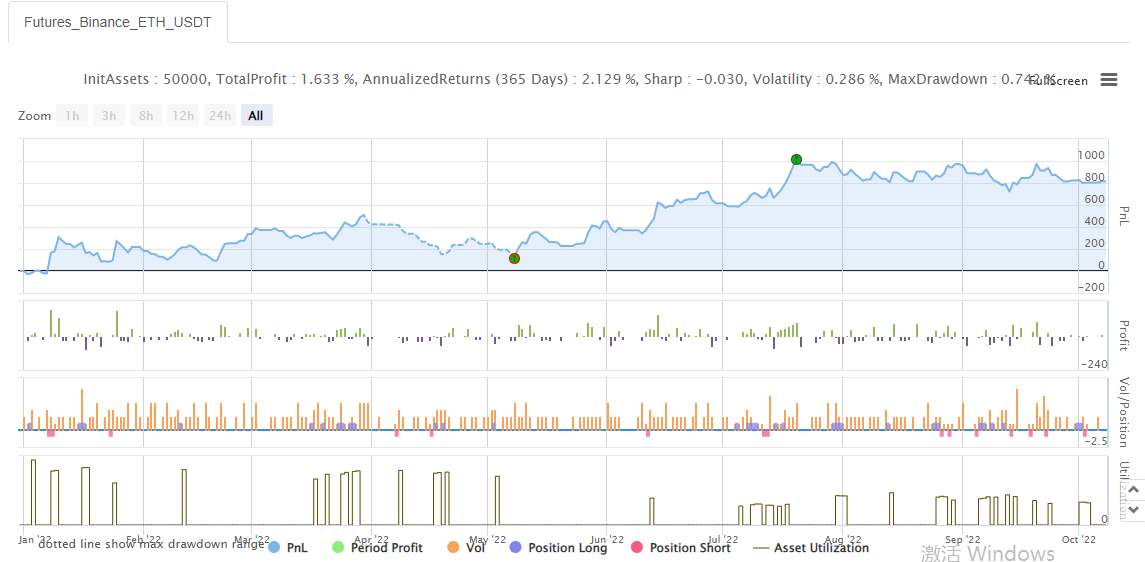
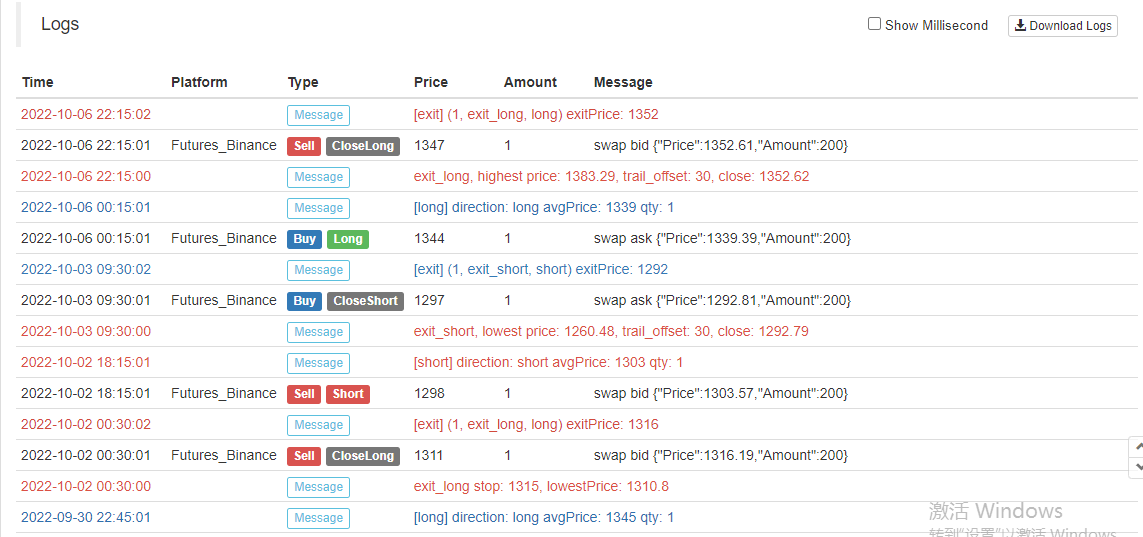
Los resultados de la backtesting son ordinarios, y parece que los parámetros de stop-loss tienen cierta influencia en los resultados de la backtesting.
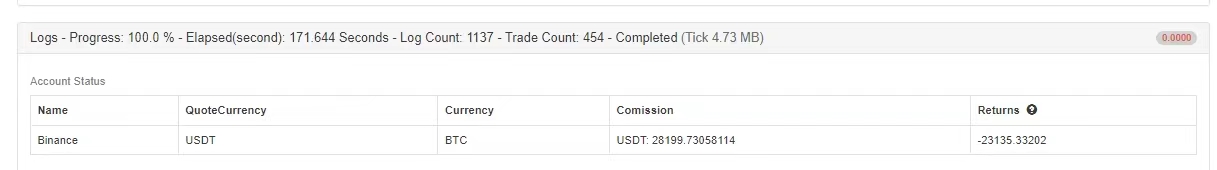
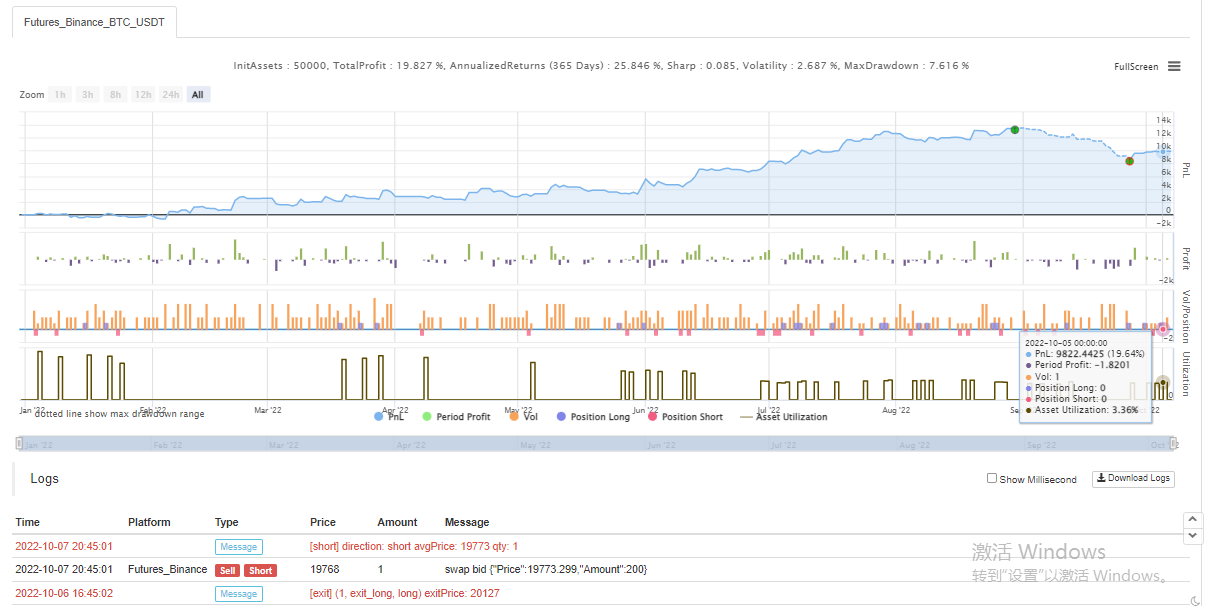
Probemos con otro contrato perpetuo BTC_USDT:
El resultado del backtest en BTC también fue muy rentable:
Estrategia de:https://www.fmz.com/strategy/385745
Parece que este método de negociación es relativamente confiable para comprender la tendencia, puede continuar optimizando el diseño de acuerdo con esta idea. En este artículo, no solo aprendimos sobre la idea de una estrategia de media móvil doble, sino también aprendimos cómo procesar y aprender la estrategia de los veteranos en YouTube. OK, el código de estrategia anterior es solo mi ladrillo y mortero, los resultados de las pruebas de retroceso no representan los resultados específicos del bot real, el código de estrategia, el diseño son solo para referencia. Gracias por su apoyo, nos veremos la próxima vez!
- Cuantificar el análisis fundamental en el mercado de criptomonedas: ¡Deja que los datos hablen por sí mismos!
- La investigación cuantitativa básica del círculo monetario - ¡No confíes más en los profesores de idiomas, los datos hablan objetivamente!
- Una herramienta esencial en el campo de la transacción cuantitativa - inventor de módulos de exploración de datos cuantitativos
- Dominarlo todo - Introducción a FMZ Nueva versión de la terminal de negociación (con el código fuente de TRB Arbitrage)
- Conozca todo acerca de la nueva versión del terminal de operaciones de FMZ (con código de código de TRB)
- FMZ Quant: Análisis de ejemplos de diseño de requisitos comunes en el mercado de criptomonedas (II)
- Cómo explotar robots de venta sin cerebro con una estrategia de alta frecuencia en 80 líneas de código
- Cuantificación FMZ: Desarrollo de casos de diseño de necesidades comunes en el mercado de criptomonedas (II)
- Cómo utilizar una estrategia de alta frecuencia de 80 líneas de código para explotar y vender robots sin cerebro
- FMZ Quant: Análisis de ejemplos de diseño de requisitos comunes en el mercado de criptomonedas (I)
- Cuantificación FMZ: Desarrollo de casos de diseño de necesidades comunes en el mercado de criptomonedas (1)