Estrategia de cruce de MACD

Descripción general
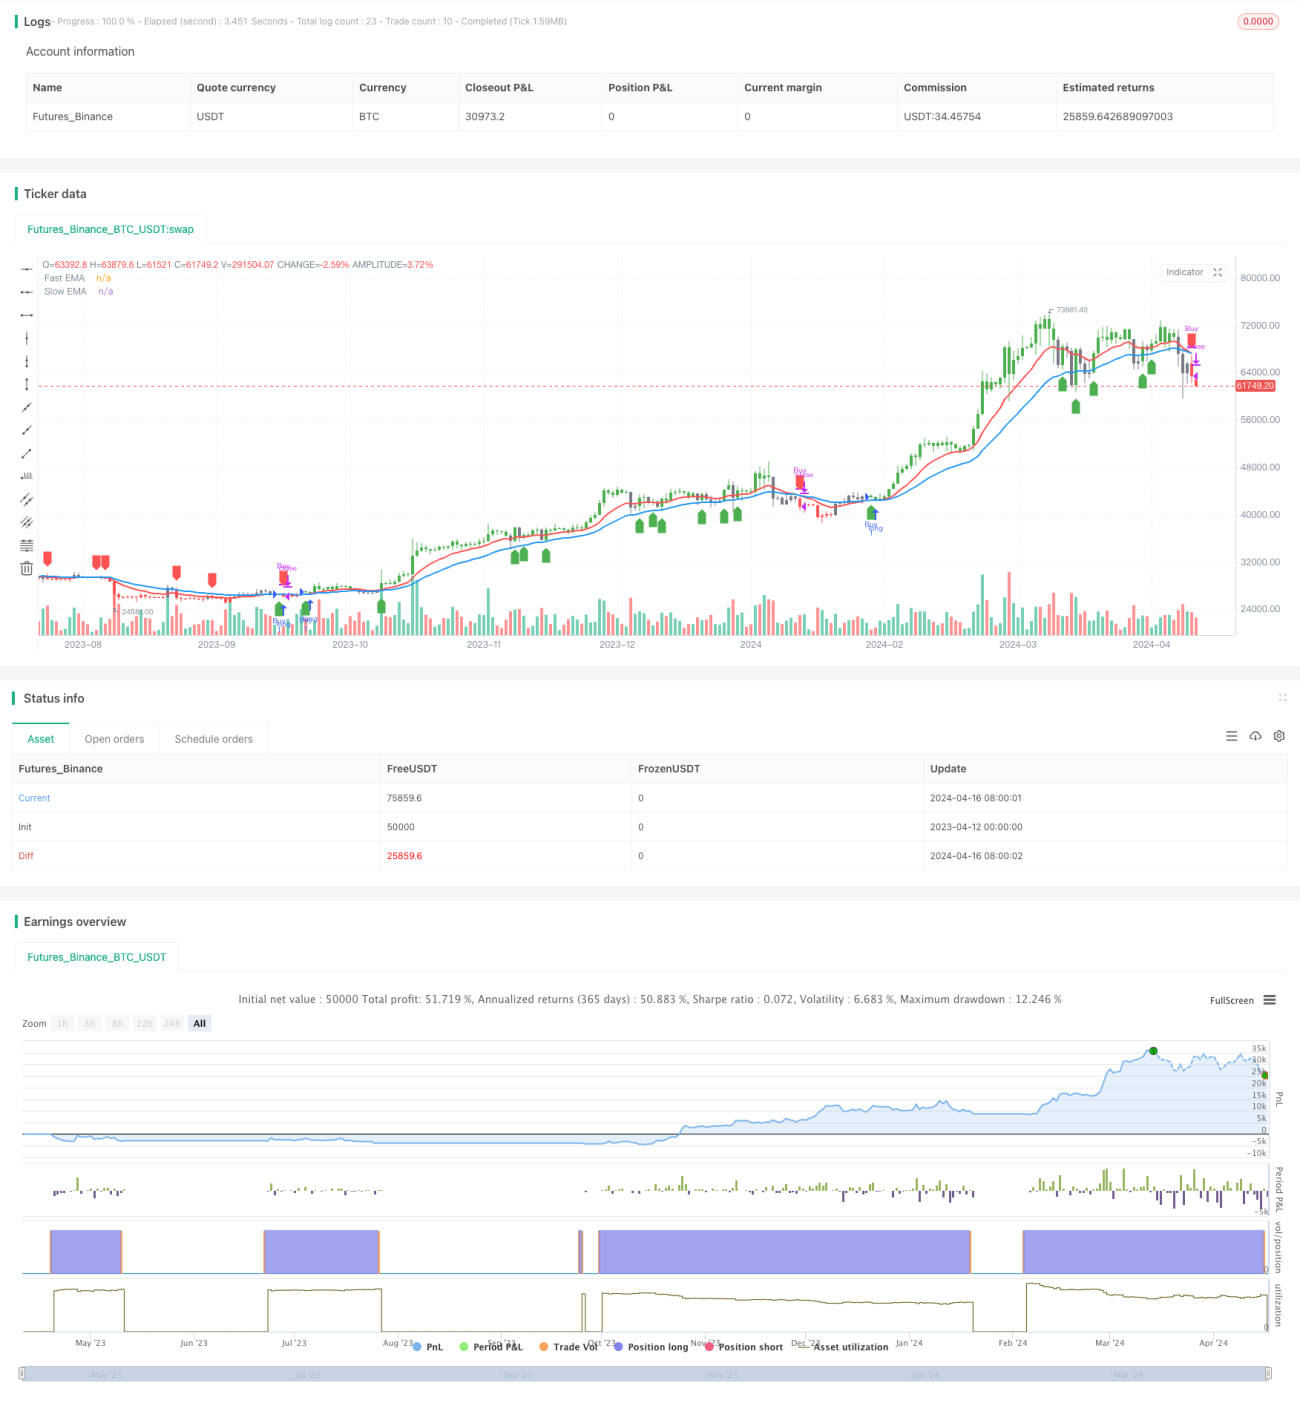
La estrategia se cruza usando dos medias móviles indexadas de diferentes períodos (EMA), generando una señal de compra cuando el EMA rápido cruza el EMA lento de arriba a abajo y una señal de venta cuando el EMA rápido cruza el EMA lento de arriba a abajo. La estrategia puede aplicarse a una variedad de instrumentos financieros y períodos de tiempo, como el oro es más efectivo en el ciclo de 2 horas, el bitcoin es más efectivo en el gráfico de líneas de sol.
Principio de estrategia
- Calcula el EMA rápido (el ciclo predeterminado es 12) y el EMA lento (el ciclo predeterminado es 26).
- Se definen las zonas de múltiples encabezados ((EMA rápido por encima de EMA lento y el precio por encima de EMA rápido) y las zonas de encabezado vacío ((EMA rápido por debajo de EMA lento y el precio por debajo de EMA rápido).
- Comprar cuando se convierte de una zona de cabezas vacías a una zona de cabezas múltiples y vender cuando se convierte de una zona de cabezas múltiples a una zona de cabezas vacías.
- En el gráfico, marque las áreas con más y con menos puntos en verde y rojo, y marque las señales de compra y venta con flechas.
Ventajas estratégicas
- Es fácil de entender y está diseñado para principiantes.
- La aplicación es amplia y puede usarse en una variedad de instrumentos financieros y períodos de tiempo.
- La capacidad de seguimiento de tendencias es alta y permite captar tendencias a medio y largo plazo.
- Los parámetros son ajustables, lo que aumenta la flexibilidad.
Riesgo estratégico
- En un mercado convulso es fácil generar señales erróneas que causan pérdidas.
- La reacción es más lenta cuando hay un cambio de tendencia, lo que puede provocar un deslizamiento.
- La elección incorrecta de los parámetros puede afectar la eficacia de la estrategia.
Dirección de optimización de la estrategia
- Añadir filtros de tendencia, por ejemplo, sólo cuando el ADX es mayor que un valor, para reducir las pérdidas en mercados convulsivos.
- Optimización del tiempo de entrada y salida, como el uso de ATR para decidir la parada de pérdidas y reducir las pérdidas individuales.
- Optimización de los parámetros para encontrar la combinación óptima de parámetros y mejorar la estabilidad y la rentabilidad.
- En combinación con otros indicadores auxiliares, como MACD, RSI, etc., mejora la precisión de la señal.
Resumir
La estrategia de cruce del MACD es una estrategia simple basada en el seguimiento de tendencias, que tiene la ventaja de ser sencilla, práctica y de gran alcance, pero tiene el inconveniente de ser difícil de capturar el giro de la tendencia y la selección de los parámetros. Se puede mejorar el rendimiento de la estrategia mediante el filtrado de tendencias, la optimización de las salidas, la selección de parámetros y la combinación de otros indicadores.
/*backtest
start: 2023-04-12 00:00:00
end: 2024-04-17 00:00:00
period: 1d
basePeriod: 1h
exchanges: [{"eid":"Futures_Binance","currency":"BTC_USDT"}]
*/

//@version=5
strategy('Advance EMA Crossover Strategy', overlay=true, precision=6)
//****************************************************************************//
// CDC Action Zone is based on a simple EMA crossover - 1