Mise en œuvre du langage JavaScript des indicateurs Fisher et dessin sur FMZ
Auteur:Je ne sais pas., Créé: 2022-11-07 11:37:48, Mis à jour: 2023-09-15 21:05:55
Au cours de l'analyse technique du trading, les traders analysent et étudient les données de prix des actions comme les données de la distribution normale.Fisher Transformationest une méthode qui peut transformer les données de prix en distribution normale.Fisher TransformationLes signaux de négociation peuvent être envoyés en utilisant les indicateurs de la journée en cours et de la journée précédente.
Il y a beaucoup de contenu sur leFisher Transformsur Baidu, Zhihu, ici nous ne répéterons pas.
Algoritme de l'indicateur:
-
Le prix moyen aujourd'hui:
mid=(low + high) / 2 -
Jugez la période de calcul, qui peut être de 10 jours.
lowestLow = lowest price in the period,highestHigh = highest price in the period. -
Définir le paramètre de variation de prix (le
ratioest une constante comprise entre 0 et 1, par exemple 0,5 ou 0,33):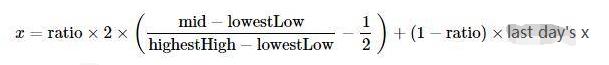
-
En utilisant le
Fishertransformation sur le paramètre de variation de prixx, leFisherl'indicateur est obtenu: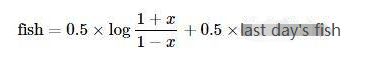
Mettre en œuvre l'algorithme en utilisant le langage JavaScript
Il est mis en œuvre étape par étape selon l'algorithme de l'indicateur.preXetpreFish, ils étaient définis à 0 au début.Math LogEn outre, l'algorithme ci-dessus n'a pas mentionné la correction de x, que j'ai presque ignoré en écrivant:
Corrigez la valeur de x, forcez-la à 0,999 si elle est supérieure à 0,99.
        if (x > 0.99) {
            x = 0.999
        } else if (x < -0.99) {
            x = -0.999
        }
La première fois que j'ai vu l'algorithme et les indicateurs, je les ai transplantés selon l'algorithme. Je n'ai pas vérifié cette mise en œuvre, et certains qui sont intéressés par la recherche peuvent vérifier s'il y a des erreurs. Merci beaucoup de souligner les erreurs.
Fisher Transformcode source de l'algorithme de l'indicateur:
function getHighest(arr, period) {
    if (arr.length == 0 || arr.length - period < 0) {
        return null
    }
    var beginIndex = arr.length - period
    var ret = arr[beginIndex].High
    for (var i = 0 ; i < arr.length - 1 ; i++) {
        if (arr[i + 1].High > ret) {
            ret = arr[i + 1].High
        }
    }
    return ret
}

function getLowest(arr, period) {
    if (arr.length == 0 || arr.length - period < 0) {
        return null
    }
    var beginIndex = arr.length - period
    var ret = arr[beginIndex].Low
    for (var i = 0 ; i < arr.length - 1 ; i++) {
        if (arr[i + 1].Low < ret) {
            ret = arr[i + 1].Low
        }
    }
    return ret
}

function calcFisher(records, ratio, period) {
    var preFish = 0
    var preX = 0
    var arrFish = []
    // When the length of K-line is not enough to meet the period
    if (records.length < period) {
        for (var i = 0 ; i < records.length ; i++) {
            arrFish.push(0)
        }
        return arrFish
    }

    // traverse the K-line
    for (var i = 0 ; i < records.length ; i++) {
        var fish = 0
        var x = 0
        var bar = records[i]
        var mid = (bar.High + bar.Low) / 2
        // When the current BAR is insufficient in period calculation
        if (i < period - 1) {
            fish = 0
            preFish = 0
            arrFish.push(fish)
            continue
        }

        // Calculate the highest and lowest price in the period
        var bars = []
        for (var j = 0 ; j <= i ; j++) {
            bars.push(records[j])
        }
        var lowestLow = getLowest(bars, period)
        var highestHigh = getHighest(bars, period)

        // price change parameters
        x = ratio * 2 * ((mid - lowestLow) / (highestHigh - lowestLow) - 0.5) + (1 - ratio) * preX
        if (x > 0.99) {
            x = 0.999
        } else if (x < -0.99) {
            x = -0.999
        }
        preX = x
        fish = 0.5 * Math.log((1 + x) / (1 - x)) + 0.5 * preFish
        preFish = fish
        arrFish.push(fish)
    }
    return arrFish
}
Graphique de dessin
C'est facile à dessiner sur FMZ, Stratégie Square:https://www.fmz.com/squarea un grand nombre d'exemples pour référence, vous pouvez les rechercher.
var cfg = {    // The object used to initialize chart settings (i.e. chart settings)
    plotOptions: {
        candlestick: {
            color: '#d75442',  // color value
            upColor: '#6ba583' // color value
        }
    },
    title: { text: 'Fisher Transform'},     //title
    subtitle: {text: ''},     //sub-title
    plotOptions: {
        candlestick: {
        tooltip: {
            pointFormat:
            '<span style="color:{point.color}">\u25CF</span> <b> {series.name}</b><br/>' +
            'opening quotation: {point.open}<br/>' +
            'the highest: {point.high}<br/>' +
            'the lowest: {point.low}<br/>' +
            'closing quotation: {point.close}<br/>'
            }
        }
    },
    yAxis: [{
        title: {
            text: 'K-line market'
        },
        height: '70%',
        lineWidth: 1
    }, {
        title: {
            text: 'Fisher Transform'
        },
        top: '75%',
        height: '30%',
        offset: 0,
        lineWidth: 1
    }],
    series: [//series
        {
            type: 'candlestick',
            yAxis: 0,
            name: 'K-line',
            id: 'KLine',
            // Control the candle color with downward trend
            color: 'green',
            lineColor: 'green',
            // Control the candle color with upward trend
            upColor: 'red',
            upLineColor: 'red',
            data: []
        },{
            type: 'line',         // Set the current data series type as line
            yAxis: 1,             // The y-axis used as the y-axis with the index of 0 (a highcharts chart can have multiple y-axes, and the y-axis with the index of 0 is specified here)
            showInLegend: true,   //
            name: 'fish',          // Set it according to the parameter label passed in by the function
            lineWidth: 1,
            data: [],             // Data items of data series
            tooltip: {            // Tooltip
                valueDecimals: 2  // The decimal point of the value is reserved for 5 digits
            }
        },{
            type: 'line',         // Set the current data series type as line
            yAxis: 1,             // The y-axis used as the y-axis with the index of 0 (a highcharts chart can have multiple y-axes, and the y-axis with the index of 0 is specified here)
            showInLegend: true,   //
            name: 'preFish',      // Set it according to the parameter label passed in by the function
            lineWidth: 1,
            data: [],             // Data items of data series
            tooltip: {            // Tooltip
                valueDecimals: 2  // The decimal point of the value is reserved for 5 digits
            }
        }
    ]
}

var chart = Chart(cfg)
function main() {
    var ts = 0
    chart.reset()
    while (true) {
        var r = exchange.GetRecords()
        var fisher = calcFisher(r, 0.33, 10)
        if (!r || !fisher) {
            Sleep(500)
            continue
        }

        for (var i = 0; i < r.length; i++){
            if (ts == r[i].Time) {
                chart.add([0,[r[i].Time, r[i].Open, r[i].High, r[i].Low, r[i].Close], -1])
                chart.add([1,[r[i].Time, fisher[i]], -1])
                if (i - 1 >= 0) {
                    chart.add([2,[r[i].Time, fisher[i - 1]], -1])
                }
            }else if (ts < r[i].Time) {
                chart.add([0,[r[i].Time, r[i].Open, r[i].High, r[i].Low, r[i].Close]])
                chart.add([1,[r[i].Time, fisher[i]]])
                if (i - 1 >= 0) {
                    chart.add([2,[r[i].Time, fisher[i - 1]]])
                }
                ts = r[i].Time
            }
        }
    }
}
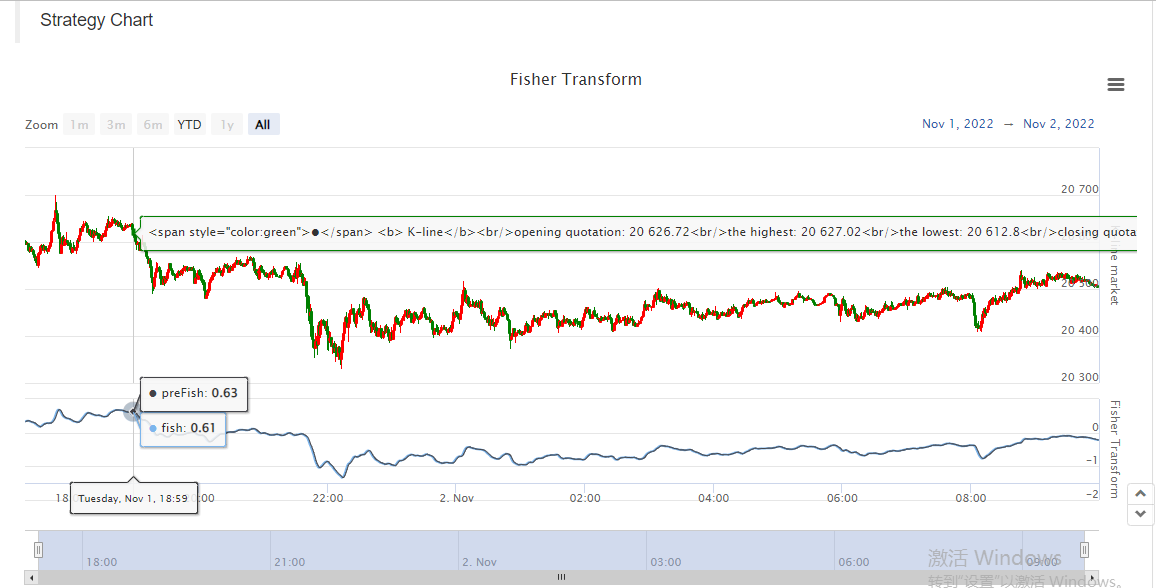
Il est donc très pratique d'étudier les données, le graphique d'affichage et la stratégie de conception sur FMZ. Nous venons de démontrer un exemple, vous êtes tous les bienvenus pour laisser un message.
- Quantifier l'analyse fondamentale sur le marché des crypto-monnaies: laissez les données parler d'elles-mêmes!
- Les fondements de la recherche quantifiée dans le cercle monétaire - ne croyez plus à tous les professeurs de mathématiques, les données sont objectives!
- Un outil indispensable dans le domaine de la quantification des transactions - l'inventeur du module de recherche de données quantifiées
- Maîtriser tout - Introduction à FMZ Nouvelle version du terminal de négociation (avec le code source TRB Arbitrage)
- Tout savoir sur la nouvelle version du terminal de trading FMZ (source code TRB)
- FMZ Quant: Une analyse des exemples de conception des exigences communes sur le marché des crypto-monnaies (II)
- Comment exploiter les robots de vente sans cerveau avec une stratégie de haute fréquence en 80 lignes de code
- Quantification FMZ: analyse de l'exemple de conception des besoins courants sur le marché des crypto-monnaies (II)
- Comment exploiter les robots sans cerveau pour les vendre avec une stratégie de haute fréquence de 80 lignes de code
- FMZ Quant: Une analyse des exemples de conception des exigences communes sur le marché des crypto-monnaies (I)
- Quantification FMZ: analyse de l'exemple de conception des besoins courants sur le marché des crypto-monnaies (1)