Moyenne mobile adaptative de pente
Auteur:ChaoZhang est là., Date: le 31 mai 2022 à 18h07Les étiquettes:L'AMM
- Je ne sais pas.
Ce script est inspiré de
Détection des tendances Couleur verte: Une forte tendance haussière avec une bonne dynamique des prix. Couleur rouge: Une forte tendance à la baisse. Couleur jaune: Il est préférable d'éviter de prendre de nouvelles positions et si le commerce fonctionne, il est bon de continuer.
Par défaut La longueur de l'AMA est de 200 (meilleur pour les délais supérieurs à 1H) La longueur mineure est de 6 La longueur majeure est de 14 La période de pente est fixée à 34 avec 25 de la plage initiale. Alertes Les alertes d'achat/vente suivront lorsque la pente est en dehors de la zone de consolidation/décalage.
test de retour
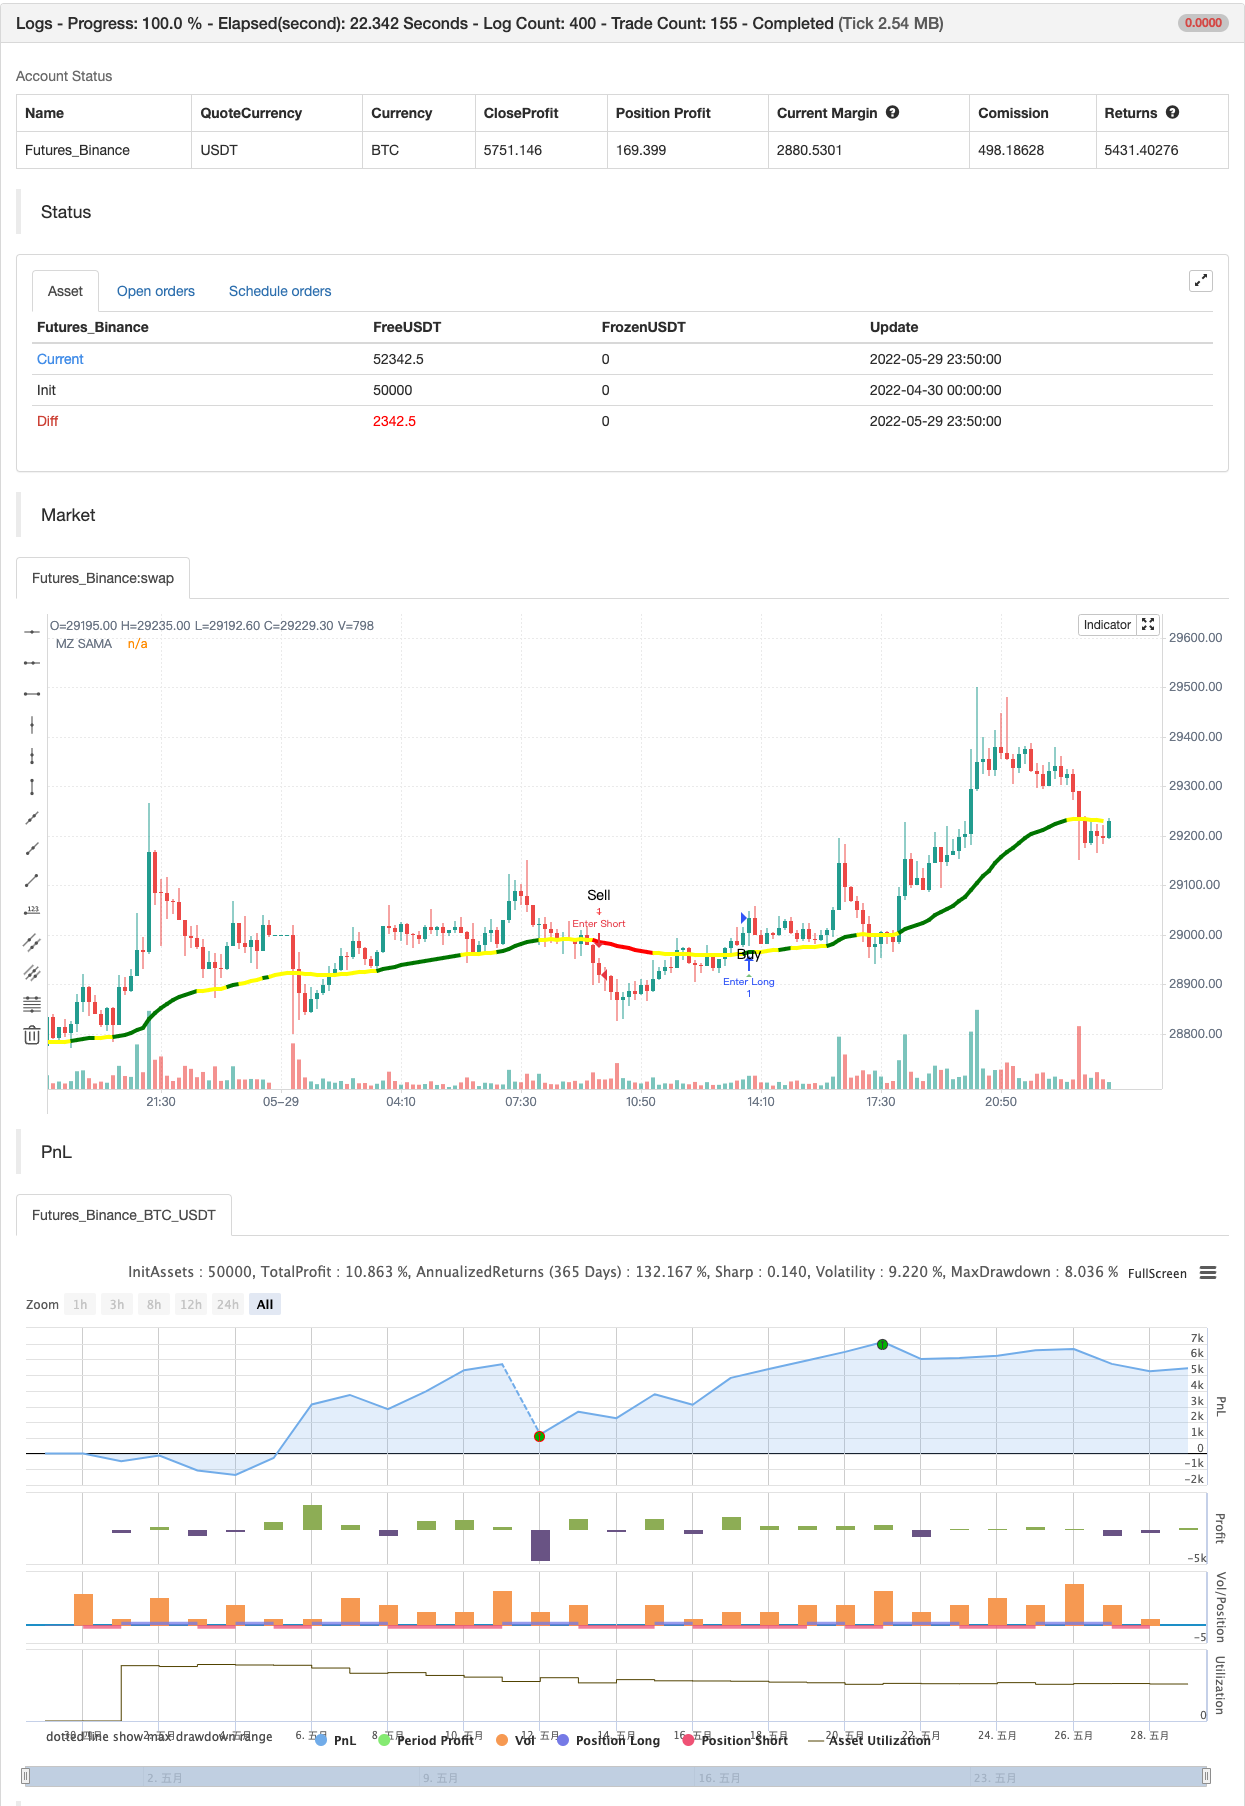
/*backtest
start: 2022-04-30 00:00:00
end: 2022-05-29 23:59:00
period: 10m
basePeriod: 1m
exchanges: [{"eid":"Futures_Binance","currency":"BTC_USDT"}]
*/

// This source code is subject to the terms of the Mozilla Public License 2.0 at https://mozilla.org/MPL/2.0/
// © MightyZinger

//@version=5

indicator('Slope Adaptive Moving Average (MZ SAMA)', shorttitle='MZ SAMA', overlay=true)

/////////////////////////////////////////////////////////////////////
/////////////////////////////////////////////////////////////////////
/////                        MZ SAMA                           //////
/////////////////////////////////////////////////////////////////////
/////////////////////////////////////////////////////////////////////

chartResolution = input.timeframe('', title='Chart Resolution')
src = input.source(close, 'Source')

// Length Inputs
string grp_1 = 'SAMA Length Inputs'
length = input(200, title='Adaptive MA Length', group = grp_1) // To check for Highest and Lowest value within provided period
majLength = input(14, title='Major Length', group = grp_1)     // For Major alpha calculations to detect recent price changes
minLength = input(6, title='Minor Length', group = grp_1)      // For Minor alpha calculations to detect recent price changes

// Slope Inputs
string grp_2 = 'Slope and Dynamic Coloring Parameters'
slopePeriod = input.int(34, title='Slope Period', group = grp_2)
slopeInRange = input.int(25, title='Slope Initial Range', group = grp_2)
flat = input.int(17, title='Consolidation area is when slope below:', group = grp_2)
bull_col = input.color(color.green, 'Bull Color  ', inline='dyn_col', group = grp_2)
bear_col = input.color(color.red, 'Bear Color  ', inline='dyn_col', group = grp_2)
conc_col = input.color(color.yellow, 'Reversal/Consolidation/Choppiness Color  ', inline='dyn_col', group = grp_2)

showSignals = input.bool(true, title='Show Signals on Chart', group='Plot Parameters')

//Slope calculation Function to check trend strength i.e. consolidating, choppy, or near reversal

calcslope(_ma, src, slope_period, range_1) =>
    pi = math.atan(1) * 4
    highestHigh = ta.highest(slope_period)
    lowestLow = ta.lowest(slope_period)
    slope_range = range_1 / (highestHigh - lowestLow) * lowestLow
    dt = (_ma[2] - _ma) / src * slope_range
    c = math.sqrt(1 + dt * dt)
    xAngle = math.round(180 * math.acos(1 / c) / pi)
    maAngle = dt > 0 ? -xAngle : xAngle
    maAngle

//MA coloring function to mark market dynamics

dynColor(_flat, slp, col_1, col_2, col_r) =>
    var col = color.new(na,0)
    // Slope supporting bullish uprtrend color
    col := slp > _flat ? col_1:
    // Slope supporting bearish downtrend color
         slp <= -_flat ? col_2:
    // Reversal/Consolidation/Choppiness color
         slp <= _flat and slp > -_flat ? col_r : col_r
    col

//AMA Calculations

ama(src,length,minLength,majLength)=>
    minAlpha = 2 / (minLength + 1)
    majAlpha = 2 / (majLength + 1)

    hh = ta.highest(length + 1)
    ll = ta.lowest(length + 1)

    mult = hh - ll != 0 ? math.abs(2 * src - ll - hh) / (hh - ll) : 0
    final = mult * (minAlpha - majAlpha) + majAlpha

    final_alpha = math.pow(final, 2) 		// Final Alpha calculated from Minor and Major length along with considering Multiplication factor calculated using Highest / Lowest value within provided AMA overall length
    var _ama = float(na)
    _ama := (src - nz(_ama[1])) * final_alpha + nz(_ama[1])
    _ama

// SAMA Definition
sama = request.security(syminfo.tickerid, chartResolution, ama(src,length,minLength,majLength))

// Slope Calculation for Dynamic Coloring
slope = calcslope(sama, src, slopePeriod, slopeInRange)

// SAMA Dynamic Coloring from slope
sama_col = request.security(syminfo.tickerid, chartResolution, dynColor(flat, slope, bull_col, bear_col, conc_col))

// SAMA Plot
plot(sama, 'MZ SAMA', sama_col, 4)


// BUY & SELL CONDITIONS AND ALERTS
_up = sama_col == bull_col
_downn = sama_col == bear_col
_chop = sama_col == conc_col
buy  = _up and not _up[1]
sell = _downn and not _downn[1]
chop_zone = _chop and not _chop[1]

_signal() =>
    var sig = 0
    if buy and sig <= 0
        sig := 1
    if sell and sig >= 0
        sig := -1
    sig

sig = _signal()

longsignal  = sig ==  1 and (sig !=  1)[1]
shortsignal = sig == -1 and (sig != -1)[1]

// Plotting Signals on Chart
atrOver = 1 * ta.atr(5)   // Atr to place alert shape on chart
plotshape(showSignals and longsignal  ? (sama - atrOver) : na , style=shape.triangleup, color=color.new(color.green, 30), location=location.absolute, text='Buy', size=size.small)
plotshape(showSignals and shortsignal ? (sama + atrOver): na , style=shape.triangledown, color=color.new(color.red, 30), location=location.absolute, text='Sell', size=size.small)

// Signals Alerts
alertcondition(longsignal, "Buy",  "Go Long" )
alertcondition(shortsignal, "Sell", "Go Short")
alertcondition(chop_zone, "Chop Zone", "Possible Reversal/Consolidation/Choppiness")

if longsignal
    alert("Buy at" + str.tostring(close), alert.freq_once_per_bar_close)
if shortsignal
    alert("Sell at" + str.tostring(close), alert.freq_once_per_bar_close)


if longsignal
    strategy.entry("Enter Long", strategy.long)
else if shortsignal
    strategy.entry("Enter Short", strategy.short)
- Boîte Darvas acheter vendre
- Indicateur de configuration de démarrage
- Indice de change stochastique extrême
- Indicateur MACD BB V 1,00
- SAR parabolique
- Indicateur de divergence RSI
- Indicateur OBV MACD
- Tendance de pivot
- Stratégie de divergence des prix v1.0
- Dépassement du support-résistance
- Stratégie de l'oscillateur Delta-RSI
- Stratégie de cryptographie à faible balayage
- [blackcat] L2 stratégie de renversement des étiquettes
- SuperB
- SAR élevé SAR bas
- SuperTREX
- Détecteur de pic
- Détecteur bas
- Tendance de la SMA
- Bas de Bollinger