बोलिंगर बैंड और आरएसआई के संयोजन से अनुकूली ट्रेंड ट्रेडिंग रणनीति

अवलोकन
यह रणनीति एक प्रवृत्ति ट्रैकिंग प्रणाली है जिसमें कई तकनीकी संकेतकों को शामिल किया गया है, तीन क्लासिक संकेतकों के सामंजस्यपूर्ण संयोजन के माध्यम से ब्रिन बैंड, आरएसआई और एमएसीडी, बाजार में उतार-चढ़ाव और प्रवृत्ति परिवर्तन के चरणों में व्यापार के अवसरों को पकड़ने के लिए। यह रणनीति एक पिरामिड-आधारित बढ़त का उपयोग करती है, जो सख्त व्यापार अंतराल नियंत्रण के माध्यम से जोखिम का प्रबंधन करती है।
रणनीति सिद्धांत
इस रणनीति का मूल तर्क तीन संकेतों की पुष्टि पर आधारित हैः
- आरएसआई का उपयोग ओवरबॉट और ओवरसोल्ड क्षेत्रों की पहचान करने के लिए किया जाता है, आरएसआई <45 को ओवरसोल्ड और आरएसआई> 55 को ओवरबॉट माना जाता है
- बुरिन बैंड के माध्यम से मूल्य स्थिति का आकलन करें, जब कीमत बुरिन बैंड के पास या नीचे की ओर जाती है तो सिग्नल उत्पन्न करें
- MACD गोल्ड फॉर्क्स डेड फॉर्क्स को ट्रेंड कन्फर्मेशन के रूप में उपयोग करना, आरएसआई और ब्रिन बैंड सिग्नल के साथ प्रतिध्वनित होने के बाद स्थिति खोलना
इस रणनीति में न्यूनतम व्यापारिक अंतराल (१५ चक्र) की भी व्यवस्था की गई है, जिससे ओवरट्रेडिंग से बचा जा सकता है, और साथ ही साथ पिरामिड-प्रबंधित होल्डिंग का भी उपयोग किया जा सकता है।
रणनीतिक लाभ
- बहु-तकनीकी सूचकांक क्रॉस-सत्यापन, झूठे संकेतों में भारी कमी
- पिरामिड-आधारित जमा प्रणाली ने धन के उपयोग की दक्षता में सुधार किया
- ट्रेडिंग आवृत्ति को प्रभावी ढंग से नियंत्रित करने के लिए न्यूनतम ट्रेडिंग अंतराल सेट करें
- सूचक पैरामीटर समायोज्य है, मजबूत अनुकूलनशीलता है
- जोखिम को नियंत्रित करने के लिए एक स्वचालित समाशोधन तंत्र है
रणनीतिक जोखिम
- एकाधिक संकेतक सिग्नल में देरी का कारण बन सकते हैं
- बाजार में उतार-चढ़ाव के कारण बार-बार लेन-देन हो सकता है
- पिरामिड-आकार की बढ़ोतरी से प्रवृत्ति के उलट जाने पर अधिक नुकसान हो सकता है
- फिक्स्ड आरएसआई थ्रेशोल्ड सभी बाजार स्थितियों के लिए उपयुक्त नहीं हो सकता है
रणनीति अनुकूलन दिशा
- बाजार में उतार-चढ़ाव की गतिशीलता के अनुसार अनुकूलित आरएसआई थ्रेशोल्ड का परिचय
- सहायक पुष्टिकरण के रूप में वॉल्यूम सूचक जोड़ें
- पिरामिड के लिए स्थिति प्रबंधन एल्गोरिदम का अनुकूलन
- अधिक लचीली रोकथाम प्रणाली शामिल करना
- बाजार की चक्रीय विशेषताओं को ध्यान में रखते हुए, गतिशील रूप से ट्रेडिंग अंतराल को समायोजित करना
संक्षेप
यह रणनीति जोखिम को नियंत्रित करते हुए कई तकनीकी संकेतकों के सामंजस्यपूर्ण सहयोग के माध्यम से स्थिर रिटर्न का पीछा करती है। हालांकि कुछ पिछड़ेपन है, उचित पैरामीटर अनुकूलन और जोखिम प्रबंधन तंत्र के माध्यम से रणनीति बेहतर अनुकूलन और स्थिरता का प्रदर्शन करती है। भविष्य में अनुकूलन तंत्र और बेहतर स्थिति प्रबंधन की शुरूआत के माध्यम से रणनीति के प्रदर्शन को और बढ़ाया जा सकता है।
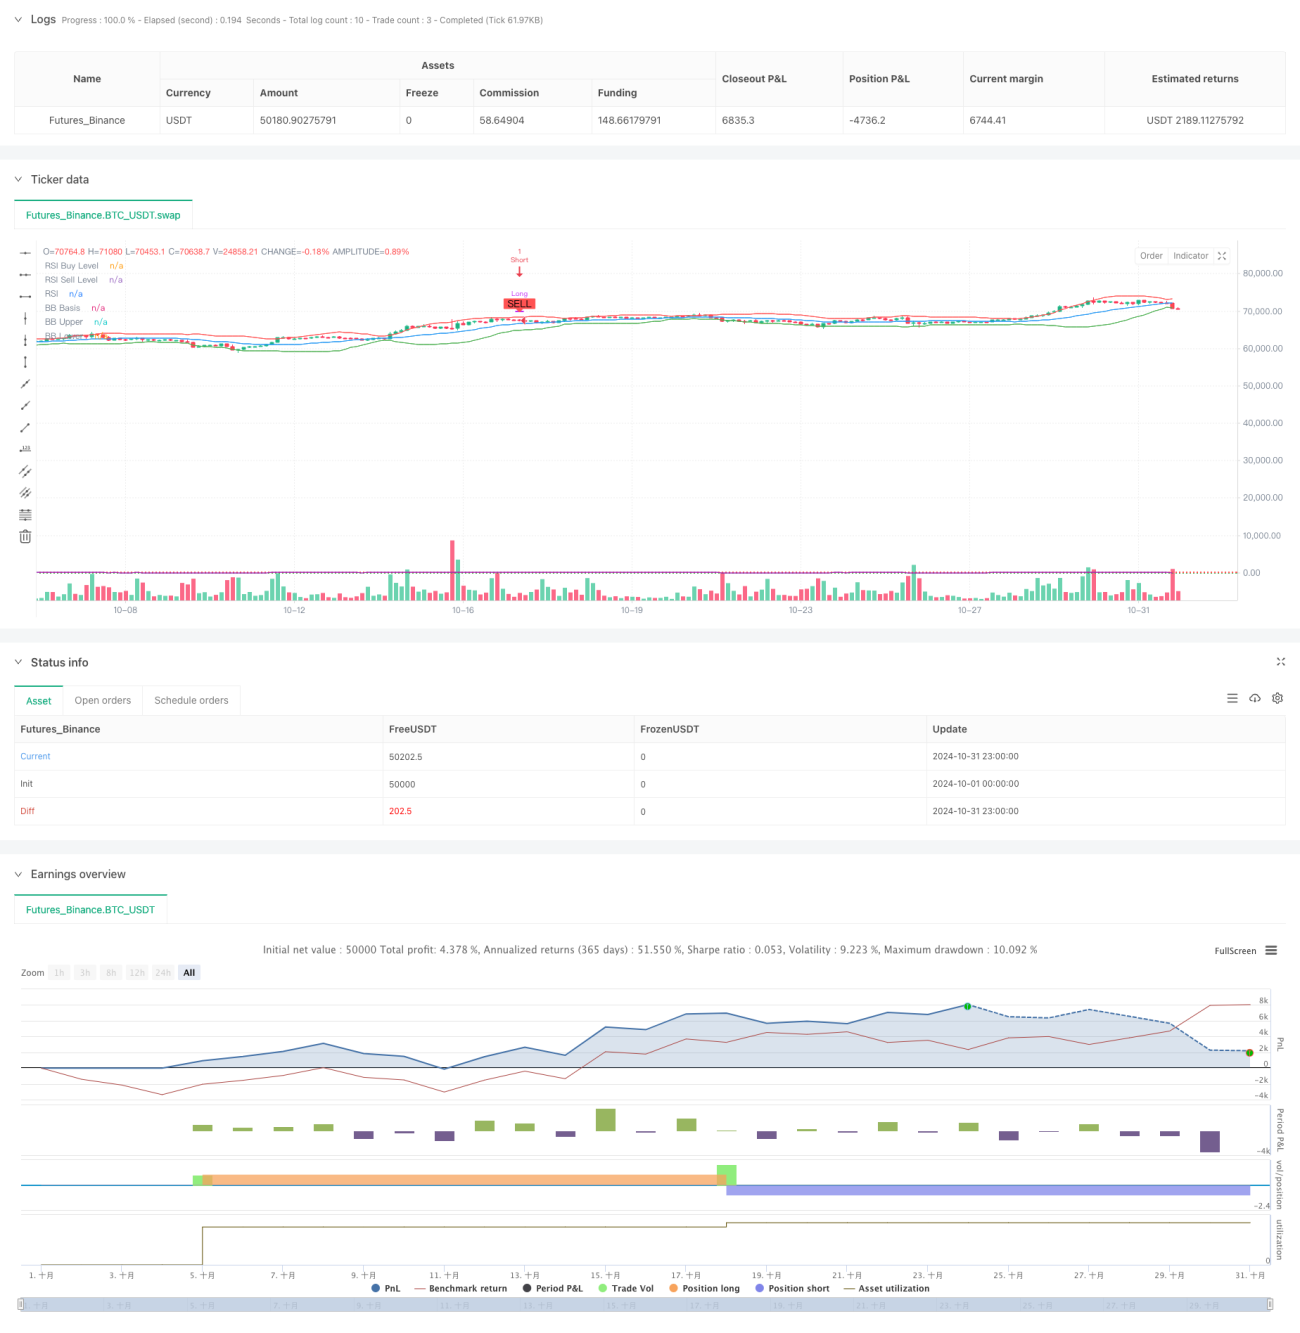
/*backtest
start: 2024-10-01 00:00:00
end: 2024-10-31 23:59:59
period: 3h
basePeriod: 3h
exchanges: [{"eid":"Futures_Binance","currency":"BTC_USDT"}]
*/

//@version=5
strategy("[ETH] Optimized Trend Strategy", shorttitle="Lorenzo-SuperScalping", overlay=true, pyramiding=3, initial_capital=100000, currency=currency.USD)

// === Input Parameters === //- 1