जोखिम प्रबंधन मॉडल के साथ संयुक्त MACD-RSI प्रवृत्ति गति क्रॉसओवर रणनीति

अवलोकन
यह रणनीति एक ट्रेंड ट्रैकिंग ट्रेडिंग सिस्टम है जिसमें MACD ((मूविंग एवरेज कोविजेंड स्प्रैड) और RSI ((रिलेटिवली स्ट्रॉन्ग इंडिकेटर) शामिल हैं। यह रणनीति 5 मिनट के समय चक्र पर चलती है और ट्रेडिंग सिग्नल उत्पन्न करने के लिए MACD और सिग्नल लाइन के क्रॉसिंग और RSI के ओवरबॉय ओवरसोल्ड स्तर का विश्लेषण करती है। साथ ही प्रतिशत-आधारित स्टॉप और रिटर्न-क्लोजिंग तंत्र को जोखिम प्रबंधन के लिए एकीकृत किया गया है।
रणनीति सिद्धांत
यह रणनीति मुख्य रूप से निम्नलिखित मूल तर्क पर आधारित हैः
- 12-26-9 पैरामीटर सेटिंग का उपयोग करके MACD संकेतक मूल्य रुझानों को पकड़ने के लिए
- 14 चक्रों के आरएसआई सूचकांक का उपयोग करके ओवरबॉट और ओवरसोल्ड की पहचान करना
- जब MACD लाइन पर सिग्नल लाइन को पार करता है और RSI 45 से कम है, तो मल्टी सिग्नल ट्रिगर करें
- जब MACD ऑफ़लाइन सिग्नल लाइन को पार करता है और आरएसआई 55 से अधिक होता है, तो एक समतल सिग्नल ट्रिगर करें
- जोखिम को नियंत्रित करने के लिए 1.2% स्टॉप लॉस सेट करें, लाभ को लॉक करने के लिए 2.4% स्टॉप लॉस सेट करें
- 10 चक्र ईएमए का उपयोग एक प्रवृत्ति फ़िल्टर के रूप में, सिग्नल की गुणवत्ता में सुधार
रणनीतिक लाभ
- सूचकांक पोर्टफोलियो का लाभः MACD ट्रेंड ट्रैकिंग और RSI उतार-चढ़ाव की विशेषताओं के संयोजन के साथ, बाजार के मोड़ को अधिक सटीक रूप से पकड़ने में सक्षम है
- जोखिम नियंत्रण में सुधारः एक निश्चित अनुपात स्टॉप लॉस स्टॉप का उपयोग करना, एकल लेनदेन जोखिम पर सख्त नियंत्रण
- सिग्नल पुष्टिकरण तंत्रः एक साथ MACD और RSI शर्तों को पूरा करने के लिए स्थिति खोलने के लिए, झूठे संकेतों को कम करना
- अनुकूलनशीलता: विभिन्न बाजार स्थितियों के लिए पैरामीटर को समायोजित किया जा सकता है
- निष्पादन तर्क स्पष्टताः लेनदेन के नियम स्पष्ट हैं और इसे स्वचालित करना आसान है
रणनीतिक जोखिम
- अस्थिर बाजार जोखिमः अस्थिर बाज़ारों में लगातार ट्रेडिंग से नुकसान हो सकता है
- स्लाइडिंग जोखिमः 5 मिनट की अवधि में व्यापार अक्सर होता है और बड़े स्लाइडिंग जोखिम हो सकते हैं
- झूठी दरार का खतराः MACD क्रॉस सिग्नल में झूठी दरार का खतरा
- पैरामीटर संवेदनशीलताः सूचक पैरामीटर सेटिंग्स रणनीति के प्रदर्शन पर अधिक प्रभाव डालती हैं
- बाजार परिवेश पर निर्भरता: रणनीतियाँ प्रवृत्ति स्पष्ट बाजारों में बेहतर प्रदर्शन करती हैं
रणनीति अनुकूलन दिशा
- ट्रांसमिशन फ़िल्टर जोड़ा गयाः सिग्नल जनरेशन में ट्रांसमिशन कारक को ध्यान में रखते हुए, सिग्नल विश्वसनीयता में सुधार
- गतिशील स्टॉप-लॉस सेटिंग्सः स्टॉप-लॉस अनुपात को बाजार में उतार-चढ़ाव के आधार पर समायोजित करें
- प्रवृत्ति शक्ति फ़िल्टर को शामिल करनाः ADX जैसे प्रवृत्ति शक्ति संकेतकों को जोड़ना, व्यापार समय को अनुकूलित करना
- स्थिति प्रबंधन में सुधारः अस्थिरता-आधारित गतिशील स्थिति नियंत्रण
- अनुकूलन पैरामीटर अनुकूलनः पैरामीटर गतिशील अनुकूलन तंत्र विकसित करें, रणनीति अनुकूलन में सुधार करें
संक्षेप
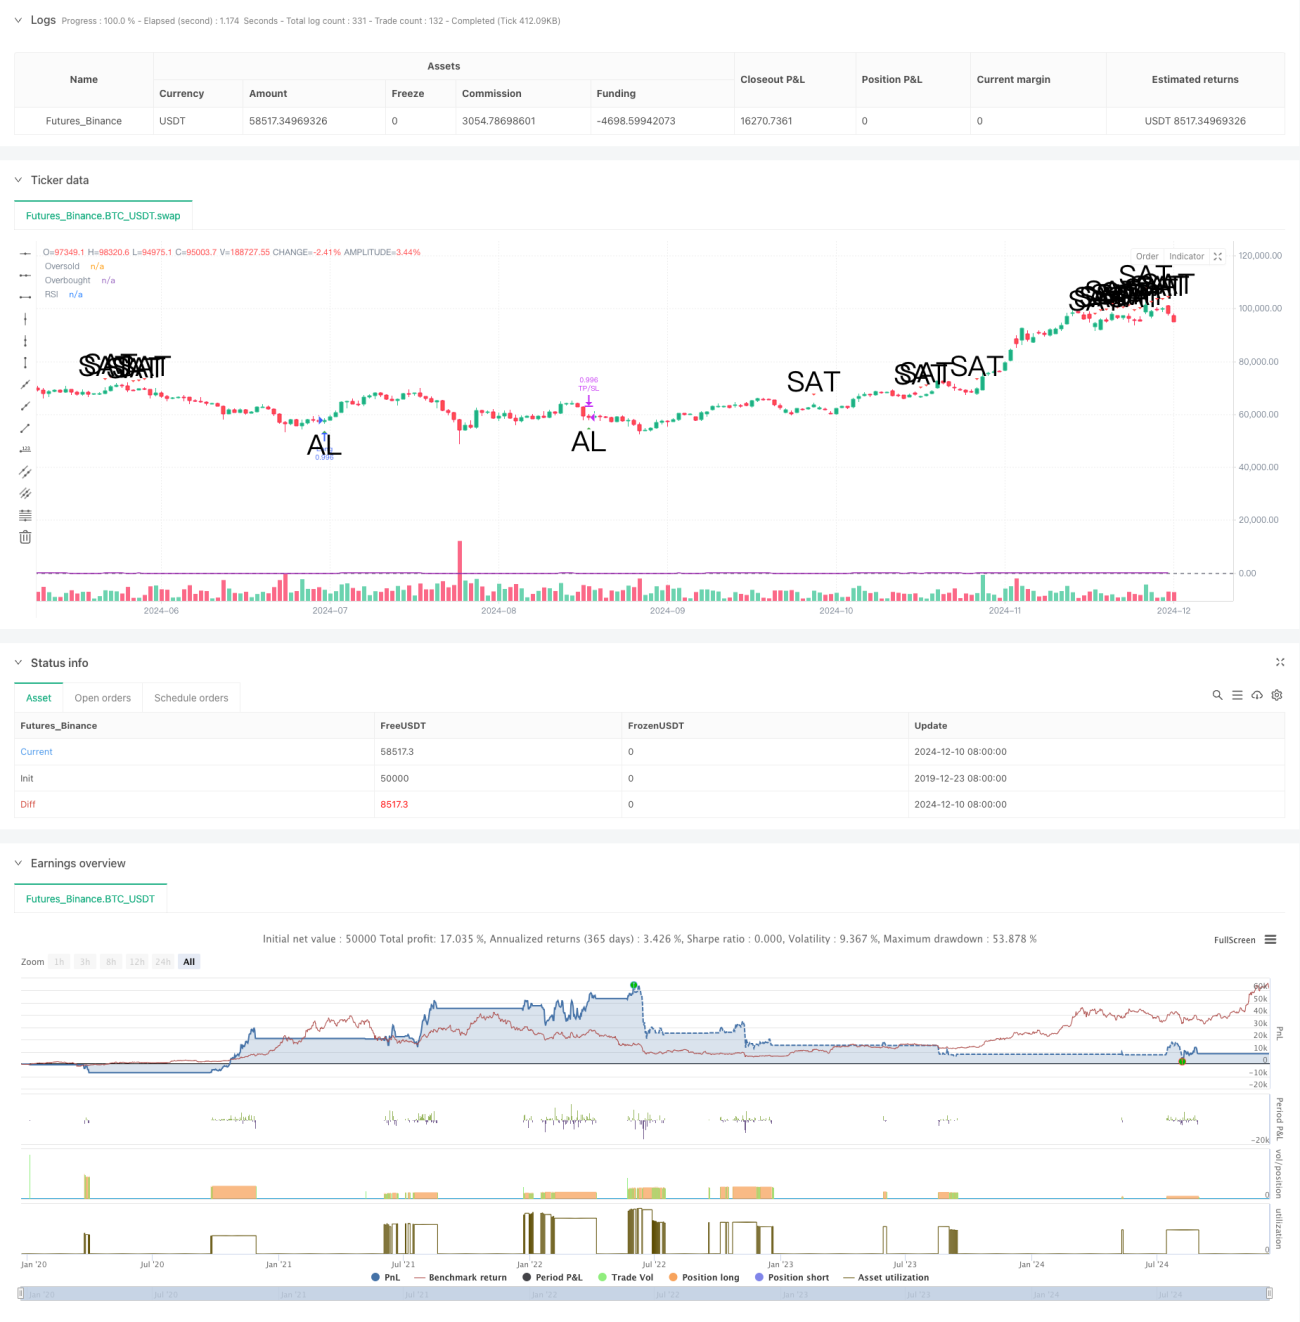
इस रणनीति में MACD और RSI के लाभों को मिलाकर एक ट्रेडिंग सिस्टम का निर्माण किया गया है जिसमें ट्रेंड ट्रैकिंग और गतिशीलता दोनों विशेषताएं हैं। एक अच्छी तरह से विकसित जोखिम नियंत्रण तंत्र और एक स्पष्ट ट्रेडिंग तर्क इसे अच्छी व्यावहारिकता देता है। अनुशंसित अनुकूलन दिशा के माध्यम से, रणनीति में और सुधार करने के लिए जगह है। जब इसे वास्तविक दुनिया में लागू किया जाता है, तो यह अनुशंसा की जाती है कि पहले पर्याप्त प्रतिक्रिया परीक्षण किया जाए और पैरामीटर को विशिष्ट बाजार विशेषताओं के अनुसार उचित रूप से समायोजित किया जाए।
/*backtest
start: 2019-12-23 08:00:00
end: 2024-12-11 08:00:00
period: 1d
basePeriod: 1d
exchanges: [{"eid":"Futures_Binance","currency":"BTC_USDT"}]
*/

// This source code is subject to the terms of the Mozilla Public License 2.0 at https://mozilla.org/MPL/2.0/
//@version=5
strategy("MACD + RSI Basit Strateji", overlay=true, initial_capital=1000, default_qty_type=strategy.percent_of_equity, default_qty_value=100)
- 1