Gunakan fungsi KLineChart untuk membuat desain strategi gambar lebih mudah
Penulis:Mimpi kecil, Dibuat: 2022-07-05 15:13:55, Diperbarui: 2023-09-25 19:49:32
Gunakan fungsi KLineChart untuk membuat desain strategi gambar lebih mudah
Ketika merancang strategi, seringkali perlu merancang grafik strategi untuk ditampilkan, ketika menulis strategi dalam bahasa JavaScript, bahasa Python, pengguna yang tidak akrab dengan pemrograman atau perpustakaan grafik yang digunakan dalam platform FMZ sering berjuang dengan desain kode untuk menggambar grafik kustom. Jadi bagaimana Anda dapat menggambar grafik strategi dengan konten yang kaya hanya dengan sejumlah kecil kode?
Cara menggambar yang sederhana dan kuat ini dapat dilihat dalam bahasa Pine, yang dikenal karena fungsi menggambarnya yang kaya. Jika antarmuka gambar bahasa Pine dapat dihubungkan dengan strategi bahasa JavaScript dan Python, itu akan sangat memfasilitasi fungsi menggambar dari strategi desain pengembang. Oleh karena itu, berdasarkan permintaan ini, platform FMZ telah meningkatkan fungsi menggambar kustom dan memperluas cara menggunakan aplikasi ini.KLineChartAnda dapat melihat dokumentasi API di:https://www.fmz.com/api#klinechart
Mari kita mulai dengan menulis contoh sederhana menggunakan bahasa JavaScript untuk transisi.
Contoh sederhana
/*backtest
start: 2022-03-21 09:00:00
end: 2022-06-21 15:00:00
period: 30m
basePeriod: 15m
exchanges: [{"eid":"Binance","currency":"BTC_USDT"}]
*/

function main() {
    var c = KLineChart()
    while (true) {
        var bars = _C(exchange.GetRecords)
        for (var i = 0 ; i < bars.length ; i++) {
            var bar = bars[i]
            c.begin(bar)
            c.plot(bar.Volume, "Close")
            c.close()
        }
        Sleep(1000)
    }
}
Contoh ini sangat sederhana, hanya menggambar grafik K-line di area gambar khusus strategi, dan menggambar kurva volume yang sesuai dengan setiap K-line BAR di posisi sub-chart dari grafik.
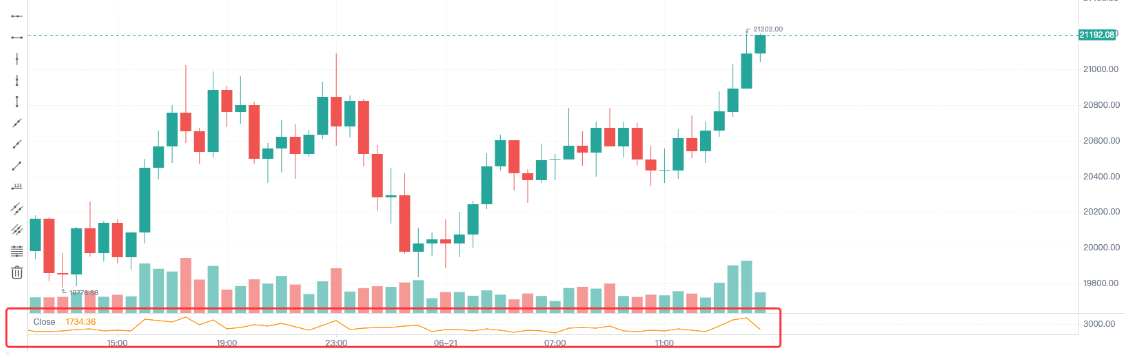
Dalam kode, kita menggunakanvar c = KLineChart()untuk membuat objek grafik pertama, dan kemudian menggunakan metode untuk menggambar grafik. Kemudian dalam loop, kita mendapatkan data K-line (struktur array), dan melintasi array K-line.
Operasi menggambar dimulai denganc.begin(bar)fungsi dan berakhir denganc.close()Fungsi.begindanclosefungsi adalah semua metode objek grafik c. Selanjutnya, gunakan fungsi gambar yang paling umum digunakanplotuntuk menggambar kurva volume pada setiap BAR.
Contoh yang lebih kompleks
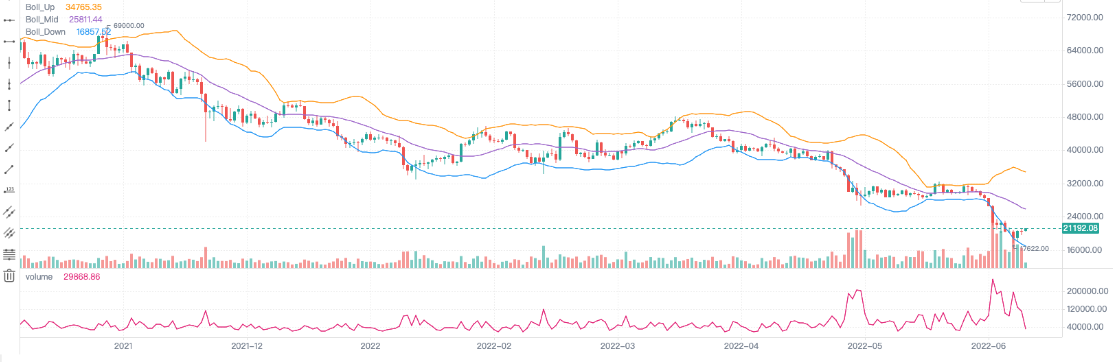
Misalkan kita ingin mendesain grafik dengan indikator Bollinger yang terpasang. dan juga dilengkapi dengan grafik volume dari setiap BAR, yang dapat dirancang seperti ini:
/*backtest
start: 2022-03-21 09:00:00
end: 2022-06-21 15:00:00
period: 1d
basePeriod: 1h
exchanges: [{"eid":"Binance","currency":"BTC_USDT"}]
*/

function main() {
    var c = KLineChart()

    // main strategy loop
    while(true) {
        // polling interval
        Sleep(500)

        // get K-line data
        let bars = exchange.GetRecords()
        if (!bars || bars.length <= 20) {
            continue
        }

        // calculate the Bollinger indicator
        var boll = TA.BOLL(bars)

        bars.forEach(function(bar, index) {
            c.begin(bar)
            // drawing operation
            c.plot(boll[0][index], "Boll_Up", {overlay: true})     // Draw on the main chart
            c.plot(boll[1][index], "Boll_Mid", {overlay: true})    // Draw on the main chart
            c.plot(boll[2][index], "Boll_Down", {overlay: true})   // Draw on the main chart
            c.plot(bar.Volume, "volume")                           // Draw on the sub-chart
            c.close()
        })

        // Strategy trading logic
        // ...
        // ..
    }
}
Seperti yang kita lihat dalam kode, informasi konfigurasi backtest kami pada platform FMZ adalah:
/*backtest
start: 2022-03-21 09:00:00
end: 2022-06-21 15:00:00
period: 1d
basePeriod: 1h
exchanges: [{"eid":"Binance","currency":"BTC_USDT"}]
*/
Konfigurasi tersebut adalah menggunakan uji backtesting objek pertukaran Binance spot.
Bisa dilihat bahwa kita menggunakan metode gambar Pine
Menulis dalam indikator dan data lain untuk menggambar grafik
Operasi untuk mendapatkan data K-line dan menghitung indikator umum dan sederhana dalam contoh strategi di Platform Strategy Square dan dalam dokumentasi API.
        // obtain K-line data
        let bars = exchange.GetRecords()
        if (!bars || bars.length <= 20) {
            // If the acquisition of the K line fails, that is, if !bar is true, execute continue, ignore the following code, and re-execute the loop
            // If bars.length is less than or equal to 20, that is, the number of K-line BAR (bar) is less than 20, the indicator cannot be calculated, and continue is also executed
            continue
        }

        // Calculate the Bollinger indicator
        var boll = TA.BOLL(bars)
Fungsi perhitungan indikator Bollinger TA.BOLL, jika parameter indikator Bollinger tidak ditentukan, parameter defaultBOLL(20, 2)Indikator Bollinger memiliki tiga baris, sehingga data yang dikembalikan oleh fungsi TA.BOLL adalah array dua dimensi. boll[0], boll[1], dan boll[2] adalah tiga elemen dari array boll, yang masing-masing mewakili garis dan merupakan array.
- boll[0]: Bollinger Bands line up
- boll[1]: Bollinger Bands midline
- boll[2]: Bollinger Bands garis bawah
Kemudian kita akan melihat bagaimana menggambar volume data K-line, yaitu volume, dan data indikator Bollinger yang dihitung pada grafik.
Kita menggambar data garis K Bar oleh Bar, jadi kita perlu melintasi seluruh array garis K, yaitu, melintasi array batang dalam kode.forEachmetode digunakan di sini untuk melintasi, atau loop for dapat digunakan untuk melintasi.
        bars.forEach(function(bar, index) {
            c.begin(bar)
            // Drawing operations
            c.plot(boll[0][index], "Boll_Up", {overlay: true})     // {overlay: true} Parameter control, drawn on the main chart
            c.plot(boll[1][index], "Boll_Mid", {overlay: true})    // Draw on the main chart
            c.plot(boll[2][index], "Boll_Down", {overlay: true})   // Draw on the main chart
            c.plot(bar.Volume, "volume")                           // Draw on the sub-chart
            c.close()
        })
Perlu dicatat bahwa setiap kali Anda memulai operasi menggambar grafik pada Bar, Anda harus membuatc.begin(bar)fungsi panggilan pertama.beginfungsi adalah salah satu dari obyek grafik kita c metode.c.close()harus dipanggil.beginFungsi danclosefungsi adalah fungsi gambar yang kita sebut mirip dengan metode gambar dari bahasa Pine.barcolor bgcolor plot fill hline plotarrow plotshape plotchar plotcandle signal, Anda dapat menggambar garis, panah, tanda informasi, dll. Parameter fungsi ini adalah sama dengan parameter fungsi yang sesuai dengan bahasa Pine, dan fungsi gambar juga sama.
Tambahkan gambar panah sinyal perdagangan, penanda, garis horizontal, dll.
Tambahkan beberapa panah sinyal perdagangan, penanda, garis horizontal ke contoh Bollinger Bands di atas.
/*backtest
start: 2022-03-21 09:00:00
end: 2022-06-21 15:00:00
period: 1d
basePeriod: 1h
exchanges: [{"eid":"Binance","currency":"BTC_USDT"}]
*/

function main() {
    var c = KLineChart({overlay : true})

    // Strategy main loop
    while(true) {
        // Polling interval
        Sleep(500)

        // Obtain K-line data
        let bars = exchange.GetRecords()
        if (!bars || bars.length <= 20) {
            continue
        }

        // Calculate Bollinger indicator
        var boll = TA.BOLL(bars)

        bars.forEach(function(bar, index) {
            c.begin(bar)
            // Drawing operations
            c.plot(boll[0][index], "Boll_Up", {overlay: true})     // Draw on the main chart
            c.plot(boll[1][index], "Boll_Mid", {overlay: true})    // Draw on the main chart
            c.plot(boll[2][index], "Boll_Down", {overlay: true})   // Draw on the main chart
            c.plot(bar.Volume, "volume", {overlay: false})         // Draw on the sub-chart

            c.hline(bar.Open, {overlay: true})                          // Horizontal line
            c.plotarrow(bar.Close - bar.Open, {overlay: true})          // Arrow
            c.plotshape(bar.Close - bar.Open > 0, {style: 'square'})    // Draw square markers
            c.plotchar(bar.Close - bar.Open < 0, {char: 'X'})           // Draw the character X

            c.close()
        })

        // Strategy trading logic
        // ...
        // ..
    }
}

Objek konfigurasi grafik
Struktur dapat dinyatakan untuk mengkonfigurasi gaya grafik. Misalnya, variabel chartCfg berikut mewakili informasi konfigurasi garis grid.
    var chartCfg = {
        grid: {
            show: true,
            // Grid horizontal line
            horizontal: {
                show: true,
                size: 2,
                color: '#FF0000',    // Color of horizontal grid line
                // 'solid'|'dash'
                style: 'dash',       // Type of line
                dashValue: [2, 2]
            },
   	        // Grid vertical line
            vertical: {
                show: true,
                size: 2,
                color: '#32CD32',
                // 'solid'|'dash'
                style: 'solid',
                dashValue: [2, 2]
            }
        },
    }
Obyek konfigurasi grafik adalah struktur data yang mengatur beberapa sifat dan penampilan grafik. Misalnya, konfigurasi gaya garis kisi digunakan dalam contoh. Ada juga banyak opsi yang dapat dikonfigurasi dan dimodifikasi, seperti pengaturan sumbu X, sumbu Y terkait, pengaturan garis kursor, pengaturan pesan peringatan, pengaturan gaya indikator teknis, pengaturan gaya K-line BAR, dll.
Tentu saja, jika Anda tidak akrab dengan ini, Anda tidak dapat lulus dalam objek konfigurasi grafik ketika memanggilKLineChartfungsi untuk membuat objek grafik. Kemudian grafik yang dibuat adalah gaya default. Gunakan fungsi APIKLineChartfungsi platform FMZ untuk membuat objek grafik:
var c = KLineChart(chartCfg)
Kode pengujian untuk menggambar garis kisi:
/*backtest
start: 2022-03-21 09:00:00
end: 2022-06-21 15:00:00
period: 1d
basePeriod: 1h
exchanges: [{"eid":"Binance","currency":"BTC_USDT"}]
*/

function main() {
    var chartCfg = {
        grid: {
            show: true,
            // Grid horizontal line
            horizontal: {
                show: true,
                size: 2,
                color: '#FF0000',
                // 'solid'|'dash'
                style: 'dash',
                dashValue: [2, 2]
            },
   	        // Grid vertical line
            vertical: {
                show: true,
                size: 2,
                color: '#32CD32',
                // 'solid'|'dash'
                style: 'solid',
                dashValue: [2, 2]
            }
        },
    }

    var c = KLineChart(chartCfg)

    // Strategy main loop
    while(true) {
        // Polling interval
        Sleep(500)

        // Obtain K-line data
        var bars = _C(exchange.GetRecords)
        bars.forEach(function(bar, index) {
            c.begin(bar)
            c.close()
        })

        // Strategy trading logic
        // ...
        // ..
    }
}
Contoh gaya konfigurasi grafik
Hal ini dapat digunakan untuk merujuk pada pengaturan gaya konfigurasi grafik.
{
// Gridlines
grid: {
show: true,
// Grid horizontal line
horizontal: {
show: true,
size: 1,
color: '#393939',
// 'solid'|'dash'
style: 'dash',
dashValue: [2, 2]
},
// Grid vertical line
vertical: {
show: false,
size: 1,
color: '#393939',
// 'solid'|'dash'
style: 'dash',
dashValue: [2, 2]
}
},
// Candlestick chart
candle: {
// The distance between the top and bottom of the candlestick chart, greater than 1 is the absolute value, greater than 0, and 1 is the proportion
margin: {
top: 0.2,
bottom: 0.1
},
// Type of Candlestick Charts 'candle_solid'|'candle_stroke'|'candle_up_stroke'|'candle_down_stroke'|'ohlc'|'area'
type: 'candle_solid',
// Candle pillar
bar: {
upColor: '#26A69A',
downColor: '#EF5350',
noChangeColor: '#888888'
},
// Area map
area: {
lineSize: 2,
lineColor: '#2196F3',
value: 'close',
backgroundColor: [{
offset: 0,
color: 'rgba(33, 150, 243, 0.01)'
}, {
offset: 1,
color: 'rgba(33, 150, 243, 0.2)'
}]
},
priceMark: {
show: true,
// Highest price marker
high: {
show: true,
color: '#D9D9D9',
textMargin: 5,
textSize: 10,
textFamily: 'Helvetica Neue',
textWeight: 'normal'
},
// Lowest price marker
low: {
show: true,
color: '#D9D9D9',
textMargin: 5,
textSize: 10,
textFamily: 'Helvetica Neue',
textWeight: 'normal',
},
// Latest price marker
last: {
show: true,
upColor: '#26A69A',
downColor: '#EF5350',
noChangeColor: '#888888',
line: {
show: true,
// 'solid'|'dash'
style: 'dash',
dashValue: [4, 4],
size: 1
},
text: {
show: true,
size: 12,
paddingLeft: 2,
paddingTop: 2,
paddingRight: 2,
paddingBottom: 2,
color: '#FFFFFF',
family: 'Helvetica Neue',
weight: 'normal',
borderRadius: 2
}
}
},
// Tips
tooltip: {
// 'always' | 'follow_cross' | 'none'
showRule: 'always',
// 'standard' | 'rect'
showType: 'standard',
labels: ['time', 'open', 'close', 'high', 'low', 'volume'],
values: null,
defaultValue: 'n/a',
rect: {
paddingLeft: 0,
paddingRight: 0,
paddingTop: 0,
paddingBottom: 6,
offsetLeft: 8,
offsetTop: 8,
offsetRight: 8,
borderRadius: 4,
borderSize: 1,
borderColor: '#3f4254',
backgroundColor: 'rgba(17, 17, 17, .3)'
},
text: {
size: 12,
family: 'Helvetica Neue',
weight: 'normal',
color: '#D9D9D9',
marginLeft: 8,
marginTop: 6,
marginRight: 8,
marginBottom: 0
}
}
},
// Technical indicators
technicalIndicator: {
margin: {
top: 0.2,
bottom: 0.1
},
bar: {
upColor: '#26A69A',
downColor: '#EF5350',
noChangeColor: '#888888'
},
line: {
size: 1,
colors: ['#FF9600', '#9D65C9', '#2196F3', '#E11D74', '#01C5C4']
},
circle: {
upColor: '#26A69A',
downColor: '#EF5350',
noChangeColor: '#888888'
},
// Latest value marker
lastValueMark: {
show: false,
text: {
show: false,
color: '#ffffff',
size: 12,
family: 'Helvetica Neue',
weight: 'normal',
paddingLeft: 3,
paddingTop: 2,
paddingRight: 3,
paddingBottom: 2,
borderRadius: 2
}
},
// Tips
tooltip: {
// 'always' | 'follow_cross' | 'none'
showRule: 'always',
// 'standard' | 'rect'
showType: 'standard',
showName: true,
showParams: true,
defaultValue: 'n/a',
text: {
size: 12,
family: 'Helvetica Neue',
weight: 'normal',
color: '#D9D9D9',
marginTop: 6,
marginRight: 8,
marginBottom: 0,
marginLeft: 8
}
}
},
// x-axis
xAxis: {
show: true,
height: null,
// x-axis line
axisLine: {
show: true,
color: '#888888',
size: 1
},
// x-axis split text
tickText: {
show: true,
color: '#D9D9D9',
family: 'Helvetica Neue',
weight: 'normal',
size: 12,
paddingTop: 3,
paddingBottom: 6
},
// x-axis split line
tickLine: {
show: true,
size: 1,
length: 3,
color: '#888888'
}
},
// y-axis
yAxis: {
show: true,
width: null,
// 'left' | 'right'
position: 'right',
// 'normal' | 'percentage' | 'log'
type: 'normal',
inside: false,
reverse: false,
// y-axis line
axisLine: {
show: true,
color: '#888888',
size: 1
},
// y-axis split text
tickText: {
show: true,
color: '#D9D9D9',
family: 'Helvetica Neue',
weight: 'normal',
size: 12,
paddingLeft: 3,
paddingRight: 6
},
// y-axis split line
tickLine: {
show: true,
size: 1,
length: 3,
color: '#888888'
}
},
// Split line between charts
separator: {
size: 1,
color: '#888888',
fill: true,
activeBackgroundColor: 'rgba(230, 230, 230, .15)'
},
// Crosshair
crosshair: {
show: true,
// Horizontal line and text of crosshair
horizontal: {
show: true,
line: {
show: true,
// 'solid'|'dash'
style: 'dash',
dashValue: [4, 2],
size: 1,
color: '#888888'
},
text: {
show: true,
color: '#D9D9D9',
size: 12,
family: 'Helvetica Neue',
weight: 'normal',
paddingLeft: 2,
paddingRight: 2,
paddingTop: 2,
paddingBottom: 2,
borderSize: 1,
borderColor: '#505050',
borderRadius: 2,
backgroundColor: '#505050'
}
},
// Vertical line and text of crosshair
vertical: {
show: true,
line: {
show: true,
// 'solid'|'dash'
style: 'dash',
dashValue: [4, 2],
size: 1,
color: '#888888'
},
text: {
show: true,
color: '#D9D9D9',
size: 12,
family: 'Helvetica Neue',
weight: 'normal',
paddingLeft: 2,
paddingRight: 2,
paddingTop: 2,
paddingBottom: 2,
borderSize: 1,
borderColor: '#505050',
borderRadius: 2,
backgroundColor: '#505050'
}
}
},
// Graph
shape: {
point: {
backgroundColor: '#2196F3',
borderColor: '#2196F3',
borderSize: 1,
radius: 4,
activeBackgroundColor: '#2196F3',
activeBorderColor: '#2196F3',
activeBorderSize: 1,
activeRadius: 6
},
line: {
// 'solid'|'dash'
style: 'solid'
color: '#2196F3',
size: 1,
dashValue: [2, 2]
},
polygon: {
// 'stroke'|'fill'
style: 'stroke',
stroke: {
// 'solid'|'dash'
style: 'solid',
size: 1,
color: '#2196F3',
dashValue: [2, 2]
},
fill: {
color: 'rgba(33, 150, 243, 0.1)'
}
},
arc: {
// 'stroke'|'fill'
style: 'stroke',
stroke: {
// 'solid'|'dash'
style: 'solid',
size: 1,
color: '#2196F3',
dashValue: [2, 2]
},
fill: {
color: '#2196F3'
}
},
text: {
style: 'fill',
color: '#2196F3',
size: 12,
family: 'Helvetica Neue',
weight: 'normal',
offset: [0, 0]
}
},
annotation: {
// 'top' | 'bottom' | 'point'
position: 'top',
offset: [20, 0]
symbol: {
// 'diamond' | 'circle' | 'rect' | 'triangle' | 'custom' | 'none'
type: 'diamond',
size: 8,
color: '#2196F3',
activeSize: 10,
activeColor: '#FF9600'
}
},
tag: {
// 'top' | 'bottom' | 'point'
position: 'point',
offset: 0,
line: {
show: true,
style: LineStyle.DASH,
dashValue: [4, 2],
size: 1,
color: '#2196F3'
},
text: {
color: '#FFFFFF',
backgroundColor: '#2196F3',
size: 12,
family: 'Helvetica Neue',
weight: 'normal',
paddingLeft: 2,
paddingRight: 2,
paddingTop: 2,
paddingBottom: 2,
borderRadius: 2,
borderSize: 1,
borderColor: '#2196F3'
},
mark: {
offset: 0,
color: '#FFFFFF',
backgroundColor: '#2196F3',
size: 12,
family: 'Helvetica Neue',
weight: 'normal',
paddingLeft: 2,
paddingRight: 2,
paddingTop: 2,
paddingBottom: 2,
borderRadius: 2,
borderSize: 1,
borderColor: '#2196F3'
}
}
}
Bukankah ini membuat desain strategi lebih mudah?
- Mengkuantifikasi Analisis Fundamental di Pasar Cryptocurrency: Biarkan Data Berbicara Sendiri!
- Di sini, saya akan membahas beberapa hal yang sangat penting tentang penelitian kuantitatif dasar dalam lingkaran mata uang - jangan percaya lagi pada guru-guru sihir yang bodoh, data berbicara secara obyektif!
- Alat penting dalam bidang transaksi kuantitatif - inventor modul eksplorasi data kuantitatif
- Menguasai Semuanya - Pendahuluan ke FMZ Versi Baru Terminal Trading (dengan TRB Arbitrage Source Code)
- Untuk mengetahui semua tentang FMZ, silahkan kunjungi situs resmi FMZ.
- FMZ Quant: Analisis Contoh Desain Persyaratan Umum di Pasar Cryptocurrency (II)
- Cara Mengeksploitasi Robot Penjual Tanpa Otak dengan Strategi Frekuensi Tinggi dalam 80 Baris Kode
- FMZ Kuantitas: Perencanaan Contoh Desain Permintaan Umum di Pasar Cryptocurrency (II)
- Cara Mengeksploitasi Robot Tanpa Otak untuk Dijual dengan Strategi Frekuensi Tinggi 80 Baris Kode
- FMZ Quant: Analisis Contoh Desain Persyaratan Umum di Pasar Cryptocurrency (I)
- Kuantitas FMZ: Perbedaan antara permintaan umum pasar cryptocurrency dan contoh desain (1)