Cryptocurrency Quantitative Trading for Beginners - Membawa Anda Lebih Dekat dengan Cryptocurrency Quantitative (5)
Penulis:Lydia, Dibuat: 2022-08-03 16:08:50, Diperbarui: 2023-09-21 21:07:02
Dalam artikel sebelumnya, kami menjelaskan analisis logika trading dari strategi grid sederhana.
-
Analisis logika perdagangan Seperti yang kami sebutkan dalam artikel sebelumnya, Anda dapat memicu tindakan perdagangan dengan melintasi setiap garis kisi dan menilai penyeberangan harga saat ini di atas atau di bawah.
Rincian pertama yang harus kita pertimbangkan adalah desain kisi tak terbatas.
createNetuntuk menghasilkan struktur data grid awal bersama-sama dalam artikel sebelumnya? fungsi ini menghasilkan struktur data grid dengan jumlah garis grid terbatas. jadi bagaimana jika harga melampaui batas struktur data grid ini (di luar garis grid atas di mana harga tertinggi, dan garis grid bawah di mana harga terendah) ketika strategi berjalan? Jadi kita perlu menambahkan mekanisme ekstensi pada struktur data grid terlebih dahulu.Mari kita mulai menulis strategi fungsi utama, yang merupakan kode di mana strategi mulai melaksanakan
var diff = 50                                 // Global variables and grid spacing can be designed as parameters for easy explanation. We write this parameter into the code.
function main() {
    // After the real bot starts running, execute the strategy code from here
    var ticker = _C(exchange.GetTicker)       // To get the latest market data ticker, please refer to the FMZ API documentation for the structure of the ticker data: https://www.fmz.com/api#ticker
    var net = createNet(ticker.Last, diff)    // The function we designed in the previous article to construct the grid data structure initially, here we construct a grid data structure net

    while (true) {                            // Then the program logic enters this while infinite loop, and the strategy execution will continue to execute the code within the {} symbol here.
        ticker = _C(exchange.GetTicker)       // The first line of the infinite loop code section, get the latest market data and update it to the ticker variable
        // Check the grid range
        while (ticker.Last >= net[net.length - 1].price) {
            net.push({
                buy : false,
                sell : false,
                price : net[net.length - 1].price + diff,
            })
        }
        while (ticker.Last <= net[0].price) {
            var price = net[0].price - diff
            if (price <= 0) {
                break
            }
            net.unshift({
                buy : false,
                sell : false,
                price : price,
            })
        }

        // There are other codes...
    }
}
Membuat struktur data grid dapat diperluas adalah kode ini (diambil dari kode di atas):
      // Check the grid range
      while (ticker.Last >= net[net.length - 1].price) {   // If the price exceeds the grid line of the highest price of the grid
          net.push({                                       // Just add a new grid line after the grid line with the highest price of the grid
              buy : false,                                 // Initialize sell marker
              sell : false,                                // Initialize buy marker
              price : net[net.length - 1].price + diff,    // dd a grid spacing to the previous highest price
          })
      }
      while (ticker.Last <= net[0].price) {                // If the price is lower than the grid line of the lowest price of the grid
          var price = net[0].price - diff                  // Different from adding upwards, it should be noted that the price of adding new grid lines downwards cannot be less than or equal to 0, so it is necessary to judge here
          if (price <= 0) {                                // Less than or equal to 0 will not be added, jump out of this loop
              break
          }
          net.unshift({                                    // Add a new grid line just before the grid line with the lowest price of the grid
              buy : false,
              sell : false,
              price : price,
          })
      }
Langkah selanjutnya adalah untuk mempertimbangkan bagaimana menerapkan pemicu perdagangan secara khusus.
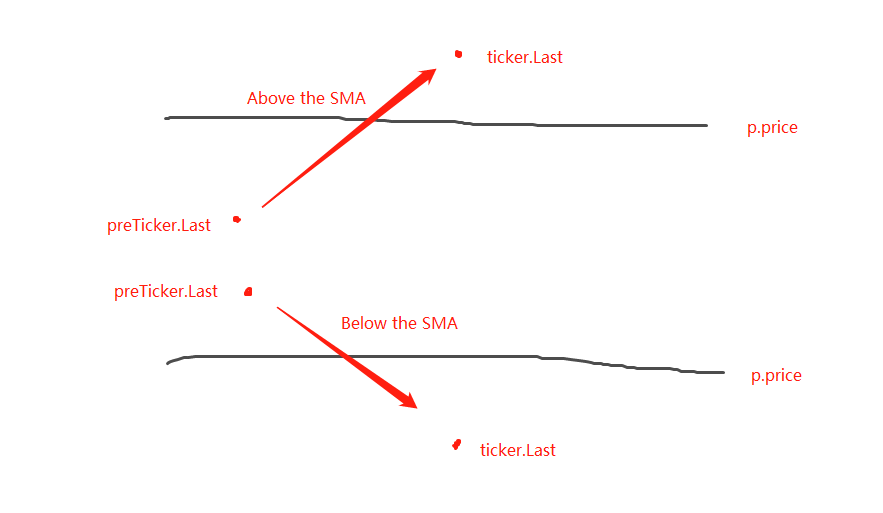
var diff = 50
var amount = 0.002       // Add a global variable, which can also be designed as a parameter. Of course, for the sake of simplicity, we also write it in the strategy code.
                         // This parameter controls the trade volume each time a trade is triggered on the grid line
function main() {
    var ticker = _C(exchange.GetTicker)
    var net = createNet(ticker.Last, diff)
    var preTicker = ticker       // Before the main loop (fixed loop) starts, set a variable to record the last market data
    while (true) {
        ticker = _C(exchange.GetTicker)
        // Check the grid range
        while (ticker.Last >= net[net.length - 1].price) {
            net.push({
                buy : false,
                sell : false,
                price : net[net.length - 1].price + diff,
            })
        }
        while (ticker.Last <= net[0].price) {
            var price = net[0].price - diff
            if (price <= 0) {
                break
            }
            net.unshift({
                buy : false,
                sell : false,
                price : price,
            })
        }

        // Retrieve grid
        for (var i = 0 ; i < net.length ; i++) {     // Iterate over all grid lines in the grid data structure
            var p = net[i]
            if (preTicker.Last < p.price && ticker.Last > p.price) {         // Above the SMA, sell, the current node has already traded, regardless of SELL BUY, it will no longer be traded
                if (i != 0) {
                    var downP = net[i - 1]
                    if (downP.buy) {
                        exchange.Sell(-1, amount, ticker)
                        downP.buy = false
                        p.sell = false
                        continue
                    }
                }
                if (!p.sell && !p.buy) {
                    exchange.Sell(-1, amount, ticker)
                    p.sell = true
                }
            } else if (preTicker.Last > p.price && ticker.Last < p.price) {  // Below the SMA, buy
                if (i != net.length - 1) {
                    var upP = net[i + 1]
                    if (upP.sell) {
                        exchange.Buy(-1, amount * ticker.Last, ticker)
                        upP.sell = false
                        p.buy = false
                        continue
                    }
                }
                if (!p.buy && !p.sell) {
                    exchange.Buy(-1, amount * ticker.Last, ticker)
                    p.buy = true
                }
            }
        }
        preTicker = ticker    // Record the current market data in preTicker, and in the next cycle, use it as a comparison between the "previous" market data and the latest one to judge whether to be above the SMA or below the SMA.
        Sleep(500)
    }
}
Dapat dilihat bahwa:
- Kondisi untuk melintasi di atas garis grid:
preTicker.Last < p.price && ticker.Last > p.price - Kondisi untuk melintasi di bawah garis grid:
preTicker.Last > p.price && ticker.Last < p.price
Inilah yang kami katakan dalam posting sebelumnya:
- Kondisi untuk melintasi di atas garis grid:
Menghakimi apakah akan berada di atas SMA atau di bawah SMA hanyalah langkah pertama dalam menilai apakah pesanan dapat ditempatkan, dan juga perlu untuk menilai tanda-tanda dalam data garis grid.
Jika di atas SMA, harga dinilai lebih rendah dari garis grid saat ini dan tanda beli pada garis grid terdekat. Jika nilai tanda beli benar, itu berarti bahwa garis grid sebelumnya telah dibeli, dan mengatur ulang tanda beli sebelumnya menjadi salah, dan mengatur ulang tanda jual garis grid saat ini menjadi salah.
Setelah menilai kondisi, jika tidak ada pemicu, lanjutkan menilai. Jika tanda beli / jual pada garis grid saat ini keduanya salah, itu berarti bahwa garis grid saat ini dapat diperdagangkan. Karena berada di atas SMA, kita akan melakukan operasi jual di sini. Setelah eksekusi, tanda tanda jual garis grid saat ini benar.
Logika pemrosesan adalah sama untuk berada di bawah SMA (kiri untuk pemula untuk berpikir tentang di sini).
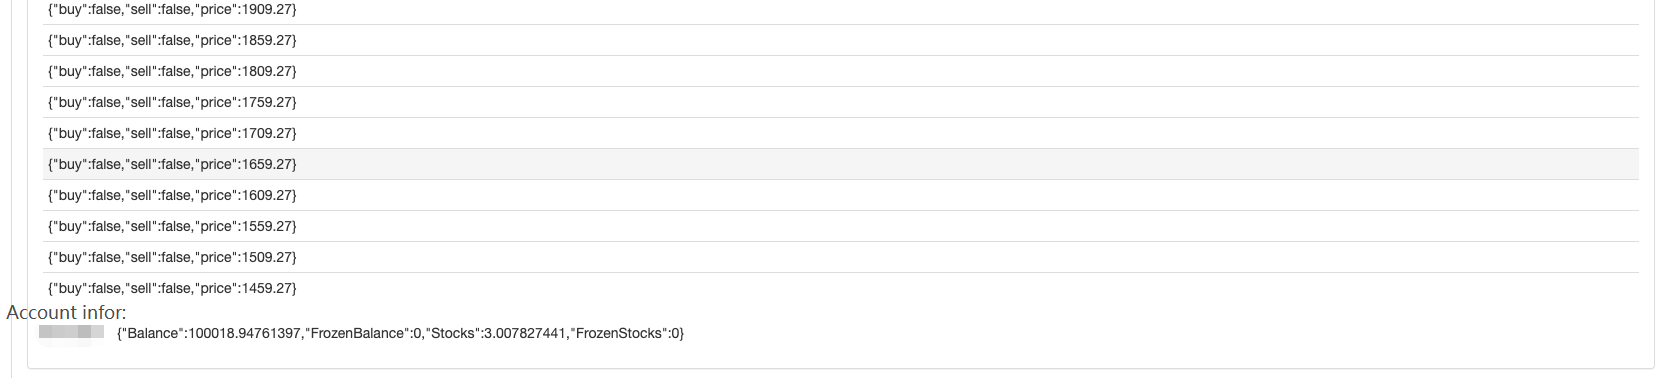
Pelacakan strategi lengkap
Untuk melihat beberapa data selama backtesting, fungsishowTblditulis untuk menampilkan data.
function showTbl(arr) {
    var tbl = {
        type : "table",
        title : "grid",
        cols : ["grid information"],
        rows : []
    }
    var arrReverse = arr.slice(0).reverse()
    _.each(arrReverse, function(ele) {
        var color = ""
        if (ele.buy) {
            color = "#FF0000"
        } else if (ele.sell) {
            color = "#00FF00"
        }
        tbl.rows.push([JSON.stringify(ele) + color])
    })
    LogStatus(_D(), "\n`" + JSON.stringify(tbl) + "`", "\n account Information:", exchange.GetAccount())
}
Kode strategi lengkap:
/*backtest
start: 2021-04-01 22:00:00
end: 2021-05-22 00:00:00
period: 1d
basePeriod: 1m
exchanges: [{"eid":"OKEX","currency":"ETH_USDT","balance":100000}]
*/

var diff = 50
var amount = 0.002
function createNet(begin, diff) {
    var oneSideNums = 10
    var up = []
    var down = []
    for (var i = 0 ; i < oneSideNums ; i++) {
        var upObj = {
            buy : false,
            sell : false,
            price : begin + diff / 2 + i * diff,
        }
        up.push(upObj)

        var j = (oneSideNums - 1) - i
        var downObj = {
            buy : false,
            sell : false,
            price : begin - diff / 2 - j * diff,
        }
        if (downObj.price <= 0) {  // The price cannot be less than or equal to 0
            continue
        }
        down.push(downObj)
    }

    return down.concat(up)
}

function showTbl(arr) {
    var tbl = {
        type : "table",
        title : "grid",
        cols : ["grid Information"],
        rows : []
    }
    var arrReverse = arr.slice(0).reverse()
    _.each(arrReverse, function(ele) {
        var color = ""
        if (ele.buy) {
            color = "#FF0000"
        } else if (ele.sell) {
            color = "#00FF00"
        }
        tbl.rows.push([JSON.stringify(ele) + color])
    })
    LogStatus(_D(), "\n`" + JSON.stringify(tbl) + "`", "\n account Information:", exchange.GetAccount())
}

function main() {
    var ticker = _C(exchange.GetTicker)
    var net = createNet(ticker.Last, diff)
    var preTicker = ticker
    while (true) {
        ticker = _C(exchange.GetTicker)
        // Check the grid range
        while (ticker.Last >= net[net.length - 1].price) {
            net.push({
                buy : false,
                sell : false,
                price : net[net.length - 1].price + diff,
            })
        }
        while (ticker.Last <= net[0].price) {
            var price = net[0].price - diff
            if (price <= 0) {
                break
            }
            net.unshift({
                buy : false,
                sell : false,
                price : price,
            })
        }

        // Retrieve grid
        for (var i = 0 ; i < net.length ; i++) {
            var p = net[i]
            if (preTicker.Last < p.price && ticker.Last > p.price) {         // Being above the SMA, sell, the current node has already traded, regardless of SELL BUY, it will no longer be traded
                if (i != 0) {
                    var downP = net[i - 1]
                    if (downP.buy) {
                        exchange.Sell(-1, amount, ticker)
                        downP.buy = false
                        p.sell = false
                        continue
                    }
                }
                if (!p.sell && !p.buy) {
                    exchange.Sell(-1, amount, ticker)
                    p.sell = true
                }
            } else if (preTicker.Last > p.price && ticker.Last < p.price) {  // Being below the SMA, buy
                if (i != net.length - 1) {
                    var upP = net[i + 1]
                    if (upP.sell) {
                        exchange.Buy(-1, amount * ticker.Last, ticker)
                        upP.sell = false
                        p.buy = false
                        continue
                    }
                }
                if (!p.buy && !p.sell) {
                    exchange.Buy(-1, amount * ticker.Last, ticker)
                    p.buy = true
                }
            }
        }

        showTbl(net)
        preTicker = ticker
        Sleep(500)
    }
}
Strategi backtesting:
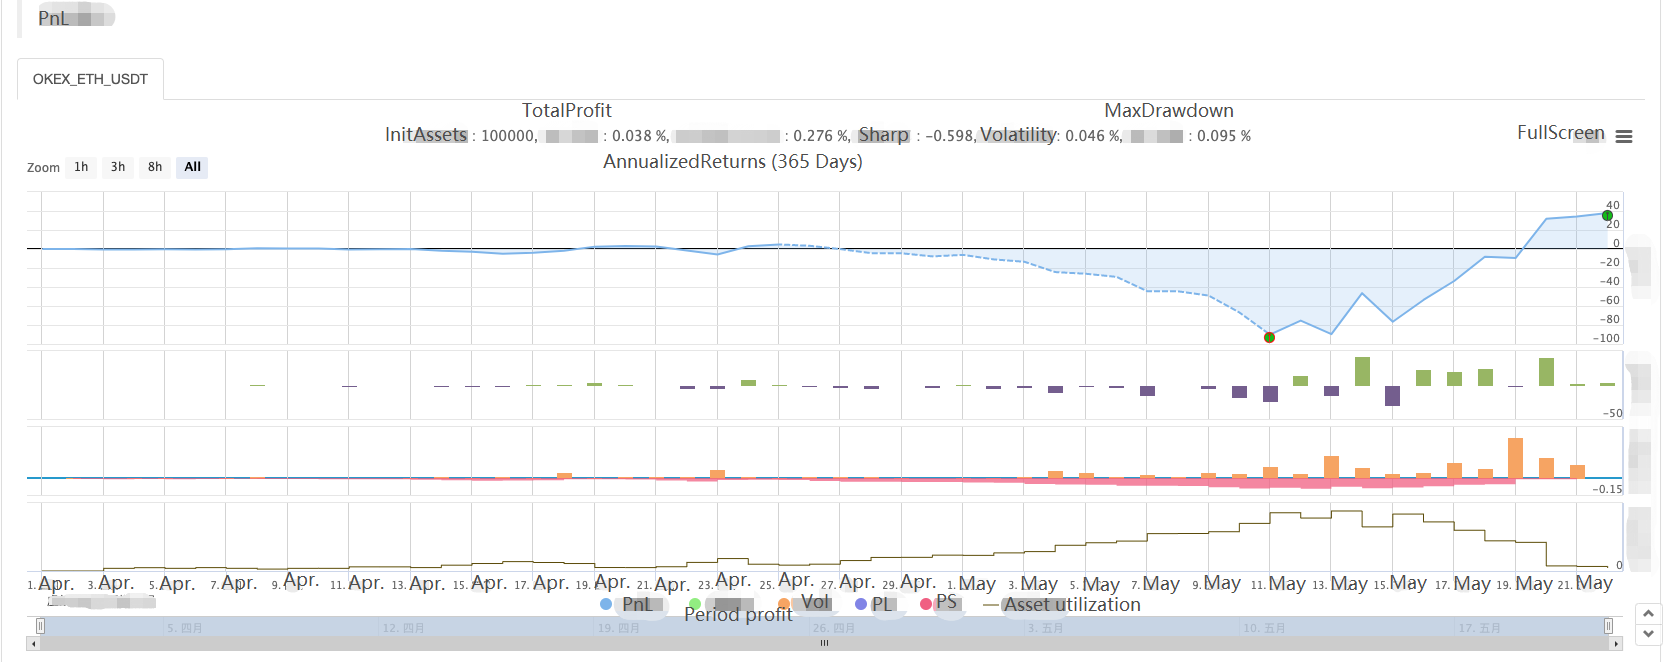
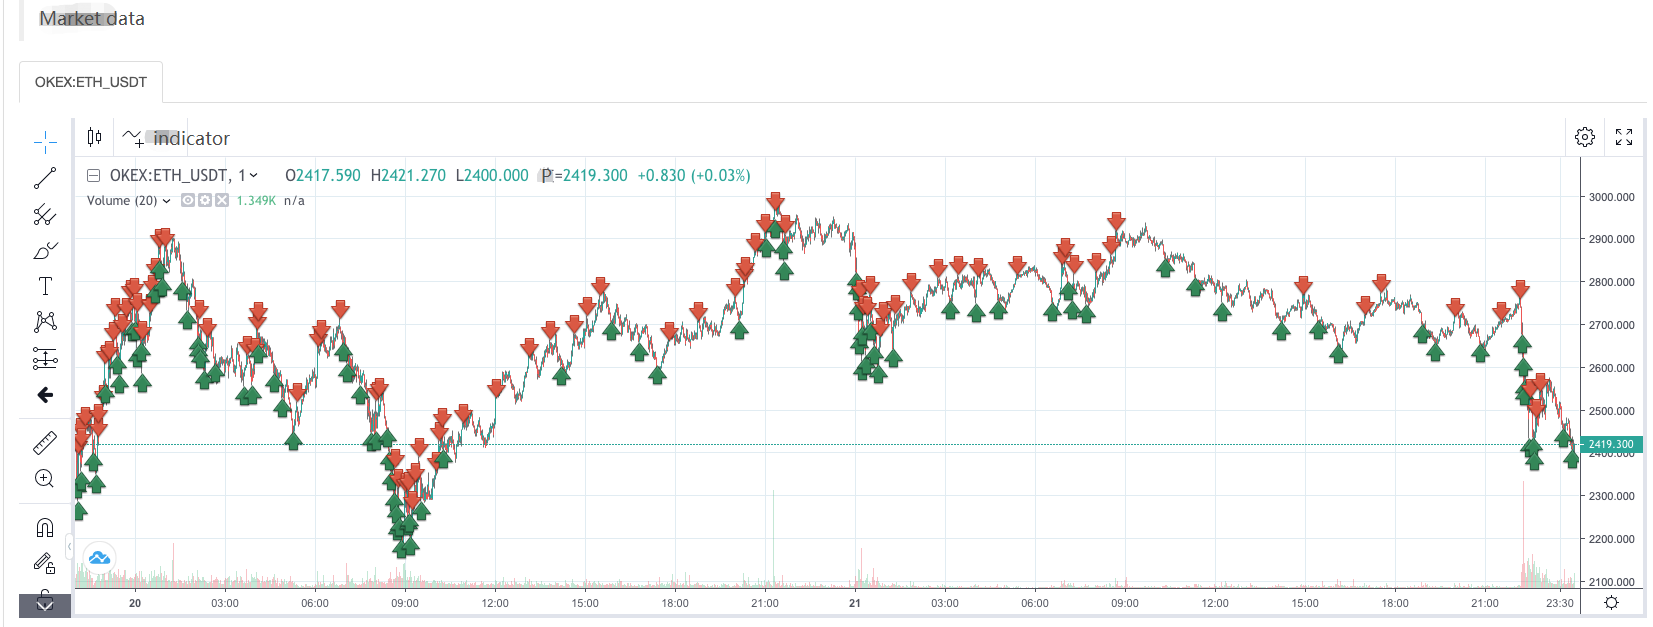
Jadi kita bisa melihat karakteristik strategi grid, ketika ada pasar yang sedang tren, akan ada kerugian besar yang mengambang, dan keuntungan akan bangkit dalam pasar yang tidak stabil.
Oleh karena itu, strategi grid tidak bebas risiko. strategi spot masih dapat
- Mengkuantifikasi Analisis Fundamental di Pasar Cryptocurrency: Biarkan Data Berbicara Sendiri!
- Di sini, saya akan membahas beberapa hal yang sangat penting tentang penelitian kuantitatif dasar dalam lingkaran mata uang - jangan percaya lagi pada guru-guru sihir yang bodoh, data berbicara secara obyektif!
- Alat penting dalam bidang transaksi kuantitatif - inventor modul eksplorasi data kuantitatif
- Menguasai Semuanya - Pendahuluan ke FMZ Versi Baru Terminal Trading (dengan TRB Arbitrage Source Code)
- Untuk mengetahui semua tentang FMZ, silahkan kunjungi situs resmi FMZ.
- FMZ Quant: Analisis Contoh Desain Persyaratan Umum di Pasar Cryptocurrency (II)
- Cara Mengeksploitasi Robot Penjual Tanpa Otak dengan Strategi Frekuensi Tinggi dalam 80 Baris Kode
- FMZ Kuantitas: Perencanaan Contoh Desain Permintaan Umum di Pasar Cryptocurrency (II)
- Cara Mengeksploitasi Robot Tanpa Otak untuk Dijual dengan Strategi Frekuensi Tinggi 80 Baris Kode
- FMZ Quant: Analisis Contoh Desain Persyaratan Umum di Pasar Cryptocurrency (I)
- Kuantitas FMZ: Perbedaan antara permintaan umum pasar cryptocurrency dan contoh desain (1)