Strategi ATR multi-spesies berjangka mata uang digital (tutorial)
Penulis:Lydia, Dibuat: 2022-11-08 10:34:22, Diperbarui: 2023-09-15 20:55:33
Baru-baru ini, beberapa pengguna platform kami berharap untuk mentransplantasikan strategi MyLanguage ke dalam strategi JavaScript, yang dapat secara fleksibel menambahkan banyak ide pengoptimalan. Bahkan memperluas strategi ke versi multi-spesies. Karena strategi MyLanguage biasanya merupakan strategi tren, dan banyak dari mereka dijalankan berdasarkan model harga penutupan. Antarmuka API dari pertukaran permintaan strategi tidak terlalu sering, yang cocok untuk mentransplantasikan ke versi strategi multi-spesies. Dalam artikel ini, kami akan mengambil strategi MyLanguage sederhana sebagai contoh untuk mentransplantasinya ke dalam versi bahasa JavaScript yang sederhana. Tujuan utamanya adalah mengajar dan mendukung penelitian. Jika Anda ingin membuat bot nyata, Anda mungkin perlu menambahkan beberapa detail (test harga pesanan, akurasi persentase kuantitas, kontrol kuantitas pesanan, tampilan informasi status pesanan berdasarkan aset, dll.), Dan juga perlu tes bot nyata.
Strategi MyLanguage yang Harus Dipindahkan
TR:=MAX(MAX((H-L),ABS(REF(C,1)-H)),ABS(REF(C,1)-L));
ATR:=EMA(TR,LENGTH2);

MIDLINE^^EMA((H + L + C)/3,LENGTH1);
UPBAND^^MIDLINE + N*ATR;
DOWNBAND^^MIDLINE - N*ATR;


BKVOL=0 AND C>=UPBAND AND REF(C,1)<REF(UPBAND,1),BPK;
SKVOL=0 AND C<=DOWNBAND AND REF(C,1)>REF(DOWNBAND,1),SPK;

BKVOL>0 AND C<=MIDLINE,SP(BKVOL);
SKVOL>0 AND C>=MIDLINE,BP(SKVOL);
// stop loss
// stop loss
C>=SKPRICE*(1+SLOSS*0.01),BP;
C<=BKPRICE*(1-SLOSS*0.01),SP;
AUTOFILTER;
Logika perdagangan strategi ini sederhana. Pertama, hitung ATR sesuai dengan parameter, kemudian hitung rata-rata harga tertinggi, terendah dan penutupan dari semua K-line BAR, dan kemudian hitung indikator EMA sesuai dengan data rata-rata. Akhirnya, gabungkan ATR dan koefisien N dalam parameter untuk menghitung upBand dan downBand.
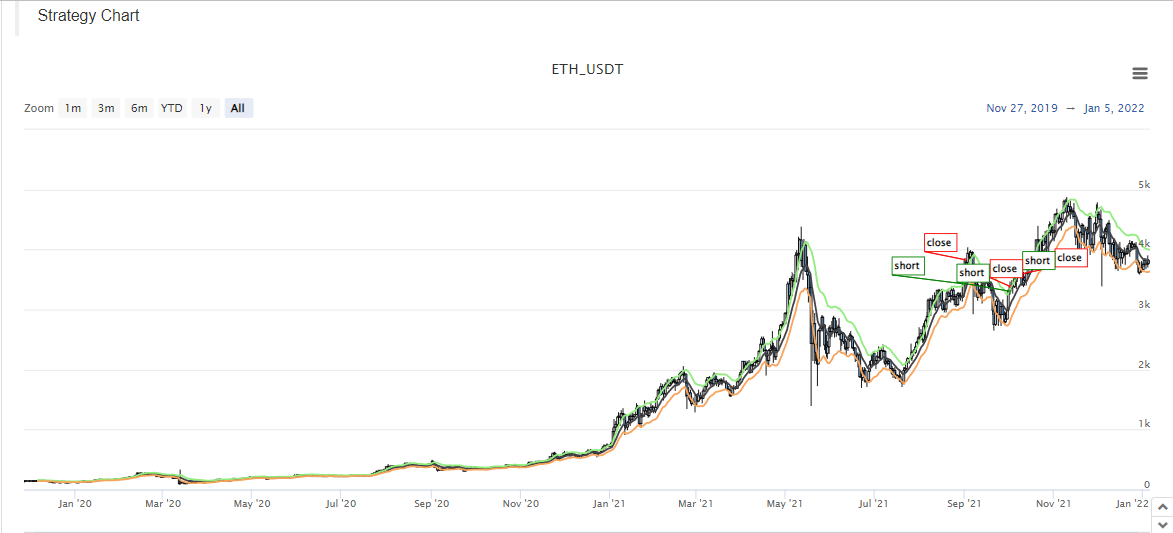
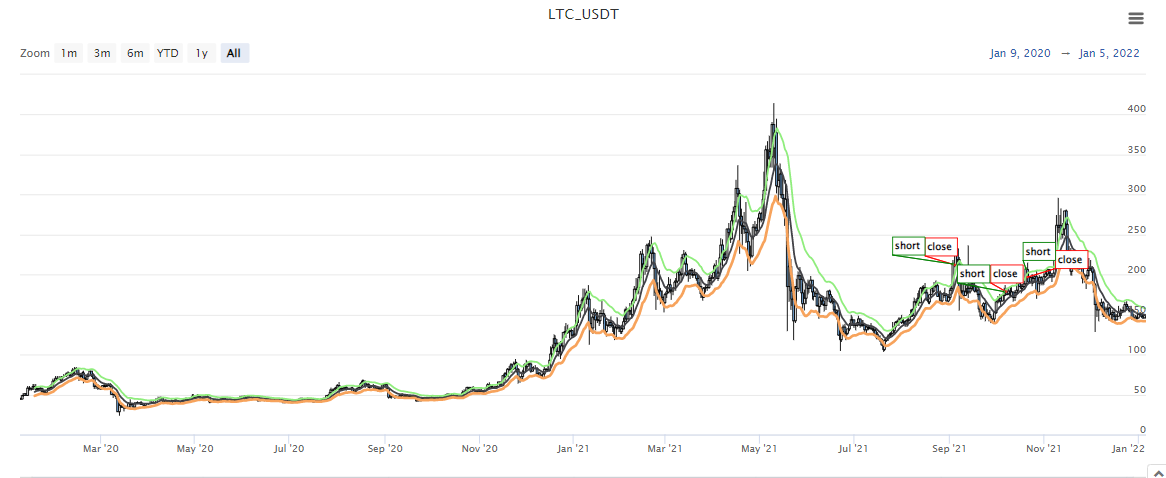
Posisi pembukaan dan penjualan didasarkan pada harga penutupan. Buka posisi panjang ketika melampaui upBand dan jual posisi pembukaan (saat memegang posisi pendek). Buka posisi pendek ketika melampaui downBand dan jual posisi pembukaan. Ketika harga penutupan mencapai garis tengah, posisi akan ditutup, dan ketika harga penutupan mencapai harga stop loss, posisi juga akan ditutup (stop loss menurut SLOSS, SLOSS adalah 1, yaitu 0,01, yaitu 1%). Strategi ini dilaksanakan dalam model harga penutupan.
OK, jika kita memahami persyaratan strategis dan ide-ide dari MyLanguage, kita bisa mulai menanamkan mereka.
Prototipe Strategi Transplantasi dan Desain
Tidak banyak kode prototipe strategi, mulai dari 1 hingga 200 baris.
// parse params parameters, and parse strings as objects
var arrParam = JSON.parse(params)

// this function creates a chart configuration
function createChartConfig(symbol, atrPeriod, emaPeriod, index) {   // symbol : trading pair, atrPeriod : ATR parameter period , emaPeriod : EMA parameter period, exchange object index corresponding to index
    var chart = {
        __isStock: true,
        extension: {
                layout: 'single',
                height: 600,
        },
        title : { text : symbol},
        xAxis: { type: 'datetime'},
        series : [
            {
                type: 'candlestick',    // K-line data series
                name: symbol,
                id: symbol + "-" + index,
                data: []
            }, {
                type: 'line',           // EMA
                name: symbol + ',EMA:' + emaPeriod,
                data: [],
            }, {
                type: 'line',           // upBand
                name: symbol + ',upBand' + atrPeriod,
                data: []
            }, {
                type: 'line',           // downBand
                name: symbol + ',downBand' + atrPeriod,
                data: []
            }, {
                type: 'flags',
                onSeries: symbol + "-" + index,
                data: [],
            }
        ]
    }
    return chart
}

// main Logic
function process(e, kIndex, c) {    // e is the exchange object, exchanges [0]..., kIndex is the K-line data series in the chart, and c is the chart object
    // obtain K-line data
    var r = e.GetRecords(e.param.period)
    if (!r || r.length < e.param.atrPeriod + 2 || r.length < e.param.emaPeriod + 2) {
        // if the K-line data length is insufficient, return
        return
    }

    // calculate ATR indicators
    var atr = TA.ATR(r, e.param.atrPeriod)
    var arrAvgPrice = []
    _.each(r, function(bar) {
        arrAvgPrice.push((bar.High + bar.Low + bar.Close) / 3)
    })
    // calculate EMA indicators
    var midLine = TA.EMA(arrAvgPrice, e.param.emaPeriod)
    // calculate upBand and downBand
    var upBand = []
    var downBand = []
    _.each(midLine, function(mid, index) {
        if (index < e.param.emaPeriod - 1 || index < e.param.atrPeriod - 1) {
            upBand.push(NaN)
            downBand.push(NaN)
            return
        }
        upBand.push(mid + e.param.trackRatio * atr[index])
        downBand.push(mid - e.param.trackRatio * atr[index])
    })

    // draw the chart
    for (var i = 0 ; i < r.length ; i++) {
        if (r[i].Time == e.state.lastBarTime) {
            // update
            c.add(kIndex, [r[i].Time, r[i].Open, r[i].High, r[i].Low, r[i].Close], -1)
            c.add(kIndex + 1, [r[i].Time, midLine[i]], -1)
            c.add(kIndex + 2, [r[i].Time, upBand[i]], -1)
            c.add(kIndex + 3, [r[i].Time, downBand[i]], -1)
        } else if (r[i].Time > e.state.lastBarTime) {
            // add
            e.state.lastBarTime = r[i].Time
            c.add(kIndex, [r[i].Time, r[i].Open, r[i].High, r[i].Low, r[i].Close])
            c.add(kIndex + 1, [r[i].Time, midLine[i]])
            c.add(kIndex + 2, [r[i].Time, upBand[i]])
            c.add(kIndex + 3, [r[i].Time, downBand[i]])
        }
    }

    // check the position
    var pos = e.GetPosition()
    if (!pos) {
        return
    }
    var holdAmount = 0
    var holdPrice = 0
    if (pos.length > 1) {
        throw "long and short positions are checked at the same time!"
    } else if (pos.length != 0) {
        holdAmount = pos[0].Type == PD_LONG ? pos[0].Amount : -pos[0].Amount
        holdPrice = pos[0].Price
    }

    if (e.state.preBar == -1) {
        e.state.preBar = r[r.length - 1].Time
    }
    // check the signal
    if (e.state.preBar != r[r.length - 1].Time) {   // closing price model
        if (holdAmount <= 0 && r[r.length - 3].Close < upBand[upBand.length - 3] && r[r.length - 2].Close > upBand[upBand.length - 2]) {   // the closing price cross over the upBand
            if (holdAmount < 0) {   // hold a short positions, close them
                Log(e.GetCurrency(), "close short positions", "#FF0000")
                $.CoverShort(e, e.param.symbol, Math.abs(holdAmount))
                c.add(kIndex + 4, {x: r[r.length - 2].Time, color: 'red', shape: 'flag', title: 'close', text: "close short positions"})
            }
            // open long positions
            Log(e.GetCurrency(), "open long positions", "#FF0000")
            $.OpenLong(e, e.param.symbol, 10)
            c.add(kIndex + 4, {x: r[r.length - 2].Time, color: 'red', shape: 'flag', title: 'long', text: "open long positions"})
        } else if (holdAmount >= 0 && r[r.length - 3].Close > downBand[downBand.length - 3] && r[r.length - 2].Close < downBand[downBand.length - 2]) {  // the closing price cross down the downBand
            if (holdAmount > 0) {   // hold long positions, close them
                Log(e.GetCurrency(), "close long positions", "#FF0000")
                $.CoverLong(e, e.param.symbol, Math.abs(holdAmount))
                c.add(kIndex + 4, {x: r[r.length - 2].Time, color: 'green', shape: 'flag', title: 'close', text: "close long positions"})
            }
            // open short positions
            Log(e.GetCurrency(), "open short positions", "#FF0000")
            $.OpenShort(e, e.param.symbol, 10)
            c.add(kIndex + 4, {x: r[r.length - 2].Time, color: 'green', shape: 'flag', title: 'short', text: "open short positions"})
        } else {
            // close positions
            if (holdAmount > 0 && (r[r.length - 2].Close <= holdPrice * (1 - e.param.stopLoss) || r[r.length - 2].Close <= midLine[midLine.length - 2])) {   // Hold a long position, the closing price is less than or equal to the midline, stop loss at the opening price
                Log(e.GetCurrency(), "trigger midline or stop loss, close long positions", "#FF0000")
                $.CoverLong(e, e.param.symbol, Math.abs(holdAmount))
                c.add(kIndex + 4, {x: r[r.length - 2].Time, color: 'green', shape: 'flag', title: 'close', text: "close long positions"})
            } else if (holdAmount < 0 && (r[r.length - 2].Close >= holdPrice * (1 + e.param.stopLoss) || r[r.length - 2].Close >= midLine[midLine.length - 2])) {  // Hold a short position, the closing price is greater than or equal to the midline, stop loss at the opening price
                Log(e.GetCurrency(), "trigger midline or stop loss, close short positions", "#FF0000")
                $.CoverShort(e, e.param.symbol, Math.abs(holdAmount))
                c.add(kIndex + 4, {x: r[r.length - 2].Time, color: 'red', shape: 'flag', title: 'close', text: "close short positions"})
            }
        }
        e.state.preBar = r[r.length - 1].Time
    }
}

function main() {
    var arrChartConfig = []
    if (arrParam.length != exchanges.length) {
        throw "Parameters and exchange objects do not match!"
    }
    var arrState = _G("arrState")
    _.each(exchanges, function(e, index) {
        if (e.GetName() != "Futures_Binance") {
            throw "The exchange is not supported!"
        }
        e.param = arrParam[index]
        e.state = {lastBarTime: 0, symbol: e.param.symbol, currency: e.GetCurrency()}
        if (arrState) {
            if (arrState[index].symbol == e.param.symbol && arrState[index].currency == e.GetCurrency()) {
                Log("restore:", e.state)
                e.state = arrState[index]
            } else {
                throw "The restored data does not match the current settings!"
            }
        }
        e.state.preBar = -1   // initial setting -1
        e.SetContractType(e.param.symbol)
        Log(e.GetName(), e.GetLabel(), "set contracts:", e.param.symbol)
        arrChartConfig.push(createChartConfig(e.GetCurrency(), e.param.atrPeriod, e.param.emaPeriod, index))
    })
    var chart = Chart(arrChartConfig)
    chart.reset()

    while (true) {
        _.each(exchanges, function(e, index) {
            process(e, index + index * 4, chart)
            Sleep(500)
        })
    }
}

function onexit() {
    // record e.state
    var arrState = []
    _.each(exchanges, function(e) {
        arrState.push(e.state)
    })
    Log("record:", arrState)
    _G("arrState", arrState)
}
Parameter strategi:
var params = '[{
        "symbol" : "swap",    // contract code
        "period" : 86400,     // K-line period, 86,400 seconds is a day
        "stopLoss" : 0.07,    // stop loss factor, 0.07 or 7%
        "atrPeriod" : 10,     // ATR indicator parameters
        "emaPeriod" : 10,     // EMA indicator parameters
        "trackRatio" : 1,     // upBand and downBand coefficients
        "openRatio" : 0.1     // The reserved opening percentage, which is not supported for now
    }, {
        "symbol" : "swap",
        "period" : 86400,
        "stopLoss" : 0.07,
        "atrPeriod" : 10,
        "emaPeriod" : 10,
        "trackRatio" : 1,
        "openRatio" : 0.1
    }]'
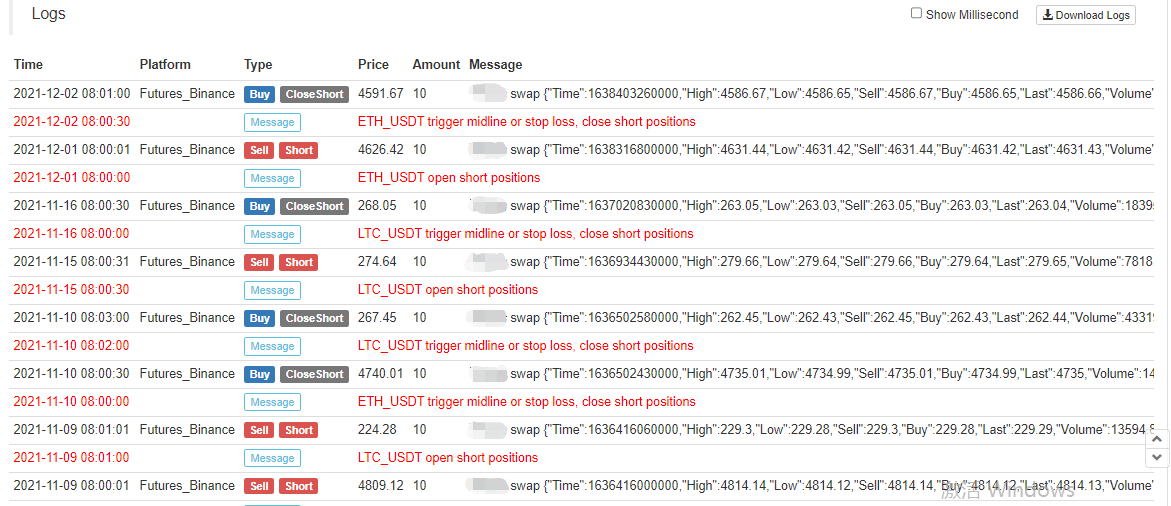
Screenshot dari backtest:
Kode sumber strategi:https://www.fmz.com/strategy/339344
Strategi hanya untuk backtesting dan belajar penelitian. Mohon modifikasi, optimalisasi, dan merujuk ke bot nyata sendiri.
- Mengkuantifikasi Analisis Fundamental di Pasar Cryptocurrency: Biarkan Data Berbicara Sendiri!
- Di sini, saya akan membahas beberapa hal yang sangat penting tentang penelitian kuantitatif dasar dalam lingkaran mata uang - jangan percaya lagi pada guru-guru sihir yang bodoh, data berbicara secara obyektif!
- Alat penting dalam bidang transaksi kuantitatif - inventor modul eksplorasi data kuantitatif
- Menguasai Semuanya - Pendahuluan ke FMZ Versi Baru Terminal Trading (dengan TRB Arbitrage Source Code)
- Untuk mengetahui semua tentang FMZ, silahkan kunjungi situs resmi FMZ.
- FMZ Quant: Analisis Contoh Desain Persyaratan Umum di Pasar Cryptocurrency (II)
- Cara Mengeksploitasi Robot Penjual Tanpa Otak dengan Strategi Frekuensi Tinggi dalam 80 Baris Kode
- FMZ Kuantitas: Perencanaan Contoh Desain Permintaan Umum di Pasar Cryptocurrency (II)
- Cara Mengeksploitasi Robot Tanpa Otak untuk Dijual dengan Strategi Frekuensi Tinggi 80 Baris Kode
- FMZ Quant: Analisis Contoh Desain Persyaratan Umum di Pasar Cryptocurrency (I)
- Kuantitas FMZ: Perbedaan antara permintaan umum pasar cryptocurrency dan contoh desain (1)