Mengajarkan Anda untuk menambahkan dukungan multi-chart untuk strategi
Penulis:Lydia, Dibuat: 2022-12-26 11:28:50, Diperbarui: 2023-09-20 09:52:47
Mengajarkan Anda untuk menambahkan dukungan multi-chart untuk strategi
Terutama ketika menulis strategi tren, kadang-kadang Anda bingung dengan kondisi pemicu dari berbagai indikator. Pada saat ini, sangat penting untuk memvisualisasikan data untuk analisis dan tampilan. Saat menambahkan grafik tunggal ke strategi, Anda dapat menggunakan template
Berikut adalah contoh untuk referensi. Saya akan mengomentari contoh kode baris demi baris. Ketika Anda selesai membaca kode, Anda akan memiliki pemahaman baru untuk menambahkan dukungan grafik ke strategi.
/*backtest
start: 2019-07-01 00:00:00
end: 2019-08-24 00:00:00
period: 1h
exchanges: [{"eid":"Futures_OKCoin","currency":"BTC_USD"}]
args: [["IsSynthesisDayKL",true]]
*/

var chart0 = {
    __isStock: true,
    // /*
    extension: {
            layout: 'single',
            height: 300,
    },
    // */
    title : { text : 'Daily K-line chart'},
    xAxis: { type: 'datetime'},
    series : [
        {
            type: 'candlestick',
            name: 'r',
            id: 'r',
            data: []
        }
    ]
}

var chart1 = {
    __isStock: true,
    // /*
    extension: {
            layout: 'single',
            height: 300,
    },
    // */
    title : { text : 'EMA'},
    xAxis: { type: 'datetime'},
    series : [
        {
            type: 'candlestick',
            name: 'r1',
            id: 'r1',
            data: []
        }, {
            type: 'line',
            name: 'chart1_EMA1',
            data: [],
        }, {
            type: 'line',
            name: 'chart1_EMA2',
            data: []
        }
    ]
}

var chart2 = {
    __isStock: true,
    // /*
    extension: {
            layout: 'single',
            height: 300,
    },
    // */
    title : { text : 'MACD'},
    xAxis: { type: 'datetime'},
    yAxis : [
        {
            title: {text: 'price'},
            opposite: false
        }, {
            title:{text: "Indicator axis"},
            opposite: true,
        }
    ],
    series : [
        {
            type: 'candlestick',
            name: 'r2',
            id: 'r2',
            data: []
        }, {
            type: 'line',
            yAxis: 1,
            name: 'dif',
            data: []
        }, {
            type: 'line',
            yAxis: 1,
            name: 'dea',
            data: []
        }
    ]
}

function CreatePlotter (e, chart) {
    var obj = {}                      // Declare an empty object for adding methods in the following code, and finally return this object, that is, the constructed drawing object.

    obj.e = e                         // The reference to the exchange object passed by the parameter is assigned to a property of the obj object.
    obj.params = {}                   // Constructed parameters
    obj.params.EMA_param1 = 5         // We preset the parameters of some indicators on the chart to be used in the calculation of the indicator, for example, an EMA indicator line parameter.
    obj.params.EMA_param2 = 20        // The second EMA indicator line parameters, usually small parameters are called fast lines, large parameters are called slow lines.
    obj.params.MACD_fast = 12         // MACD parameter
    obj.params.MACD_slow = 26         // MACD parameter
    obj.params.MACD_sig = 9           // MACD parameter

    obj.runTime = {}                  // Used to store some data during runtime.
    obj.runTime.arrPreBarTime = [0, 0, 0]    // Store the timestamp of the previous bar of each K-line data for comparison.

    obj.GetAllRecords = function () {              // A method of the drawing object, used to get the K-line data, our example is used to display three charts at the same time, so, the function get three different periods of K-line data at the same time.
        obj.r = _C(obj.e.GetRecords, PERIOD_H1)    // The K-line data of the first chart, which is the 1-hour level K-line data.
        Sleep(1000)
        obj.r1 = _C(obj.e.GetRecords, PERIOD_M15)  // The K-line data of the second chart, which is the 15-minute level K-line data.
        Sleep(1000)
        obj.r2 = _C(obj.e.GetRecords, PERIOD_D1)   // The K-line data of the third chart, which is the daily level K-line data.
    }

    obj.Run = function () {                        // Execute the functions of drawing objects.
        obj.Plot()                                 // Execute the specific drawing code.
    }

    obj.CalcMACD = function (r, fast, slow, sig) {       // MACD indicator calculation function, return MACD indicator data.
        if (r.length <= Math.max(fast, slow, sig)) {
            return false
        }
        return TA.MACD(r, fast, slow, sig)
    }


    obj.Plot = function () {                   // Focus section with specific drawing code.
        obj.GetAllRecords()                    // Before each plot, update all K-line data first.
        var arr = [obj.r, obj.r1, obj.r2]      // Put all K-line data in an array and traverse it.
        var arrKIndex = [0, 1, 4]              // Indexing of K-line data series in chart objects.
        for (var i = 0; i < arr.length; i++) { // Traversal operations
            for (var j = 0; j < arr[i].length; j++) {
                if (arr[i][j].Time == obj.runTime.arrPreBarTime[i]) {    // When the last bar of the K-line data is not updated, we only update the data and do not add it. Note that when the chart.add function is called, the last parameter uses -1, which means that the data is updated and not added.
                    chart.add(arrKIndex[i], [arr[i][j].Time, arr[i][j].Open, arr[i][j].High, arr[i][j].Low, arr[i][j].Close], -1)

                   if (i == 1) {    // Update the EMA indicator data in the second chart.
                        var nowR = arr[i].slice(0, j + 1)
                        var ema1 = TA.EMA(nowR, obj.params.EMA_param1)
                        var ema2 = TA.EMA(nowR, obj.params.EMA_param2)
                        if (obj.r2.length <= obj.params.EMA_param1 || obj.r2.length <= obj.params.EMA_param2 || isNaN(ema1[j]) || isNaN(ema2[j])) {
                            continue
                        }

                        chart.add(2, [arr[i][j].Time, ema1[ema1.length - 1]], -1)
                        chart.add(3, [arr[i][j].Time, ema2[ema2.length - 1]], -1)
                    } else if (i == 2) {     // Update the MACD indicator data in the third chart
                        var nowR = arr[i].slice(0, j + 1)
                        var macd = obj.CalcMACD(nowR, obj.params.MACD_fast, obj.params.MACD_slow, obj.params.MACD_sig)
                        if (!macd) {
                            continue
                        }

                        var dif = macd[0]
                        var dea = macd[1]
                        chart.add(5, [arr[i][j].Time, dif[dif.length - 1]], -1)
                        chart.add(6, [arr[i][j].Time, dea[dea.length - 1]], -1)
                    }
                } else if (arr[i][j].Time > obj.runTime.arrPreBarTime[i]) {   // When the last bar of the current K-line data is larger than the last bar timestamp recorded previously, it indicates that a new bar has been generated for the K-line. At this time, a new bar and a new indicator data point should be added.
                    obj.runTime.arrPreBarTime[i] = arr[i][j].Time             // Update the record of the last bar timestamp for the next comparison. If the next timestamp is the same, data will not be added unless a new bar is generated.
                    chart.add(arrKIndex[i], [arr[i][j].Time, arr[i][j].Open, arr[i][j].High, arr[i][j].Low, arr[i][j].Close])
                    if (i == 1) {
                        var nowR = arr[i].slice(0, j + 1)
                        var ema1 = TA.EMA(nowR, obj.params.EMA_param1)
                        var ema2 = TA.EMA(nowR, obj.params.EMA_param2)
                        if (nowR.length <= obj.params.EMA_param1 || nowR.length <= obj.params.EMA_param2 || isNaN(ema1[ema1.length - 1]) || isNaN(ema2[ema2.length - 1])) {
                            continue
                        }

                        chart.add(2, [arr[i][j].Time, ema1[ema1.length - 1]])
                        chart.add(3, [arr[i][j].Time, ema2[ema2.length - 1]])
                    } else if (i == 2) {
                        var nowR = arr[i].slice(0, j + 1)
                        var macd = obj.CalcMACD(nowR, obj.params.MACD_fast, obj.params.MACD_slow, obj.params.MACD_sig)
                        if (!macd) {
                            continue
                        }

                        var dif = macd[0]
                        var dea = macd[1]
                        chart.add(5, [arr[i][j].Time, dif[dif.length - 1]])
                        chart.add(6, [arr[i][j].Time, dea[dea.length - 1]])
                    }
                }
            }
        }
    }
    obj.Plot()

    return obj
}

function main () {
    var chart = Chart([chart0, chart1, chart2])
    chart.reset()

    exchange.SetContractType("quarter")
    var plotter = CreatePlotter(exchange, chart)
    while (true) {
        plotter.Run()
        Sleep(1000)
    }
}
Kita mulai dengan melihatmainFungsi:
function main () {                                  // Strategy entry function, of course, this strategy does not do anything, there are no transactions, just drawing charts.
    var chart = Chart([chart0, chart1, chart2])     // chart0, chart1, chart2 are pre-declared chart configuration objects, call the Chart function is to load the chart configuration, return a chart control object chart.
    chart.reset()                                   // Call the reset method of the chart control object chart to reset the chart.

    exchange.SetContractType("quarter")             // The backtest configuration is OKX futures, so here to set the contract, the contract is set to quarter.
    var plotter = CreatePlotter(exchange, chart)    // Call the CreatePlotter function to generate the plotter object -- plotter.
    while (true) {
        plotter.Run()                               // Execute drawing object plotter member function Run to draw.
        Sleep(1000)                                 // The drawing object plotter is responsible for "how to draw", and the chart control object chart is responsible for specific drawing. The former is implemented by our code, and the latter is the control object returned by the underlying API function of the system.
    }
}
Selanjutnya, kita bisa melihat bagaimanaCreatePlotterfungsi mengimplementasikan fungsi gambar ketika membangun objek gambar.var plotter=CreatePlotter(exchange, chart), ketika membangun plotter obyek gambar, pertukaran dan grafik diteruskan. Yang pertama digunakan untuk mendapatkan data K-line (dengan memanggil exchange.GetRecords), dan yang terakhir digunakan untuk mengoperasikan grafik dan menambahkan data ke grafik.
Bagian terpenting dari plot adalahPlotKomentar telah ditulis dalam kode.
Operasi backtesting:
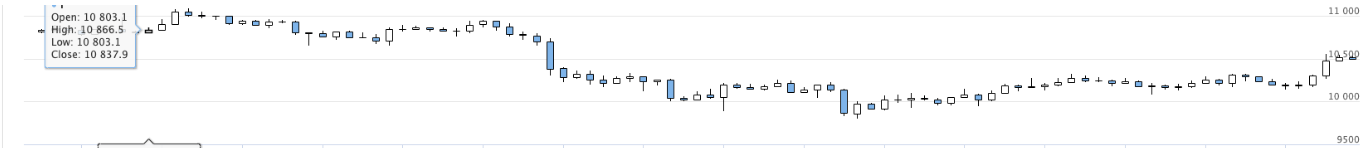
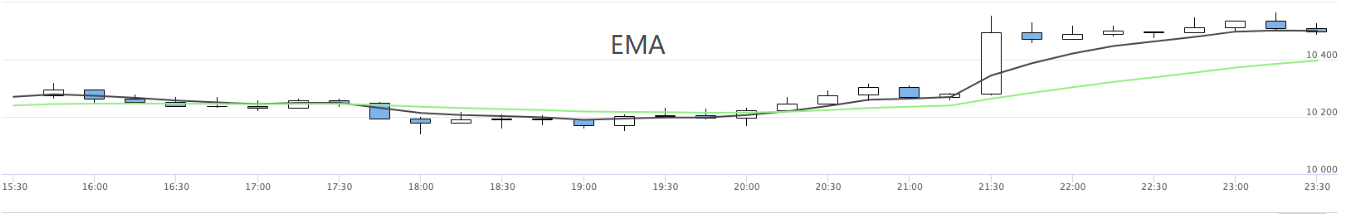
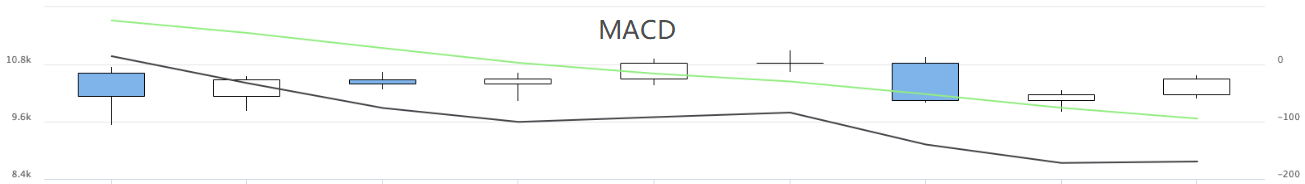
Dengan cara ini, beberapa grafik strategi dapat ditampilkan.
- Mengkuantifikasi Analisis Fundamental di Pasar Cryptocurrency: Biarkan Data Berbicara Sendiri!
- Di sini, saya akan membahas beberapa hal yang sangat penting tentang penelitian kuantitatif dasar dalam lingkaran mata uang - jangan percaya lagi pada guru-guru sihir yang bodoh, data berbicara secara obyektif!
- Alat penting dalam bidang transaksi kuantitatif - inventor modul eksplorasi data kuantitatif
- Menguasai Semuanya - Pendahuluan ke FMZ Versi Baru Terminal Trading (dengan TRB Arbitrage Source Code)
- Untuk mengetahui semua tentang FMZ, silahkan kunjungi situs resmi FMZ.
- FMZ Quant: Analisis Contoh Desain Persyaratan Umum di Pasar Cryptocurrency (II)
- Cara Mengeksploitasi Robot Penjual Tanpa Otak dengan Strategi Frekuensi Tinggi dalam 80 Baris Kode
- FMZ Kuantitas: Perencanaan Contoh Desain Permintaan Umum di Pasar Cryptocurrency (II)
- Cara Mengeksploitasi Robot Tanpa Otak untuk Dijual dengan Strategi Frekuensi Tinggi 80 Baris Kode
- FMZ Quant: Analisis Contoh Desain Persyaratan Umum di Pasar Cryptocurrency (I)
- Kuantitas FMZ: Perbedaan antara permintaan umum pasar cryptocurrency dan contoh desain (1)