Strategi Crossover MACD

Ringkasan
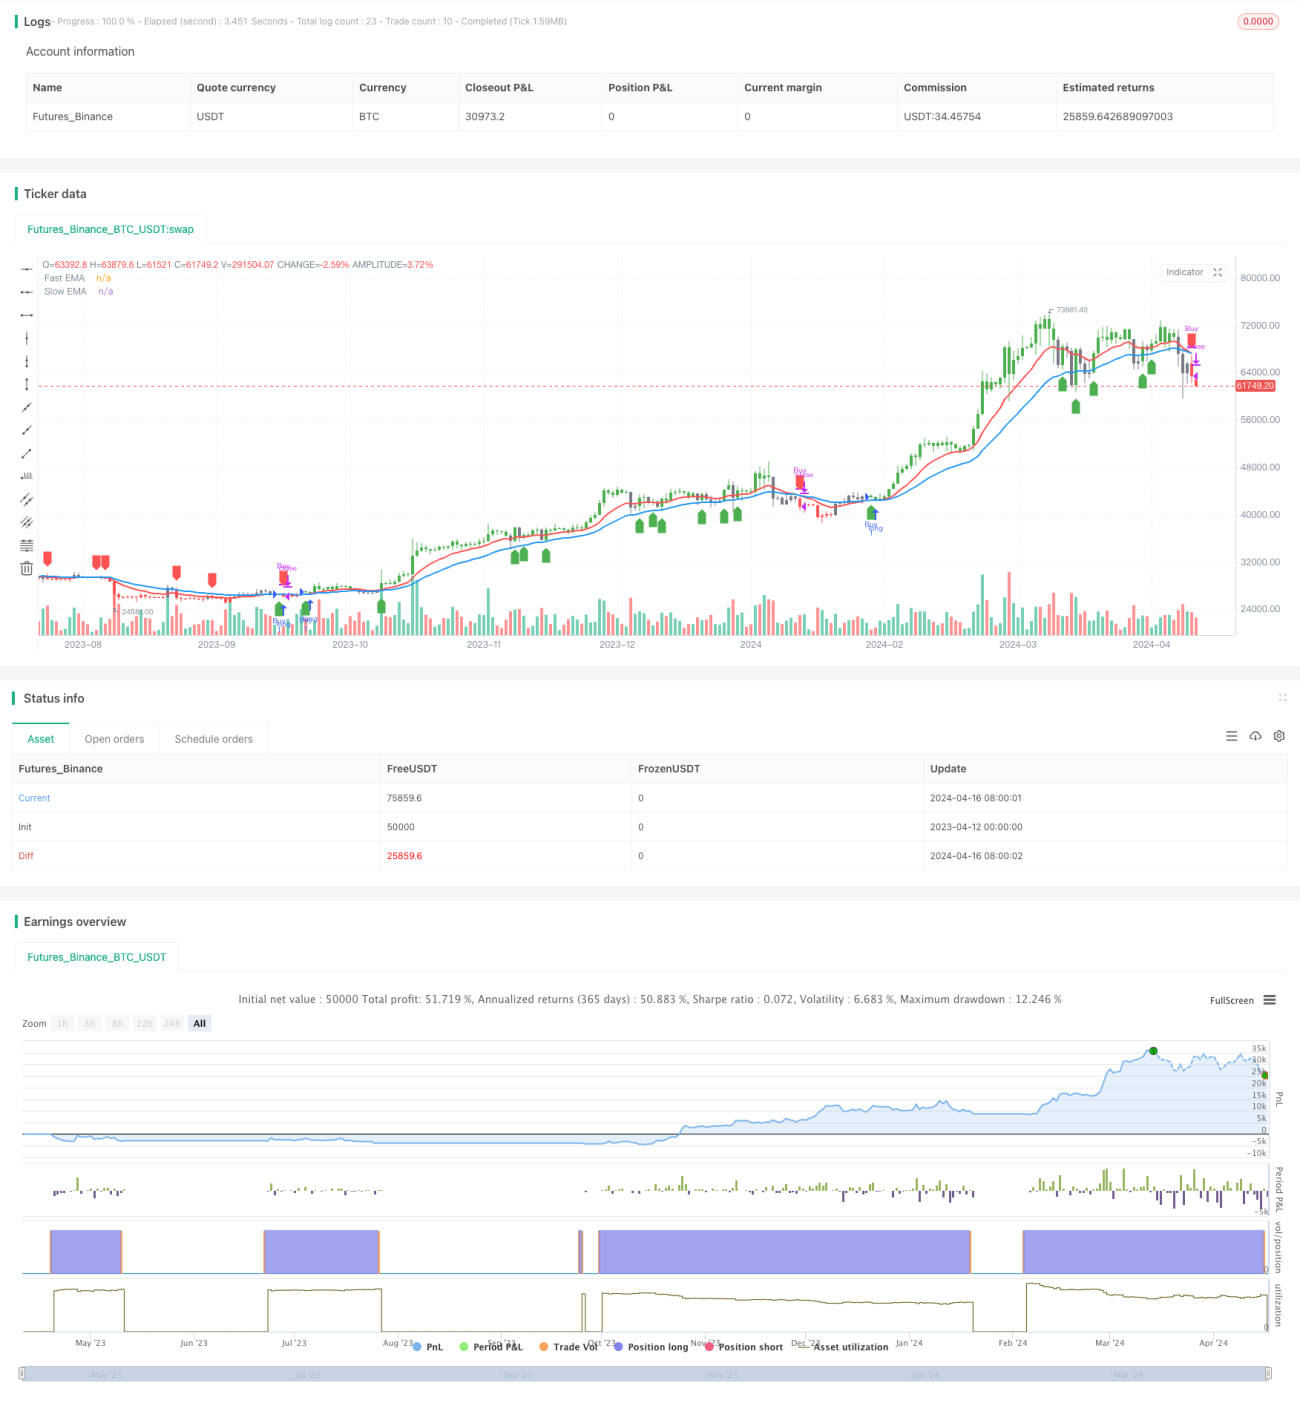
Strategi ini menggunakan dua periode berbeda dari indeks bergerak rata-rata (EMA) untuk menyeberang, menghasilkan sinyal beli ketika EMA cepat dari bawah ke atas melintasi EMA lambat, menghasilkan sinyal jual ketika EMA cepat dari atas ke bawah melintasi EMA lambat. Strategi ini dapat diterapkan pada berbagai instrumen keuangan dan periode waktu, seperti emas yang paling efektif pada siklus 2 jam, bitcoin yang paling efektif pada grafik garis matahari, dll.
Prinsip Strategi
- Hitung EMA cepat (default period 12) dan EMA lambat (default period 26).
- Definisi zona multihead ((EMA cepat di atas EMA lambat dan harga di atas EMA cepat) dan zona kosong ((EMA cepat di bawah EMA lambat dan harga di bawah EMA cepat) <unk>
- Beli saat dikonversi dari area kosong ke area multihead, jual saat dikonversi dari area multihead ke area kosong.
- Di grafik, area multihead dan area kosong ditandai dengan warna hijau dan merah, dan sinyal jual beli ditandai dengan panah.
Keunggulan Strategis
- Ini adalah bahasa yang mudah dipahami dan cocok untuk pemula.
- Aplikasi yang luas, dapat digunakan untuk berbagai instrumen keuangan dan periode waktu.
- Trends Tracking adalah kemampuan yang kuat untuk menangkap tren jangka menengah dan panjang.
- Parameter dapat disesuaikan, meningkatkan fleksibilitas.
Risiko Strategis
- Di pasar yang bergejolak, sinyal yang salah dapat menyebabkan kerugian.
- Reaksi lambat pada saat perubahan tren, dapat menyebabkan slippage tertentu.
- Pilihan parameter yang tidak tepat dapat mempengaruhi efek kebijakan.
Arah optimasi strategi
- Menambahkan filter tren, misalnya hanya berdagang ketika ADX lebih besar dari nilai tertentu, mengurangi kerugian di pasar yang bergoyang.
- Mengoptimalkan waktu masuk, seperti menggunakan ATR untuk memutuskan stop loss dan mengurangi kerugian tunggal.
- Optimalkan parameter untuk menemukan kombinasi parameter yang optimal, meningkatkan stabilitas dan profitabilitas.
- Dengan kombinasi indikator lain, seperti MACD, RSI, dan lain-lain, meningkatkan akurasi sinyal.
Meringkaskan
Strategi MACD crossover adalah strategi sederhana yang didasarkan pada pelacakan tren, dengan keuntungan yang sederhana praktis, luas aplikasi, kelemahan adalah sulit untuk menangkap pergeseran tren, pilihan parameter sulit. Dengan filter tren, mengoptimalkan masuk ke tempat keluar, pilihan parameter dan kombinasi indikator lain dapat meningkatkan kinerja strategi ini, layak untuk penelitian dan pengujian lebih lanjut.
/*backtest
start: 2023-04-12 00:00:00
end: 2024-04-17 00:00:00
period: 1d
basePeriod: 1h
exchanges: [{"eid":"Futures_Binance","currency":"BTC_USDT"}]
*/

//@version=5
strategy('Advance EMA Crossover Strategy', overlay=true, precision=6)
//****************************************************************************//
// CDC Action Zone is based on a simple EMA crossover - 1