4.4 Python 言語で戦略を実装する方法
作者: リン・ハーン優しさ作成日: 2019-04-28 16:51:22,更新日:概要
Python の基本構文,戦略フレームワークなどについて学びました. 内容が退屈でしたが,取引戦略開発には必須のスキルです. この記事では,実行可能な定量的な取引戦略を達成するのに役立つ簡単な戦略でPython の経路をステップ・バイ・ステップに進めます.
戦略の紹介
多くの取引戦略の中で,ドンチアンチャネル戦略は最もクラシックな突破戦略の1つであるべきです. 1970年以来有名です. 当時は,シミュレーションテストと主流のプログラム的な取引戦略の研究に特化した会社でした. すべての戦略テストの中で,ドンチアンチャネル戦略は最も成功しました.
後に,米国では,証券取引の歴史で大きな成功を収めた有名な"タートルトレーダートレーニングイベント"が開催された.当時,タートル取引方法は機密であったが,10年以上後に"タートル取引法"が公表され,人々は"タートルトレーディング"がドンチアンチャネル戦略の改良版を使用していることを発見した.
突破トレード戦略は,取引品種の比較的スムーズな傾向に適応している.突破の最も一般的な方法は,特定の取引位置を決定するために価格サポートとレジスタンスとの相対的な位置関係を使用することです.このセクションのドンチアンチャネル戦略もこの原則に基づいています.
ドンチアン運河戦略規則
ドンチアンチャネルはトレンド指数であり,その外観とシグナルはボリンジャー帯の指標に似ています.しかし,その価格チャネルは,特定の期間の最高値と最低値に基づいて構築されています.例えば:上列は最新の50k線
上記のように,この指標は3つの異なる色で構成されている曲線で,価格変動を表示するために20サイクルで最も高く,最低価格をデフォルト設定します.価格が狭いチャネルにあり,その逆の場合,変動が少なくなります.
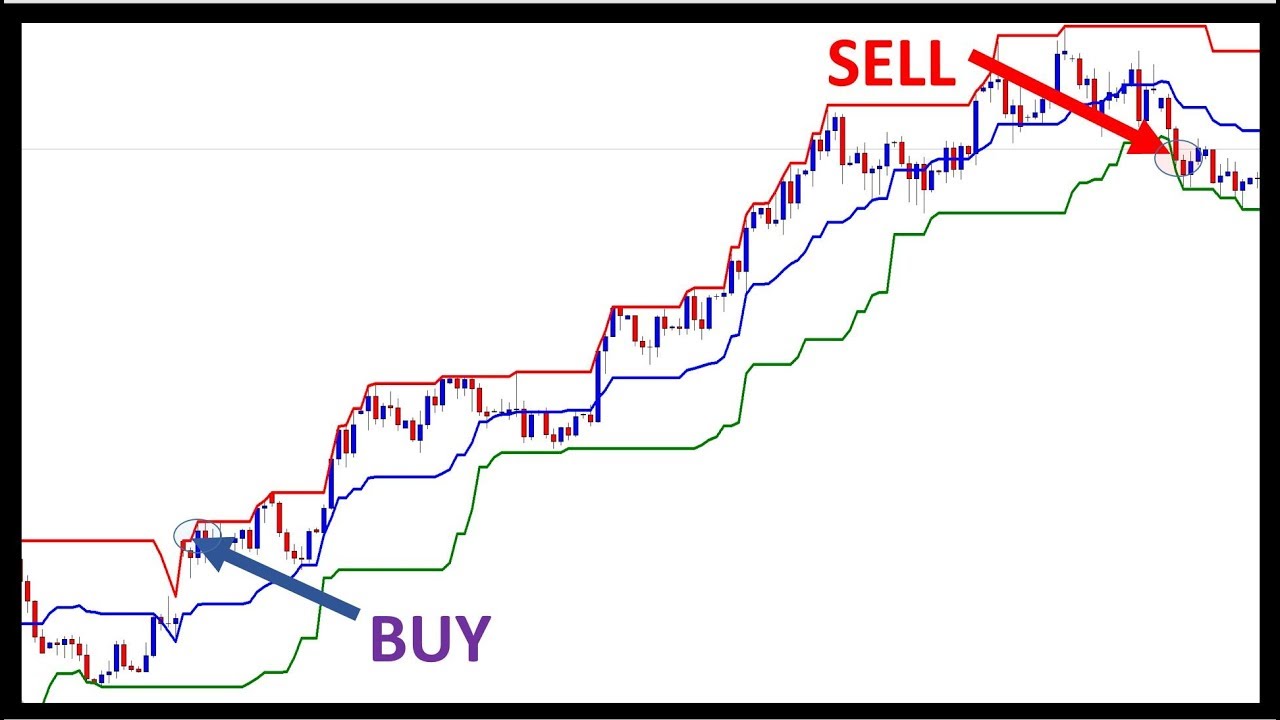
価格が上方レールの上から上昇した場合,購入信号が表示されます.逆に,価格が下方レールの下に下がると,販売信号が表示されます.上方と下部のレールが最低値と最高値を使用して計算されるため,通常の状況下では価格がレールを突破しません.それはレールとともに移動するか,チャネル内を飛び回ります.
ドンキアンチャネル計算方法
FMZの量子プラットフォームでは ドンチアンチャネル計算は簡単です 5行目は 50サイクルで最も高い価格, 6行目は 50サイクルで最も低い価格を得ることです.
def main(): # program entry
    exchange.SetContractType("this_week") # set the variety type by using the weekly k-line
    while True: # enter the loop
        records = exchange.GetRecords() # get the k line array
        upper = TA.Highest(record, 50, 'high') # get the highest price of 50 cycles
        lower = TA.Lowest(record, 50, 'low') # get the lowest price of 50 cycles
        middle = (upper + lower) / 2 # calculate the average value of upper and lower rails
        Log("upper rail: ", upper) # print the upper rail value in the log
        Log("lower rail: ", lower) # print the lower rail value in the log
        Log("middle rail: ", middle) # print the middle rail value in the log
戦略の論理
ドンチアンチャネルを使用する方法はいくつかあり,単独または他の指標と組み合わせて使用できます.このセクションでは,最も簡単な方法で使用します.すなわち,価格が上線を突破すると,圧力線上を突破すると,購買力が強くなり,上昇エネルギーの波を形成し,購入信号が生成されます.価格が下線を下線を突破すると,サポートライン下を突破すると,販売信号が生成されます.
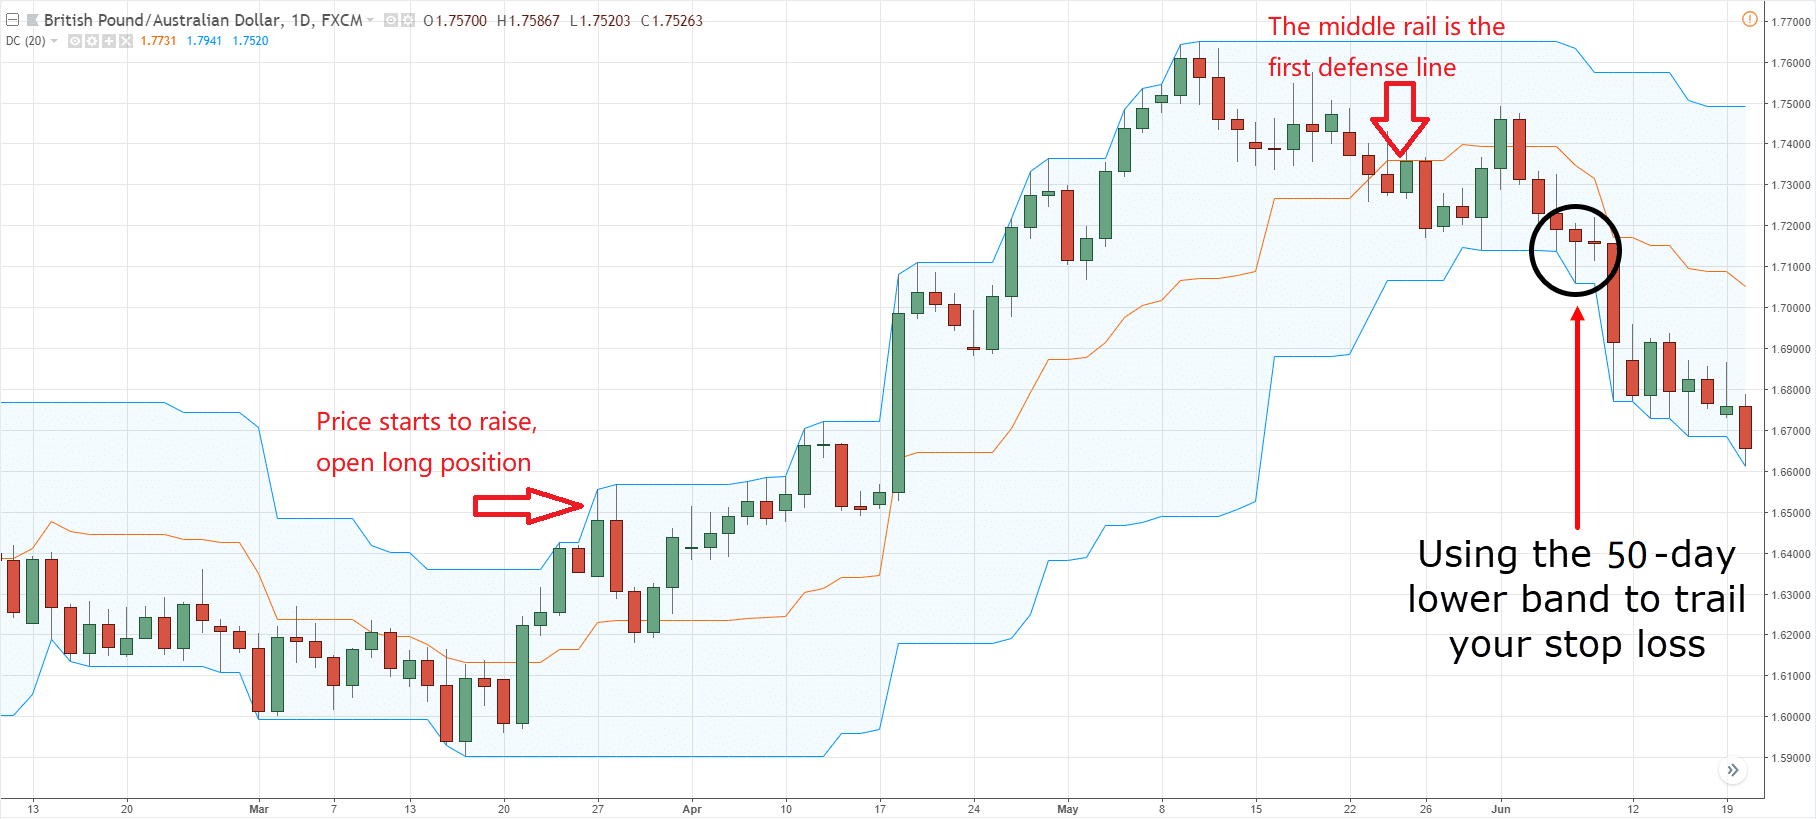
ロングポジションを開いた後,価格が再びチャネルの中央レールに下がると,購入力の強さが弱くなったり,販売力の強さが強まったりすると考え,ショートポジションを開設する信号が生成されます.
取引条件
-
ロングポジションが開いている場合: ポジションを保持していない場合,閉じる価格が上レールより大きい場合
-
オープンショートポジション: ポジションを保持していない場合,閉じる価格がローバーレールより低い場合
-
ロングポジションを閉じる:現在ロングポジションを保持し,閉じる価格がミドルレールより低い場合
-
閉じるショートポジション:現在,ショートポジションを保持し,閉じる価格が中間線よりも大きい場合
戦略コードの実施
戦略の実施の最初のステップは,まずデータを入手することです. データは取引戦略の前提要素です. 考えてみてください. どのようなデータが必要ですか? どのようにデータを入手しますか?
次のステップは,これらのデータに基づいて取引論理を計算することです.最後のステップは,論理に従って取引することです. 次のステップ:
ステップ1: トレーディングクラスライブラリを使用
トレーディングクラスのライブラリを機能的なモジュールとして考えることができます. トレーディングクラスのライブラリを使用するメリットは,戦略ロジックを書くことに集中することを可能にすることです. 例えば,取引クラスのライブラリを使用すると,ポジションを開くまたは閉じるには,取引クラスのライブラリ内のAPIインターフェースを直接使用できます. しかし,取引クラスのライブラリを使用しない場合は,ポジションを開くときに市場価格を取得する必要があります. 実行されていないオーダーの問題や引き出すオーダーの問題などを検討する必要があります.
def main();
    wile true:
        obj = ext.NewPositionManager() # using the trading class library
        # followed by strategy logic and placing order part
上記のコーディング部分は,FMZ Quant ツールを使用した CTA 戦略フレームワークです.これは固定コード形式で,すべての取引論理コードは行4から開始されます.他の変更は不要です.
ステップ2:あらゆる種類のデータを取得
Bollinger Band インディケーターの上,中,下のレールと比較します. ストラテジカル・トレード・ロジックから,まず,現在のポジションの状態を得,
- K線データを取得する
K線配列を使って,最高値と最低値の N サイクル期間を計算できます. これはこう書ける:
def main(): # main function
    exchange.SetContractType("this_week") # set the variety type by using the weekly k-line
    while True: # enter the loop
        records = exchange.GetRecords() # get the k line array
        if len(records) < 50: continue # if the number of K line is less than 50, skip this loop.
        close = records[len(records) - 1].Close # get the closing price of the latest k-line
上記のように:
固定形式の K 線配列です
線5 線Kの長さをフィルタリングします. ドンチアンチャネルインジケーターを計算するパラメータは50なので,K線の数が50未満の場合は,それを計算することは不可能です. ここでK線の数をフィルタリングする必要があります.
このデータには,開通価格,最高値,最低値,閉じる価格,取引量,時間,その他のデータが含まれています.これはオブジェクトなので,Kラインの最新の閉じる価格を得るには,
- 位置データを取得する
ポジション情報は定量的な取引戦略の非常に重要な条件です.取引条件が確立されたとき,ポジションの状態とポジションの数によってオーダーを出すかどうかを判断する必要があります.例えば,ロングポジションを開く条件が確立されたとき,ポジションを保持している場合はオーダーを放置しないでください.ポジションを保持していない場合はオーダーを配置してください.今回はポジション情報を直接関数に封入し,この関数を呼び出して使用することができます.次のように:
# get the position information function
def mp():
    positions = exchange.GetPosition() # get the holding position array
    if len(position) == 0: # if the holding position array is 0
        return 0 # meaning currently has no position holding, return 0
    for i in range(len(position)): # Traversing the position array
        if (position[i]['Type'] == PD_LONG):
            return 1 # if there are long position holding, return 1
        elif (position[i]['Type'] == PD_SHORT):
            return -1 # if there are short position holding, return -1

def main(): # main function
    exchange.SetContractType("this_week") # set the variety type by using the weekly k-line
    while True: # enter the loop
        records = exchange.GetRecords() # get the k line array
        if len(records) < 50: continue # if the number of K line is less than 50, skip this loop.
        close = records[len(records) - 1].Close # get the closing price of the latest k-line
        position = mp() # get the position information function
上記のように:
これは位置情報を取得する関数です. ロングポジションがある場合,値は1です.ショートポジションがある場合,値は-1です. ポジションがない場合,値は0です.
行2:
3行目: 固定形式の位置配列を取得します
位置配列の長さを決定します. その長さが0である場合,それは位置保持がないことを意味し,0を返します.
線6: forループを使用して,この配列を横断し始めると,次の論理は非常に単純で,longポジションを保持している場合は1を返します.shortポジションを保持している場合は-1を返します.
列18:位置情報関数
- 最新の50Kラインの最高値と最低値を取得
FMZ Quant の定量取引ツールでは,自分の論理計算を書かなくても"TA.Highest"と"TA.Lowest"関数を直接使用できます.そして,
# get the position information function
def mp():
    positions = exchange.GetPosition() # get the holding position array
    if len(position) == 0: # if the holding position array is 0
        return 0 # meaning currently has no position holding, return 0
    for i in range(len(position)): # Traversing the position array
        if (position[i]['Type'] == PD_LONG):
            return 1 # if there are long position holding, return 1
        elif (position[i]['Type'] == PD_SHORT):
            return -1 # if there are short position holding, return -1

def main(): # main function
    exchange.SetContractType("this_week") # set the variety type by using the weekly k-line
    while True: # enter the loop
        records = exchange.GetRecords() # get the k line array
        if len(records) < 50: continue # if the number of K line is less than 50, skip this loop.
        close = records[len(records) - 1].Close # get the closing price of the latest k-line
        position = mp() # get the position information function
        upper = TA.Highest(record, 50, 'High') # get the highest price of 50 cycles
        lower = TA.Lowest(record, 50, 'Low') # get the lowest price of 50 cycles
        middle = (upper + lower) / 2 # calculate the average value of the upper and lower rail
上記のように:
行19: 50 サイクルの最高値を得るために
ライン20: 50 サイクルで最も低い価格を得るために
列21: 50回間の最高値と最低値に応じて上下列の平均値を計算する
ステップ3:注文と取引
上記のデータで,現在,取引論理と注文の配置を書き込むことができます. また,非常にシンプルで,最も一般的に使用されているのは,条件1と条件2が本当なら,注文を;条件3または条件4が本当なら,注文をします. 下記のとおり:
# get the position information function
def mp():
    positions = exchange.GetPosition() # get the holding position array
    if len(position) == 0: # if the holding position array is 0
        return 0 # meaning currently has no position holding, return 0
    for i in range(len(position)): # Traversing the position array
        if (position[i]['Type'] == PD_LONG):
            return 1 # if there are long position holding, return 1
        elif (position[i]['Type'] == PD_SHORT):
            return -1 # if there are short position holding, return -1

def main(): # main function
    exchange.SetContractType("this_week") # set the variety type by using the weekly k-line
    while True: # enter the loop
        records = exchange.GetRecords() # get the k line array
        if len(records) < 50: continue # if the number of K line is less than 50, skip this loop.
        close = records[len(records) - 1].Close # get the closing price of the latest k-line
        position = mp() # get the position information function
        upper = TA.Highest(record, 50, 'High') # get the highest price of 50 cycles
        lower = TA.Lowest(record, 50, 'Low') # get the lowest price of 50 cycles
        middle = (upper + lower) / 2 # calculate the average value of the upper and lower rail
        obj = ext.NewPositionManager() # using the trading class library
        if position > 0 and close < middle: # If currently holding long position, and the closing price is less than the middle rail
            obj.CoverAll() # close all position
        if position < 0 and close > middle: # If currently holding short position, and the closing price is greater than the middle rail
            obj.CoverAll() # close all position
        if position == 0: # if currently holding no position
            if close > upper: # if the closing price is greater than the middle rail
                obj.OpenLong("this_week", 1) # open long position
            elif close < lower: # if the closing price is less than the middle rail
                obj.OpenShort("this_week", 1) # open short position
上記のように:
取引クラスライブラリを使用して,これは固定形式です.
23,24行: これは,前述の"比較演算子"と"論理演算子"を用いた 閉じるロングポジションです. つまり,現在の保有がロングポジションで,閉じる価格が 中間線以下であれば,すべてのポジションを閉じるということです.
25,26行: これは,先ほど学んだ"比較演算子"と"論理演算子"を使用した 閉じるショートポジションの記述です. つまり,現在のオーダーはショートポジションであり,閉じる価格がミドルレールより大きい場合,すべてのポジションを閉じるということです.
列27: 現在の位置の状態を決定します. 保持された位置がない場合は,次のステップに移ります.
列 28,29: 閉じる価格が上方レールより大きいかどうかを決定します.閉じる価格が上部レールより上昇した場合,ロングポジションを開きます.
列 30,31: 閉じる価格が下線より低いかどうかを決定します.閉じる価格が下線を下回る場合は,ショートポジションを開きます.
結論から言うと
上記では,Python を使って完全な定量的な取引戦略の開発の各ステップを学びました.戦略導入,ドンチアンチャネル計算方法,戦略論理,取引条件,戦略コード実装など.このセクションは単純な戦略に過ぎません.インスピレーションの方法として,それを達成する方法は1つ以上あります.あなたはあなたの取引システムに応じて異なる取引方法を重ねて,独自の定量的な取引戦略を形成することができます.
次のセクションの通知
定量的な取引戦略の開発において,プログラミング言語の実行速度の観点から,どちらが最も速いのか?それはC++である必要があります.特に金融派生品や高周波取引の分野では.C++は言語特異性においてユニークで,数値計算において利点があります.JavaScriptやPythonと比較して,そのスピードは数桁増やすことができます.将来的に金融派生品や高周波取引の分野に行きたい場合は,これは見逃してはならないコースになります.
放課後 運動
-
基本から始め このセクションの戦略を実行します
-
このセクションの戦略に移動平均指標を追加して取引頻度を減らすようにしてください.
- 5.1 バックテストの意味と罠
- 4.6 C++言語で戦略を実装する方法
- エマに関する質問です
- OK futuurs はどのように平衡されますか?
- なぜ回転時に収益率と期待が一致しないのか?
- この問題は,私が書いたコードで起こっています.
- 一般協定 (レインディン取引所LOEX)
- 図面図書には,長行列を足す方法があります.
- 戦略的再評価は,どんな利得基準になるのでしょうか?
- 4.5 C++ 言語 早いスタート
- 滑り点数は何ですか?
- GateIO フューチャー利用総和
- 4.3 パイソン言語の使い方
- 4.2 JavaScript 言語で戦略的取引を実装する方法
- Python3のネイティブ回帰システムを構築するにはどうすればいいですか?
- 4.1 JavaScript 言語の早いスタート
- 3.5 ビジュアル プログラミング言語 取引戦略の実施
- GetTicker (ゲットティッカー) が取得したデータは何故空っぽなのかお尋ねください
- 3.4 視覚プログラミングの早い開始
- 3.3 M言語での戦略の実施方法