初心者向け暗号通貨量的な取引 - 暗号通貨量的な取引に近づく (5)
作者: リン・ハーンリディア, 作成日:2022-08-03 16:08:50, 更新日:2023-09-21 21:07:02
この記事では,このチュートリアル戦略の設計を完了していきます. このトチュートリアルでは,この戦略の設計を完了します.
-
取引論理分析 前回の記事で述べたように,各グリッドラインを横切って,現在の価格の横断を上下判断することで,トレードアクションを起動できます. しかし,実際には,まだ多くの論理の詳細があり,戦略書き方を理解していない初心者は,論理が非常に単純で,コードは数行しかならず,実際の書き方にはまだ多くの詳細があるという誤解を招く傾向があります.
無限格子の設計です. 式を設計したのを覚えていますか?
createNetこの関数は,グリッドデータ構造を有限数のグリッドラインで生成します. 戦略が実行されているときに価格がこのグリッドデータ構造の境界を超えた場合 (価格が最も高い上方グリッドラインと,価格が最も低い下方グリッドラインを超えて) はどうでしょうか? まず格子データ構造に拡張メカニズムを追加する必要があります戦略が実行開始するコードです. 戦略の実行を開始するコードです.
var diff = 50                                 // Global variables and grid spacing can be designed as parameters for easy explanation. We write this parameter into the code.
function main() {
    // After the real bot starts running, execute the strategy code from here
    var ticker = _C(exchange.GetTicker)       // To get the latest market data ticker, please refer to the FMZ API documentation for the structure of the ticker data: https://www.fmz.com/api#ticker
    var net = createNet(ticker.Last, diff)    // The function we designed in the previous article to construct the grid data structure initially, here we construct a grid data structure net

    while (true) {                            // Then the program logic enters this while infinite loop, and the strategy execution will continue to execute the code within the {} symbol here.
        ticker = _C(exchange.GetTicker)       // The first line of the infinite loop code section, get the latest market data and update it to the ticker variable
        // Check the grid range
        while (ticker.Last >= net[net.length - 1].price) {
            net.push({
                buy : false,
                sell : false,
                price : net[net.length - 1].price + diff,
            })
        }
        while (ticker.Last <= net[0].price) {
            var price = net[0].price - diff
            if (price <= 0) {
                break
            }
            net.unshift({
                buy : false,
                sell : false,
                price : price,
            })
        }

        // There are other codes...
    }
}
格子データ構造を拡張可能にするのは,次のコード (上記コードから抜粋):
      // Check the grid range
      while (ticker.Last >= net[net.length - 1].price) {   // If the price exceeds the grid line of the highest price of the grid
          net.push({                                       // Just add a new grid line after the grid line with the highest price of the grid
              buy : false,                                 // Initialize sell marker
              sell : false,                                // Initialize buy marker
              price : net[net.length - 1].price + diff,    // dd a grid spacing to the previous highest price
          })
      }
      while (ticker.Last <= net[0].price) {                // If the price is lower than the grid line of the lowest price of the grid
          var price = net[0].price - diff                  // Different from adding upwards, it should be noted that the price of adding new grid lines downwards cannot be less than or equal to 0, so it is necessary to judge here
          if (price <= 0) {                                // Less than or equal to 0 will not be added, jump out of this loop
              break
          }
          net.unshift({                                    // Add a new grid line just before the grid line with the lowest price of the grid
              buy : false,
              sell : false,
              price : price,
          })
      }
次のステップは,取引トリガーを具体的にどのように実装するか検討することです.
var diff = 50
var amount = 0.002       // Add a global variable, which can also be designed as a parameter. Of course, for the sake of simplicity, we also write it in the strategy code.
                         // This parameter controls the trade volume each time a trade is triggered on the grid line
function main() {
    var ticker = _C(exchange.GetTicker)
    var net = createNet(ticker.Last, diff)
    var preTicker = ticker       // Before the main loop (fixed loop) starts, set a variable to record the last market data
    while (true) {
        ticker = _C(exchange.GetTicker)
        // Check the grid range
        while (ticker.Last >= net[net.length - 1].price) {
            net.push({
                buy : false,
                sell : false,
                price : net[net.length - 1].price + diff,
            })
        }
        while (ticker.Last <= net[0].price) {
            var price = net[0].price - diff
            if (price <= 0) {
                break
            }
            net.unshift({
                buy : false,
                sell : false,
                price : price,
            })
        }

        // Retrieve grid
        for (var i = 0 ; i < net.length ; i++) {     // Iterate over all grid lines in the grid data structure
            var p = net[i]
            if (preTicker.Last < p.price && ticker.Last > p.price) {         // Above the SMA, sell, the current node has already traded, regardless of SELL BUY, it will no longer be traded
                if (i != 0) {
                    var downP = net[i - 1]
                    if (downP.buy) {
                        exchange.Sell(-1, amount, ticker)
                        downP.buy = false
                        p.sell = false
                        continue
                    }
                }
                if (!p.sell && !p.buy) {
                    exchange.Sell(-1, amount, ticker)
                    p.sell = true
                }
            } else if (preTicker.Last > p.price && ticker.Last < p.price) {  // Below the SMA, buy
                if (i != net.length - 1) {
                    var upP = net[i + 1]
                    if (upP.sell) {
                        exchange.Buy(-1, amount * ticker.Last, ticker)
                        upP.sell = false
                        p.buy = false
                        continue
                    }
                }
                if (!p.buy && !p.sell) {
                    exchange.Buy(-1, amount * ticker.Last, ticker)
                    p.buy = true
                }
            }
        }
        preTicker = ticker    // Record the current market data in preTicker, and in the next cycle, use it as a comparison between the "previous" market data and the latest one to judge whether to be above the SMA or below the SMA.
        Sleep(500)
    }
}
明らかに,
- 格子線上を横断する条件:
preTicker.Last < p.price && ticker.Last > p.price - 格子線下を横断する条件:
preTicker.Last > p.price && ticker.Last < p.price
前回の投稿でこう言いました
- 格子線上を横断する条件:
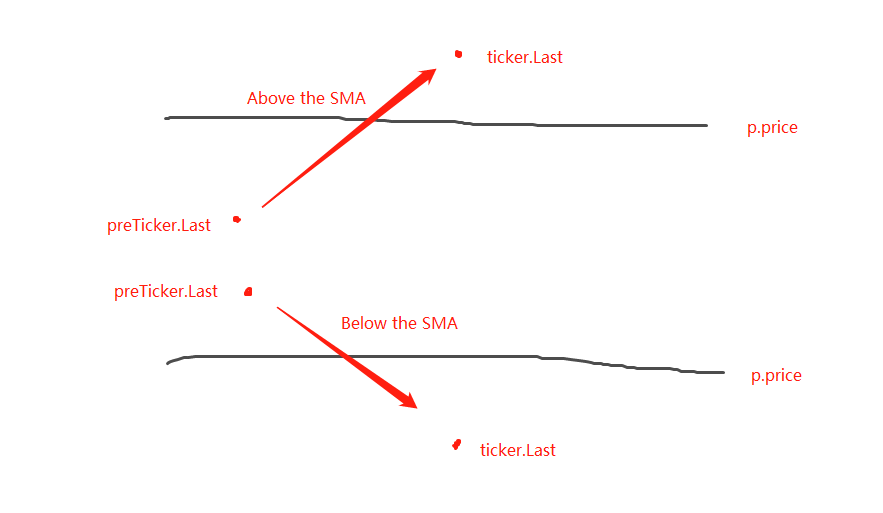
SMA以上または SMA以下であるかどうかを判断することは,注文が行われることを判断する最初のステップに過ぎず,グリッドラインデータのマークも判断する必要があります.
価格がSMA以上である場合,現在のグリッドラインと,最も近いグリッドラインの購入マークよりも低いと判断されます. 購入マークの値が真であれば,以前のグリッドラインが購入され,以前の購入マークを false にリセットし,現在のグリッドラインの販売マークを false にリセットすることを意味します.
条件を判断した後,トリガーがない場合は判断を続けます.現在のグリッドラインの買い/売るマークが両方とも偽である場合,現在のグリッドラインが取引可能であることを意味します.SMAよりも上にあるため,ここで販売操作を実行します.実行後,現在のグリッドラインの販売マークを true とマークします.
処理論理は SMA の下に同じです (初心者が考えるようにここに残ります)
戦略のバックテストを完了
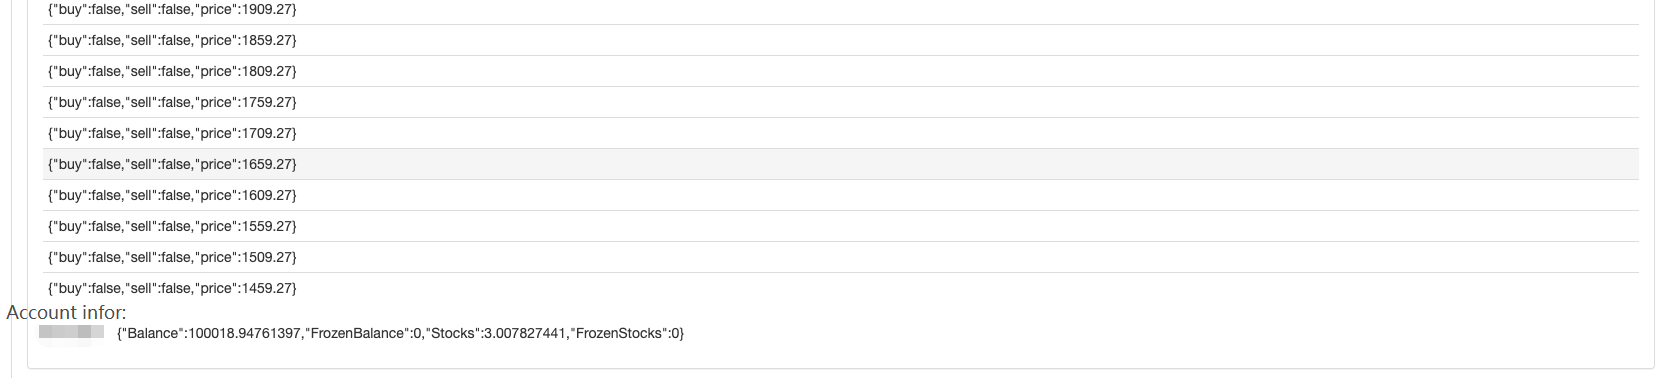
バックテスト中にいくつかのデータを表示するために,関数showTblデータを表示するために書かれています
function showTbl(arr) {
    var tbl = {
        type : "table",
        title : "grid",
        cols : ["grid information"],
        rows : []
    }
    var arrReverse = arr.slice(0).reverse()
    _.each(arrReverse, function(ele) {
        var color = ""
        if (ele.buy) {
            color = "#FF0000"
        } else if (ele.sell) {
            color = "#00FF00"
        }
        tbl.rows.push([JSON.stringify(ele) + color])
    })
    LogStatus(_D(), "\n`" + JSON.stringify(tbl) + "`", "\n account Information:", exchange.GetAccount())
}
完全な戦略コード:
/*backtest
start: 2021-04-01 22:00:00
end: 2021-05-22 00:00:00
period: 1d
basePeriod: 1m
exchanges: [{"eid":"OKEX","currency":"ETH_USDT","balance":100000}]
*/

var diff = 50
var amount = 0.002
function createNet(begin, diff) {
    var oneSideNums = 10
    var up = []
    var down = []
    for (var i = 0 ; i < oneSideNums ; i++) {
        var upObj = {
            buy : false,
            sell : false,
            price : begin + diff / 2 + i * diff,
        }
        up.push(upObj)

        var j = (oneSideNums - 1) - i
        var downObj = {
            buy : false,
            sell : false,
            price : begin - diff / 2 - j * diff,
        }
        if (downObj.price <= 0) {  // The price cannot be less than or equal to 0
            continue
        }
        down.push(downObj)
    }

    return down.concat(up)
}

function showTbl(arr) {
    var tbl = {
        type : "table",
        title : "grid",
        cols : ["grid Information"],
        rows : []
    }
    var arrReverse = arr.slice(0).reverse()
    _.each(arrReverse, function(ele) {
        var color = ""
        if (ele.buy) {
            color = "#FF0000"
        } else if (ele.sell) {
            color = "#00FF00"
        }
        tbl.rows.push([JSON.stringify(ele) + color])
    })
    LogStatus(_D(), "\n`" + JSON.stringify(tbl) + "`", "\n account Information:", exchange.GetAccount())
}

function main() {
    var ticker = _C(exchange.GetTicker)
    var net = createNet(ticker.Last, diff)
    var preTicker = ticker
    while (true) {
        ticker = _C(exchange.GetTicker)
        // Check the grid range
        while (ticker.Last >= net[net.length - 1].price) {
            net.push({
                buy : false,
                sell : false,
                price : net[net.length - 1].price + diff,
            })
        }
        while (ticker.Last <= net[0].price) {
            var price = net[0].price - diff
            if (price <= 0) {
                break
            }
            net.unshift({
                buy : false,
                sell : false,
                price : price,
            })
        }

        // Retrieve grid
        for (var i = 0 ; i < net.length ; i++) {
            var p = net[i]
            if (preTicker.Last < p.price && ticker.Last > p.price) {         // Being above the SMA, sell, the current node has already traded, regardless of SELL BUY, it will no longer be traded
                if (i != 0) {
                    var downP = net[i - 1]
                    if (downP.buy) {
                        exchange.Sell(-1, amount, ticker)
                        downP.buy = false
                        p.sell = false
                        continue
                    }
                }
                if (!p.sell && !p.buy) {
                    exchange.Sell(-1, amount, ticker)
                    p.sell = true
                }
            } else if (preTicker.Last > p.price && ticker.Last < p.price) {  // Being below the SMA, buy
                if (i != net.length - 1) {
                    var upP = net[i + 1]
                    if (upP.sell) {
                        exchange.Buy(-1, amount * ticker.Last, ticker)
                        upP.sell = false
                        p.buy = false
                        continue
                    }
                }
                if (!p.buy && !p.sell) {
                    exchange.Buy(-1, amount * ticker.Last, ticker)
                    p.buy = true
                }
            }
        }

        showTbl(net)
        preTicker = ticker
        Sleep(500)
    }
}
戦略のバックテスト
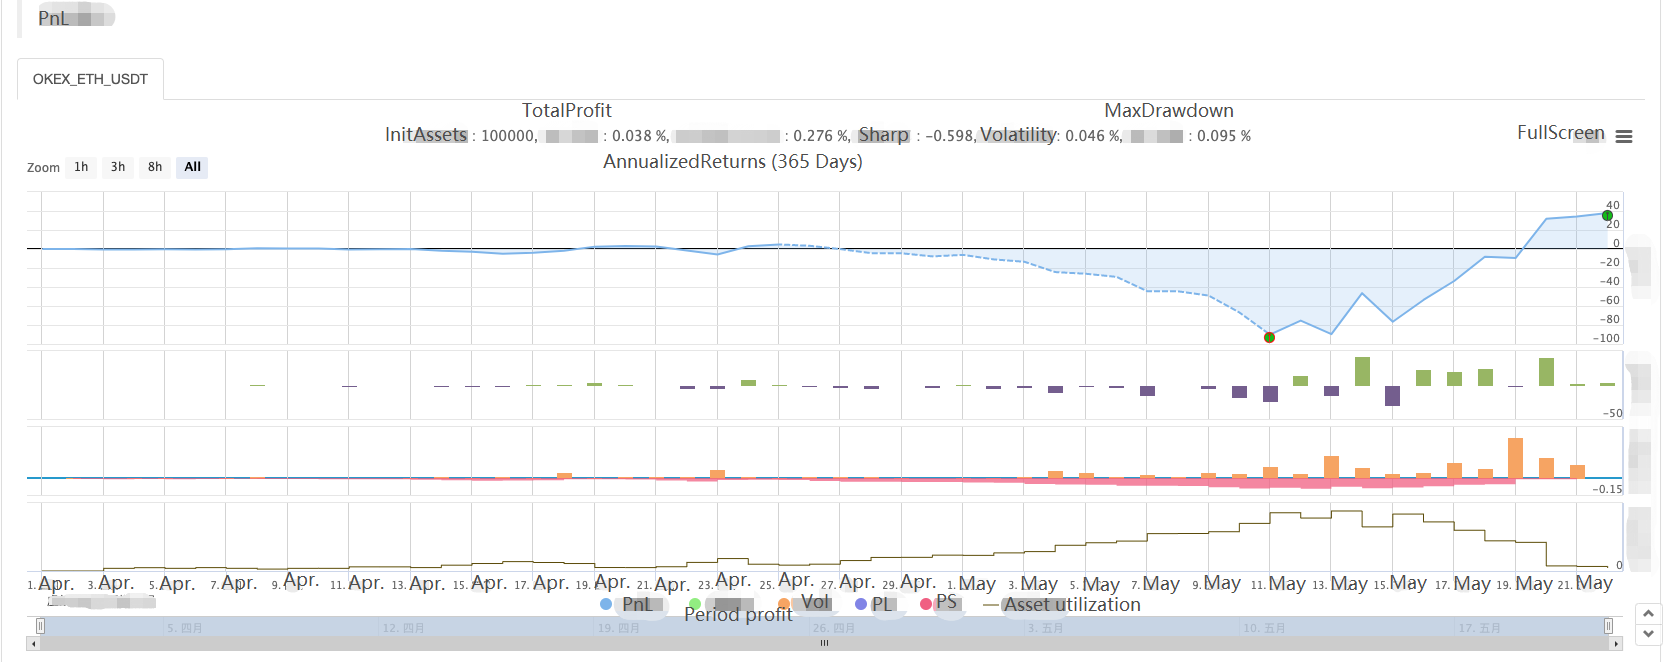
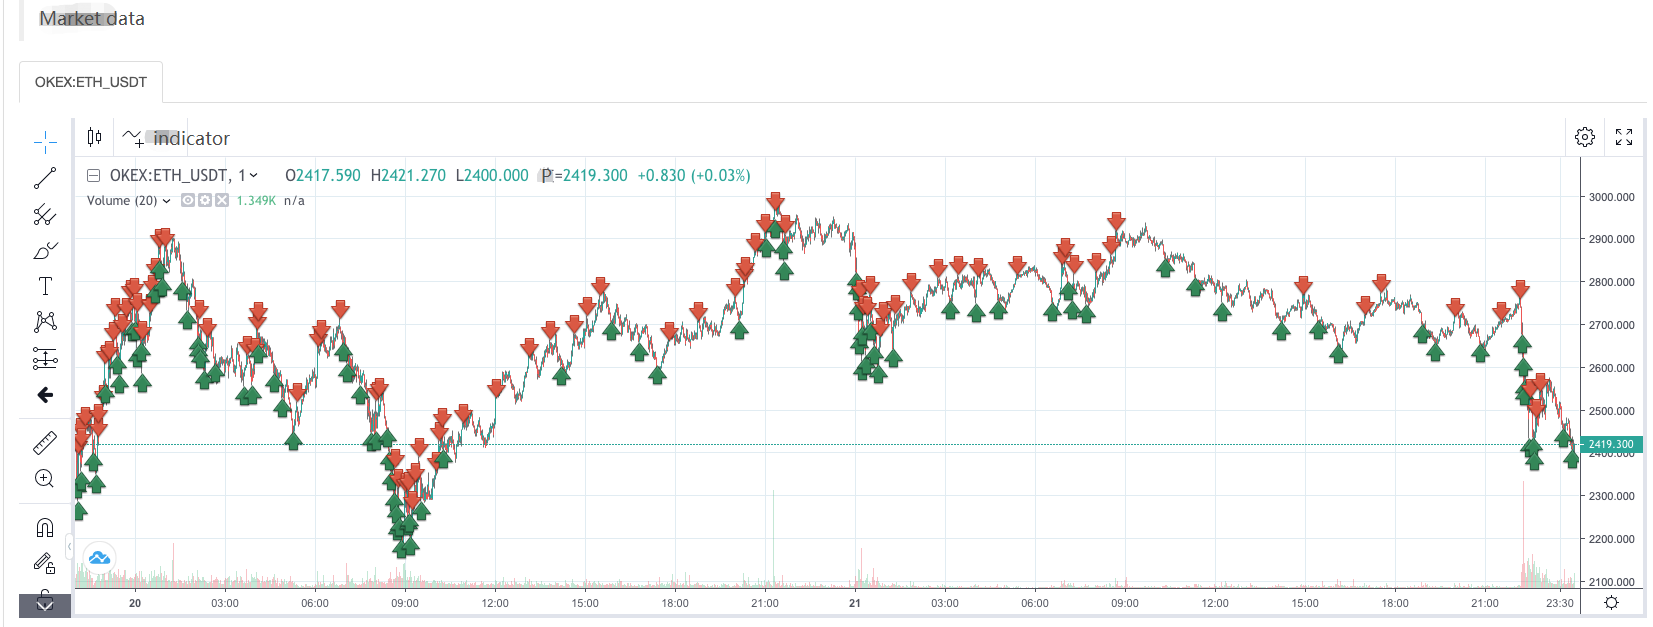
市場が動いているとき 大きな浮動損失があり 利益は不安定な市場で反発します 市場が動いているとき 大きな浮動損失があり 利益が反発します
したがって,グリッド戦略はリスクのないものではありません.スポット戦略は依然として
- 暗号通貨市場の基本分析を定量化する: データが自分で話せ!
- 通貨圏の基礎的な定量化研究 - 数字を客観的に話すために,あらゆる
教師を信頼しなくていい! - 量化取引の必須ツール - 発明者による量化データ探索モジュール
- すべてをマスターする - FMZの新バージョンの取引ターミナルへの紹介 (TRB仲裁ソースコード)
- FMZの新バージョンの取引端末のご紹介 (TRBの利息ソースコード追加)
- FMZ Quant: 仮想通貨市場における共通要件設計例の分析 (II)
- 80行のコードで高周波戦略で 脳のない販売ボットを利用する方法
- FMZ定量化:仮想通貨市場の常用需要設計事例解析 (II)
- 80行コードの高周波戦略で脳のないロボットを搾取して売る方法
- FMZ Quant: 仮想通貨市場における共通要件設計例の分析 (I)
- FMZ定量化:仮想通貨市場の常用需要設計事例解析 (1)