"OKEXの先物取引のヘッジ戦略のC++バージョン"で 硬い定量戦略を紹介します
作者: リン・ハーン優しさ, 作成日:2019-08-29 16:05:07, 更新日:2023-11-07 20:53:27
ヘージング戦略について言えば,さまざまな市場には様々な種類,多様な組み合わせ,多様なアイデアがあります.我々は最も古典的な間間ヘージングからヘージング戦略のデザインアイデアと概念を探索します.今日,暗号通貨市場は最初よりもはるかに活発であり,また,仲介ヘージングの機会をたくさん提供する多くの先物契約取引所もあります.スポットクロスマーケット・アービタージ,キャッシュ・ヘージング・アービタージ,先物間間間間間間 arbitrage,先物間間市場 arbitrageなど,暗号定量取引戦略が一つずつ出現しています.C++で書かれた
戦略の原則
戦略はC++で書かれているため,戦略読み方が少し難しいため,なぜ戦略が少しハードコアなのか.しかし,読者がこの戦略のデザインとアイデアの本質を学ぶことを妨げない.戦略論理は比較的シンプルで,コード長さは中程度で,わずか500行です.市場データ取得の観点から,
戦略構造は合理的であり,コード結合度は非常に低く,拡張または最適化するのが便利である.論理は明確であり,そのようなデザインは理解しやすいだけでなく,教材としてこの戦略の設計を学ぶことも良い例である.この戦略の原則は比較的シンプルである.すなわち,先行契約と最近の契約のスプレッドが正または否定的であるか?基本的な原則は,商品先物間の時間間のヘッジと一致している.
- ポジティブ・スプレッド ショート・フォワード・コントラクトの販売 長期・最近のコントラクトの購入
- 負のスプレッドで 長期先行契約を買い 近年の契約を短売り
基本原理を理解した後,残りは,戦略がヘッジのオープニングポジションを起動する方法,ポジションを閉じる方法,ポジションを追加する方法,総ポジション制御方法,その他の戦略の詳細処理です.
ヘージング戦略は主に対象価格差 (スプレッド) の変動とその回帰に関わります.しかし,差はわずかに変動するか,急激に振動するか,または1つの方向に振舞う可能性があります.
これは,利益と損失のヘッジに関する不確実性をもたらしますが,リスクは一方的なトレンドよりもまだはるかに小さいです. インターテンポラル戦略のさまざまな最適化のために,ポジション制御レベルと開閉・閉じるトリガー条件からスタートすることを選択できます. 例えば,価格変動を決定するために,古典的な
戦略コードの分析
このコードは4つの部分に分かれています このコードは
-
値定義をリストし,いくつかの状態値を定義し,状態をマークするために使用する. urlエンコーディング機能,時間変換機能など,戦略に関連していないいくつかの機能は,データ処理のための戦略論理とは関係ありません.
-
K線データ生成器クラス:この戦略は,生成器クラスオブジェクトによって生成されるK線データによって動かす.
-
ヘージングクラス:このクラスのオブジェクトは,特定の取引論理,ヘージングオペレーション,戦略の処理詳細を実行することができます.
-
戦略の主な機能は,
main 関数である. 主な機能は戦略の入力機能である. 主なループはこの関数の内部で実行される. さらに,この機能は重要な操作も実行する.つまり,取引所のウェブソケットインターフェースにアクセスし,Kラインデータジェネレーターとしてプッシュされた生ティック市場データを取得する.
戦略コードの全体的な理解を通じて 戦略の様々な側面を徐々に学び 次に戦略のデザインやアイデアやスキルを研究することができます
- 列挙値の定義,他の機能機能
- 列挙されたタイプ
State声明
enum State {                    // Enum type defines some states
    STATE_NA,                   // Abnormal state
    STATE_IDLE,                 // idle
    STATE_HOLD_LONG,            // holding long positions
    STATE_HOLD_SHORT,           // holding short positions
};
この状態は,数値型で定義されます.State.
その姿を見てSTATE_NAコードに表示されるのは異常でSTATE_IDLE稼働していない状態,つまり 稼働状態がカバーできる状態です.STATE_HOLD_LONGポジティブなヘッジポジションが保持されている状態です.STATE_HOLD_SHORT負のヘッジポジションが保持されている状態です.
- この戦略では呼び出されていない文字列置き換えは,主に文字列を扱う代替ユーティリティ関数です.
string replace(string s, const string from, const string& to)
- ヘクサデシマル文字に変換する関数
toHex
inline unsigned char toHex(unsigned char x)
- urlコード関数を処理する
std::string urlencode(const std::string& str)
- 文字列形式の時間をタイムスタンプに変換する時間変換関数.
uint64_t _Time(string &s)
- K線データ生成器クラス
class BarFeeder { // K line data generator class
    public:
        BarFeeder(int period) : _period(period) { // constructor with argument "period" period, initialized in initialization list
            _rs.Valid = true; // Initialize the "Valid" property of the K-line data in the constructor body.
        }

        void feed(double price, chart *c=nullptr, int chartIdx=0) { // input data, "nullptr" null pointer type, "chartIdx" index default parameter is 0
            uint64_t epoch = uint64_t(Unix() / _period) * _period * 1000; // The second-level timestamp removes the incomplete time period (incomplete _period seconds) and is converted to a millisecond timestamp.
            bool newBar = false; // mark the tag variable of the new K line Bar
            if (_rs.size() == 0 || _rs[_rs.size()-1].Time < epoch) { // if the K line data is 0 in length. Or the last bar's timestamp is less than epoch (the last bar of the K line is more than the current most recent cycle timestamp)
                record r; // declare a K line bar structure
                r.Time = epoch; // construct the K line bar of the current cycle
                r.Open = r.High = r.Low = r.close = price; // Initialize the property
                _rs.push_back(r); // K line bar is pressed into the K line data structure
                if (_rs.size() > 2000) { // if the K-line data structure length exceeds 2000, the oldest data is removed.
                    _rs.erase(_rs.begin());
                }
                newBar = true; // tag
            } else { // In other cases, it is not the case of a new bar.
                record &r = _rs[_rs.size() - 1]; // Reference the data of the last bar in the data.
                r.High = max(r.High, price); // The highest price update operation for the referenced data.
                r.Low = min(r.Low, price); // The lowest price update operation for the referenced data.
                r.close = price; // Update the closing price of the referenced data.
            }

            auto bar = _rs[_rs.size()-1]; // Take the last column data and assign it to the bar variable
            json point = {bar.Time, bar.Open, bar.High, bar.Low, bar.close}; // construct a json type data
            if (c != nullptr) { // The chart object pointer is not equal to the null pointer, do the following.
               if (newBar) { // judge if the new Bar appears
                    c->add(chartIdx, point); // call the chart object member function add to insert data into the chart object (new k line bar)
                    c->reset(1000); // retain only 1000 bar of data
                } else {
                    c->add(chartIdx, point, -1); // Otherwise update (not new bar), this point (update this bar).
                }
            }
        }
        records & get() { // member function, method for getting K line data.
            Return _rs; // Returns the object's private variable _rs . (ie generated K-line data)
        }
    private:
        int _period;
        records _rs;
};
このクラスは,主に,戦略ヘッジ論理を動かすために,取得されたティックデータを差K線に処理する責任があります.
ティックデータをなぜ使うのか?なぜK線データジェネレータをこのように構築するのか?K線データを直接使うのは良いことではないのか?この種の質問は3回の爆発で発行されています.いくつかのヘッジ戦略を書いたとき,私は騒ぎも起こしました.私は
2つの契約間の差のK線データは,一定の期間の差値変化統計である.したがって,単に2つの契約のそれぞれのK線データを引くために取り,各K線バー上の各データの差を計算することは不可能である.最も明らかな誤りは,例えば,必ずしも同時に2つの契約の最高価格と最低価格である.したがって,引いた値はあまり意味がない.
したがって,リアルタイムで差を計算し,リアルタイムで特定の期間の価格変化 (つまり,K線列の最高,最低,オープン,閉鎖価格) を計算するために,リアルタイムでティックデータを使用する必要があります.
- 負債の負債の負債
class Hedge { // Hedging class, the main logic of the strategy.
  public:
    Hedge() { // constructor
        ...
    };

    State getState(string &symbolA, depth &depthA, string &symbolB, depth &depthB) { // Get state, parameters: contract A name, contract A depth data, contract B name, contract B depth data

        ...
    }
    bool Loop(string &symbolA, depth &depthA, string &symbolB, depth &depthB, string extra="") { // Opening and closing position main logic

        ...
    }

  private:
    vector<double> _addArr; // Hedging adding position list
    string _state_desc[4] = {"NA", "IDLE", "LONG", "SHORT"}; // Status value Description
    int _countOpen = 0; // number of opening positions
    int _countcover = 0; // number of closing positions
    int _lastcache = 0; //
    int _hedgecount = 0; // number of hedging
    int _loopcount = 0; // loop count (cycle count)
    double _holdPrice = 0; // holding position price
    BarFeeder _feederA = BarFeeder(DPeriod); // A contract Quote K line generator
    BarFeeder _feederB = BarFeeder(DPeriod); // B contract Quote K line generator
    State _st = STATE_NA; // Hedging type Object Hedging position status
    string _cfgStr; // chart configuration string
    double _holdAmount = 0; // holding position amount
    bool _iscover = false; // the tag of whether to close the position
    bool _needcheckOrder = true; // Set whether to check the order
    chart _c = chart(""); // chart object and initialize
};
コードが比較的長いため,いくつかの部分は省略されています.これは主にこのヘッジクラスの構造を示しています.コンストラクターヘッジ関数は省略されています.主にオブジェクト初期化の目的です.次に,2つの主要な
getState を取得する
この機能は,主にオーダー検査,オーダーキャンセル,ポジション検出,ポジションバランスなどに対応する.ヘジング取引の過程で,単一のステップ (つまり,契約が実行され,もう1つは実行されない) を回避することは不可能であるため,配置オーダー論理で審査が行われ,その後再送信オーダー操作または閉じるポジション操作の処理は,戦略論理は混沌とします.
一歩のヘッジがあるかどうかに関わらず,デフォルトはヘッジが成功し,その後ポジションバランスが検出されます. 取引は,取引先で実行されます. 取引は,取引先で実行されます.getStateバランスの処理の論理は独立して処理されます.
ループ
戦略の取引ロジックは,この関数に収められています.getState差のK線データを生成するために,K線データ生成物 (K-line data generator object) が呼ばれ,開封,閉封,位置論理の追加判断が実行されます.また,チャートのためのいくつかのデータ更新操作があります.
- 戦略の主な機能
void main() {

    ...

    string realSymbolA = exchange.SetcontractType(symbolA)["instrument"]; // Get the A contract (this_week / next_week / quarter ), the real contract ID corresponding to the week, next week, and quarter of the OKEX futures contract.
    string realSymbolB = exchange.SetcontractType(symbolB)["instrument"]; // ...

    string qs = urlencode(json({{"op", "subscribe"}, {"args", {"futures/depth5:" + realSymbolA, "futures/depth5:" + realSymbolB}}}).dump()) ; // jSON encoding, url encoding for the parameters to be passed on the ws interface
    Log("try connect to websocket"); // Print the information of the connection WS interface.
    auto ws = Dial("wss://real.okex.com:10442/ws/v3|compress=gzip_raw&mode=recv&reconnect=true&payload="+qs); // call the FMZ API "Dial" function to acess the WS interface of OKEX Futures
    Log("connect to websocket sucess");

    depth depthA, depthB; // Declare two variables of the depth data structure to store the depth data of the A contract and the B contract
    auto filldepth = [](json &data, depth &d) { // construct the code for the depth data with the json data returned by the interface.
        d.Valid = true;
        d.Asks.clear();
        d.Asks.push_back({atof(string(data["asks"][0][0]).c_str()), atof(string(data["asks"][0][1]).c_str( ))});
        d.Bids.clear();
        d.Bids.push_back({atof(string(data["bids"][0][0]).c_str()), atof(string(data["bids"][0][1]).c_str( ))});
    };
    string timeA; // time string A
    string timeB; // time string B
    while (true) {
        auto buf = ws.read(); // Read the data pushed by the WS interface

        ...

}
ストラテジーが起動された後,メイン機能から実行される.メイン機能の初期化では,戦略はウェブソケットインターフェイスのティックマーケットにサブスクリプトする.メイン機能の主な仕事は,取引所のウェブソケットインターフェイスによって押し出されたティック・コートを継続的に受信し,その後ヘッジクラスオブジェクトのメンバー関数:ループ関数を呼び出すメインループを構築することです.ループ関数の取引論理は市場データによって動きます.
上記に言及したティックマーケットは,実際には各ファイルのオーダーブックデータであるサブスクリプションオーダー薄深度データインターフェースである.しかし,この戦略は最初のデータファイルのみを使用し,実際には,ティックマーケットデータとほぼ同じです.この戦略は他のファイルのデータを使用せず,最初のファイルのオーダー値を使用しません.
Webソケットインターフェースのデータへの戦略のサブスクリプションと設定方法について詳しく見てみましょう.
string qs = urlencode(json({{"op", "subscribe"}, {"args", {"futures/depth5:" + realSymbolA, "futures/depth5:" + realSymbolB}}}).dump());
Log("try connect to websocket");
auto ws = Dial("wss://real.okex.com:10442/ws/v3|compress=gzip_raw&mode=recv&reconnect=true&payload="+qs);
Log("connect to websocket sucess");
登録されたインターフェースが送った json パラメータの url コード,つまり,payloadFMZ Quant プラットフォームの API インターフェース関数を呼び出すことですDial機能Dial接続の自動再接続 (サブスクリプションメッセージは依然として値を使用します) を設定します.qs文字列payloadこの関数を達成するには,パラメータ文字列に設定を追加する必要があります.Dial function.
初期にDial機能パラメータは次のとおりです.
wss://real.okex.com:10442/ws/v3
これはアクセスする必要がある Webソケットインターフェースのアドレスで,
compress=gzip_raw&mode=recv&reconnect=true&payload="+qs構成パラメータです
| パラメータ名 | 記述 |
|---|---|
| 圧縮する | gzip_raw に設定されているので, gzip_raw は gzip_raw に設定されています. |
| モード | モードはモード,オプションのデュアル,送信とリクヴ3種類.デュアルは二方向で,圧縮されたデータを送信し,圧縮されたデータを受信する.送信は圧縮されたデータを送信する.Recvは圧縮されたデータを受信し,ローカルで解圧する. |
| 再接続する | 再接続は再接続に設定され,再接続を有効にする reconnect=true,デフォルトでは再接続されません. |
| パイロード | 載荷はWSが再接続されたときに送られる サブスクリプションメッセージです |
この設定の後,Webソケット接続が切断された場合でも, FMZ Quant取引プラットフォームのドッカーシステムの基礎システムは自動的に再接続し,最新の市場データを間に合うようにします.
すべての価格変動を把握して 適切なヘッジを迅速に把握します
- 位置制御
for (int i = 0; i < AddMax + 1; i++) { // construct a data structure that controls the number of scalping, similar to the ratio of the Bofinac sequence to the number of hedges.
     if (_addArr.size() < 2) { // The first two added positions are changed as: double the number of hedges
         _addArr.push_back((i+1)*OpenAmount);
     }
     _addArr.push_back(_addArr[_addArr.size()-1] + _addArr[_addArr.size()-2]); // The last two adding positions are added together, and the current position quantity is calculated and stored in the "_addArr" data structure.
}
追加された各ポジションの数は,最後の2つのポジションの和であることがわかります.
このようなポジションコントロールは,差が大きいほど,相対的なアービタージ・ヘッジの増加とポジションの分散を認識し,小さな価格変動の小さなポジションを把握し,大きな価格変動のポジションを適切に増加させることができます.
- 閉じるポジション:ストップ・ロストと利益引き取り
固定ストップ・ロスト・スプレッドと 収益・セールス・スプレッド
ポジション差がメリットとストップ・ロスの位置に達すると,メリットとストップ・ロスは実行されます.
- 市場への参入と市場からの離脱の設計
パラメータの周期NPeriodコントロールは,戦略のオープニングと終了ポジションに対する一定のダイナミックなコントロールを提供します.
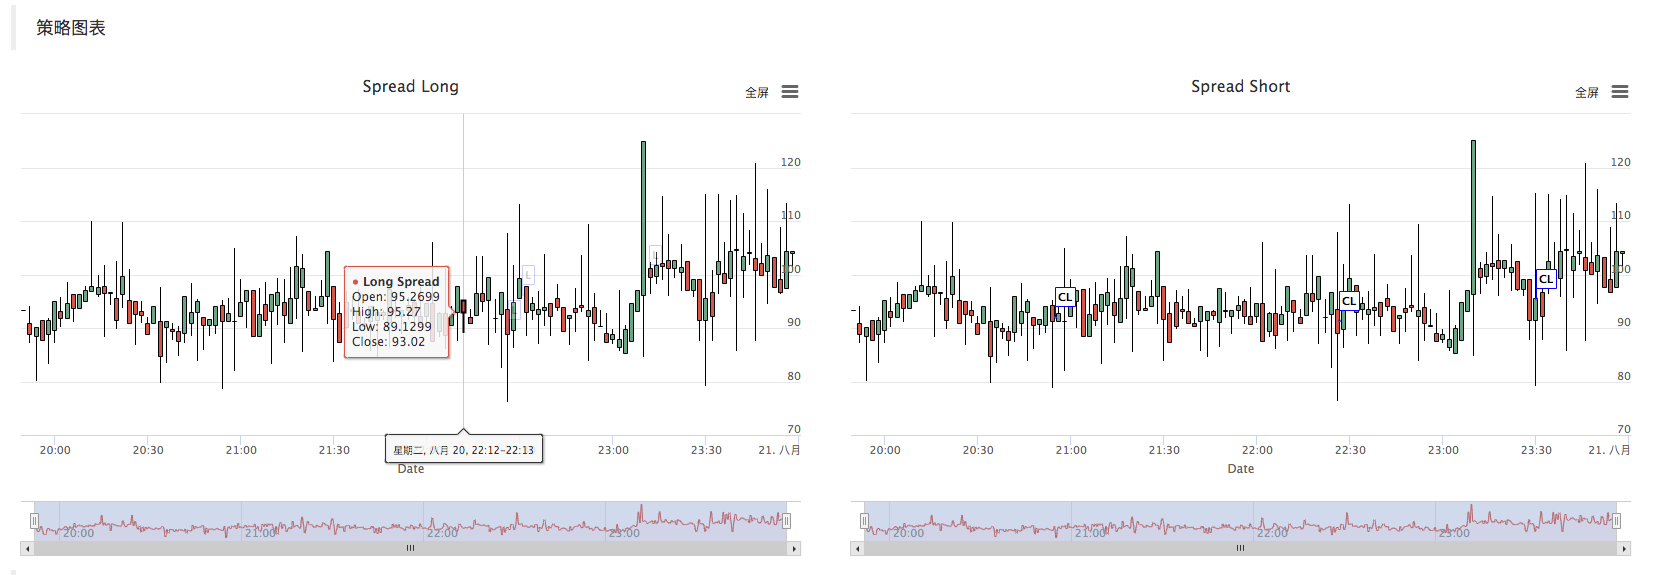
- 戦略図
戦略は自動的にスプレッドK線チャートを生成し,関連する取引情報をマークします.
設定文字列を使用します. 設定文字列は,この文字列の構成文字列を表示します._cfgStrチャートオブジェクトを設定する_c, _c初期化されると,この要素は,chartFMZ Quant プラットフォームで構築されたオブジェクトは,カスタムチャート API インターフェース機能で呼び出されます.
_cfgStr = R"EOF(
[{
"extension": { "layout": "single", "col": 6, "height": "500px"},
"rangeSelector": {"enabled": false},
"tooltip": {"xDateformat": "%Y-%m-%d %H:%M:%S, %A"},
"plotOptions": {"candlestick": {"color": "#d75442", "upcolor": "#6ba583"}},
"chart":{"type":"line"},
"title":{"text":"Spread Long"},
"xAxis":{"title":{"text":"Date"}},
"series":[
    {"type":"candlestick", "name":"Long Spread","data":[], "id":"dataseriesA"},
    {"type":"flags","data":[], "onSeries": "dataseriesA"}
    ]
},
{
"extension": { "layout": "single", "col": 6, "height": "500px"},
"rangeSelector": {"enabled": false},
"tooltip": {"xDateformat": "%Y-%m-%d %H:%M:%S, %A"},
"plotOptions": {"candlestick": {"color": "#d75442", "upcolor": "#6ba583"}},
"chart":{"type":"line"},
"title":{"text":"Spread Short"},
"xAxis":{"title":{"text":"Date"}},
"series":[
    {"type":"candlestick", "name":"Long Spread","data":[], "id":"dataseriesA"},
    {"type":"flags","data":[], "onSeries": "dataseriesA"}
    ]
}
]
)EOF";
_c.update(_cfgStr);                 // Update chart objects with chart configuration
_c.reset();                         // Reset chart data。
call _c.update(_cfgStr); Use _cfgStr to configure to the chart object.

call _c.reset(); to reset the chart data.
グラフにデータを挿入する必要があるとき,また,グラフのメンバー関数を呼び出します._c対象を直接,または参照の通過_c対象メンバー関数 (方法) を呼び出します_cグラフのデータを更新し,操作を挿入します.
例えば:
_c.add(chartIdx, {{"x", UnixNano()/1000000}, {"title", action}, {"text", format("diff: %f", opPrice)}, {"color", color}});
注文をすると,K線図をマークします.
次のように,K線を描くとき,チャートオブジェクトへの参照_cメンバー関数を呼び出すときにパラメータとして渡されます.feedについてBarFeeder class.
void feed(double price, chart *c=nullptr, int chartIdx=0)
公式パラメータはcについてfeed function.
json point = {bar.Time, bar.Open, bar.High, bar.Low, bar.close}; // construct a json type data
if (c != nullptr) { // The chart object pointer is not equal to the null pointer, do the following.
    if (newBar) { // judge if the new Bar appears
         c->add(chartIdx, point); // call the chart object member function "add" to insert data into the chart object (new k line bar)
         c->reset(1000); // only keep 1000 bar data
     } else {
         c->add(chartIdx, point, -1); // Otherwise update (not new bar), this point (update this bar).
     }
}
グラフに新しいK線バーデータを挿入します.addチャートオブジェクトのメンバー関数_c.
c->add(chartIdx, point);
バックテスト
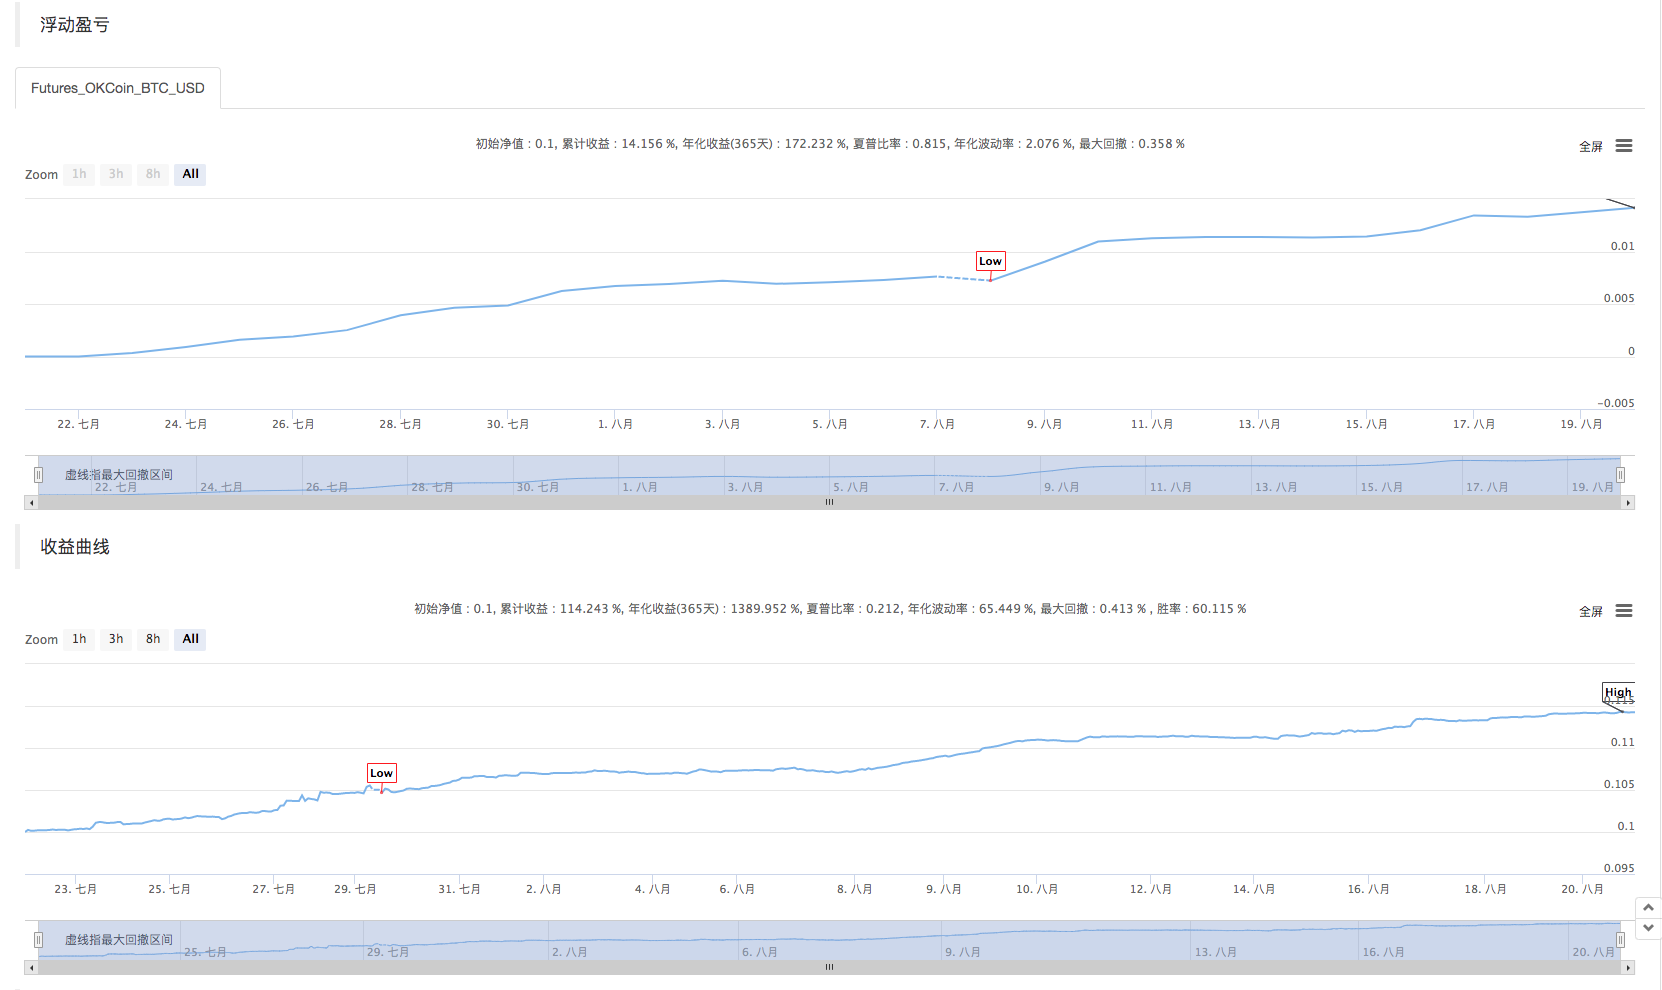

この戦略は,学習とコミュニケーションの目的のみです.実際の市場でそれを適用する場合は,市場の実際の状況に合わせて修正して最適化してください.
戦略アドレス:https://www.fmz.com/strategy/163447
興味深い戦略は FMZ Quant プラットフォームにあります":https://www.fmz.com
- 暗号通貨市場の基本分析を定量化する: データが自分で話せ!
- 通貨圏の基礎的な定量化研究 - 数字を客観的に話すために,あらゆる
教師を信頼しなくていい! - 量化取引の必須ツール - 発明者による量化データ探索モジュール
- すべてをマスターする - FMZの新バージョンの取引ターミナルへの紹介 (TRB仲裁ソースコード)
- FMZの新バージョンの取引端末のご紹介 (TRBの利息ソースコード追加)
- FMZ Quant: 仮想通貨市場における共通要件設計例の分析 (II)
- 80行のコードで高周波戦略で 脳のない販売ボットを利用する方法
- FMZ定量化:仮想通貨市場の常用需要設計事例解析 (II)
- 80行コードの高周波戦略で脳のないロボットを搾取して売る方法
- FMZ Quant: 仮想通貨市場における共通要件設計例の分析 (I)
- FMZ定量化:仮想通貨市場の常用需要設計事例解析 (1)