コモディティ・フューチャー・インターテンポラル・ボリンジャー・ヘッジ・ストラテジーの Python バージョン (研究目的のみ)
作者: リン・ハーン優しさ, 作成日:2020年6月20日 10:52:34, 更新日:2023年10月31日 21:05:21
前述した時間間仲介戦略では,開設・閉じるポジションのヘージング・スプレッドの手動入力が必要です.価格差を判断することはより主観的です.本記事では,以前のヘージング戦略をBOLL指標を使用してポジションを開設・閉じる戦略に変更します.
class Hedge:
    'Hedging control class'
    def __init__(self, q, e, initAccount, symbolA, symbolB, maPeriod, atrRatio, opAmount):
        self.q = q
        self.initAccount = initAccount
        self.status = 0
        self.symbolA = symbolA
        self.symbolB = symbolB
        self.e = e
        self.isBusy = False

        self.maPeriod = maPeriod
        self.atrRatio = atrRatio
        self.opAmount = opAmount
        self.records = []
        self.preBarTime = 0

    def poll(self):
        if (self.isBusy or not exchange.IO("status")) or not ext.IsTrading(self.symbolA):
            Sleep(1000)
            return

        insDetailA = exchange.SetContractType(self.symbolA)
        if not insDetailA:
            return

        recordsA = exchange.GetRecords()
        if not recordsA:
            return

        insDetailB = exchange.SetContractType(self.symbolB)
        if not insDetailB:
            return

        recordsB = exchange.GetRecords()
        if not recordsB:
            return

        # Calculate the spread price K line
        if recordsA[-1]["Time"] != recordsB[-1]["Time"]:
            return

        minL = min(len(recordsA), len(recordsB))
        rA = recordsA.copy()
        rB = recordsB.copy()

        rA.reverse()
        rB.reverse()
        count = 0

        arrDiff = []
        for i in range(minL):
            arrDiff.append(rB[i]["Close"] - rA[i]["Close"])
        arrDiff.reverse()
        if len(arrDiff) < self.maPeriod:
            return

        # Calculate Bollinger Bands indicator
        boll = TA.BOLL(arrDiff, self.maPeriod, self.atrRatio)

        ext.PlotLine("upper trail", boll[0][-2], recordsA[-2]["Time"])
        ext.PlotLine("middle trail", boll[1][-2], recordsA[-2]["Time"])
        ext.PlotLine("lower trail", boll[2][-2], recordsA[-2]["Time"])
        ext.PlotLine("Closing price spread", arrDiff[-2], recordsA[-2]["Time"])

        LogStatus(_D(), "upper trail:", boll[0][-1], "\n", "middle trail:", boll[1][-1], "\n", "lower trail:", boll[2][-1], "\n", "Current closing price spread:", arrDiff[-1])

        action = 0
        # Signal trigger
        if self.status == 0:
            if arrDiff[-1] > boll[0][-1]:
                Log("Open position A buy B sell", ", A latest price:", recordsA[-1]["Close"], ", B latest price:", recordsB[-1]["Close"], "#FF0000")
                action = 2
                # Add chart markers
                ext.PlotFlag(recordsA[-1]["Time"], "A buy B sell", "Positive")
            elif arrDiff[-1] < boll[2][-1]:
                Log("Open position A sell B buy", ", A latest price:", recordsA[-1]["Close"], ", B latest price:", recordsB[-1]["Close"], "#FF0000")
                action = 1
                # Add chart markers
                ext.PlotFlag(recordsA[-1]["Time"], "A sell B buy", "Negative")
        elif self.status == 1 and arrDiff[-1] > boll[1][-1]:
            Log("Close position A buy B sell", ", A latest price:", recordsA[-1]["Close"], ", B latest price:", recordsB[-1]["Close"], "#FF0000")
            action = 2
            # Add chart markers
            ext.PlotFlag(recordsA[-1]["Time"], "A buy B sell", "Close Negative")
        elif self.status == 2 and arrDiff[-1] < boll[1][-1]:
            Log("Close position A sell B buy", ", A latest price:", recordsA[-1]["Close"], ", B latest price:", recordsB[-1]["Close"], "#FF0000")
            action = 1
            # Add chart markers
            ext.PlotFlag(recordsA[-1]["Time"], "A sell B buy", "Close Positive")


        # Execute specific instructions
        if action == 0:
            return

        self.isBusy = True
        tasks = []
        if action == 1:
            tasks.append([self.symbolA, "sell" if self.status == 0 else "closebuy"])
            tasks.append([self.symbolB, "buy" if self.status == 0 else "closesell"])
        elif action == 2:
            tasks.append([self.symbolA, "buy" if self.status == 0 else "closesell"])
            tasks.append([self.symbolB, "sell" if self.status == 0 else "closebuy"])

        def callBack(task, ret):
            def callBack(task, ret):
                self.isBusy = False
                if task["action"] == "sell":
                    self.status = 2
                elif task["action"] == "buy":
                    self.status = 1
                else:
                    self.status = 0
                    account = _C(exchange.GetAccount)
                    LogProfit(account["Balance"] - self.initAccount["Balance"], account)
            self.q.pushTask(self.e, tasks[1][0], tasks[1][1], self.opAmount, callBack)

        self.q.pushTask(self.e, tasks[0][0], tasks[0][1], self.opAmount, callBack)


def main():
    SetErrorFilter("ready|login|timeout")
    Log("Connecting to the trading server...")
    while not exchange.IO("status"):
        Sleep(1000)

    Log("Successfully connected to the trading server")
    initAccount = _C(exchange.GetAccount)
    Log(initAccount)

    def callBack(task, ret):
        Log(task["desc"], "success" if ret else "failure")

    q = ext.NewTaskQueue(callBack)
    p = ext.NewPositionManager()
    if CoverAll:
        Log("Start closing all remaining positions...")
        p.CoverAll()
        Log("Operation complete")

    t = Hedge(q, exchange, initAccount, SA, SB, MAPeriod, ATRRatio, OpAmount)
    while True:
        q.poll()
        t.poll()
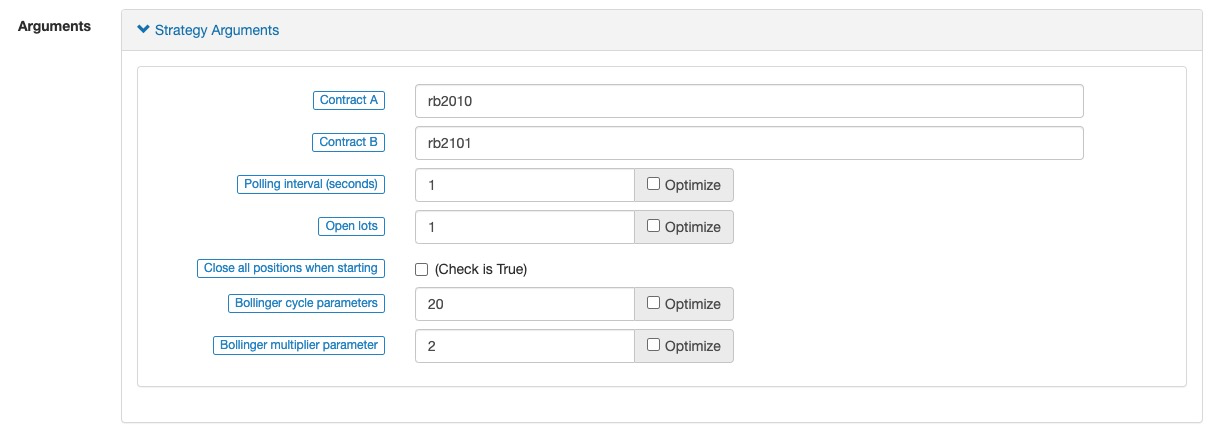
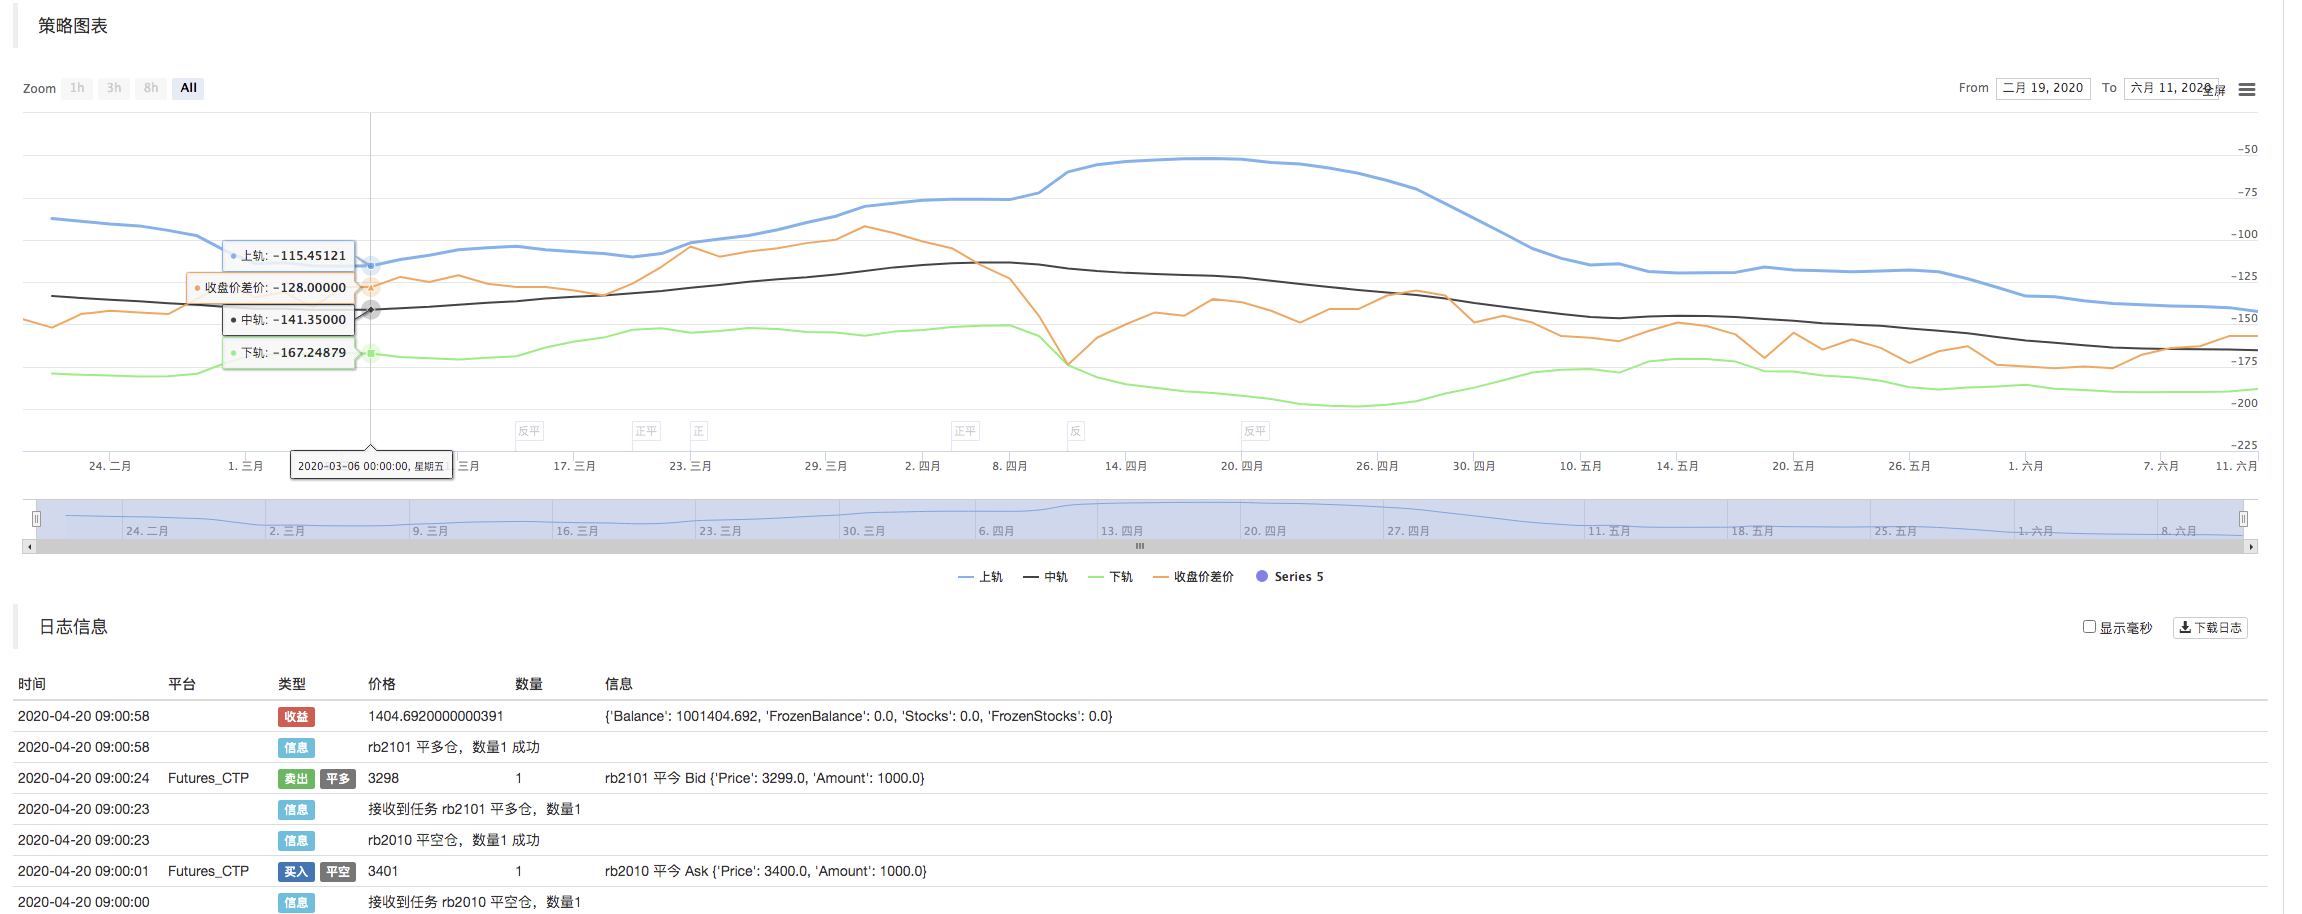
戦略パラメータ設定:
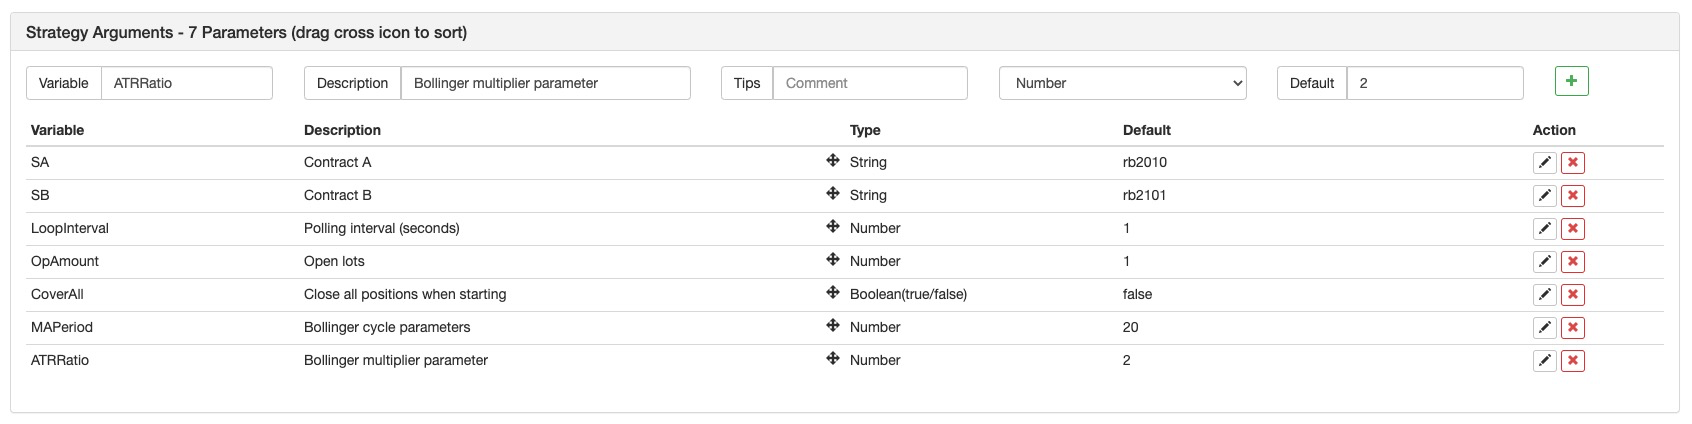
戦略の枠組みは基本的にコモディティ・フューチャー間の時間間のヘッジ戦略の Python バージョン戦略が実行されているとき,両契約のK線データは得られ,その後価格差はスプレッドを計算するために計算されます.配列は,SPREDのデータとして使用されます.TA.BOLLBollinger Bands を計算する関数です.スプレッドがBollinger Band
バックテスト:
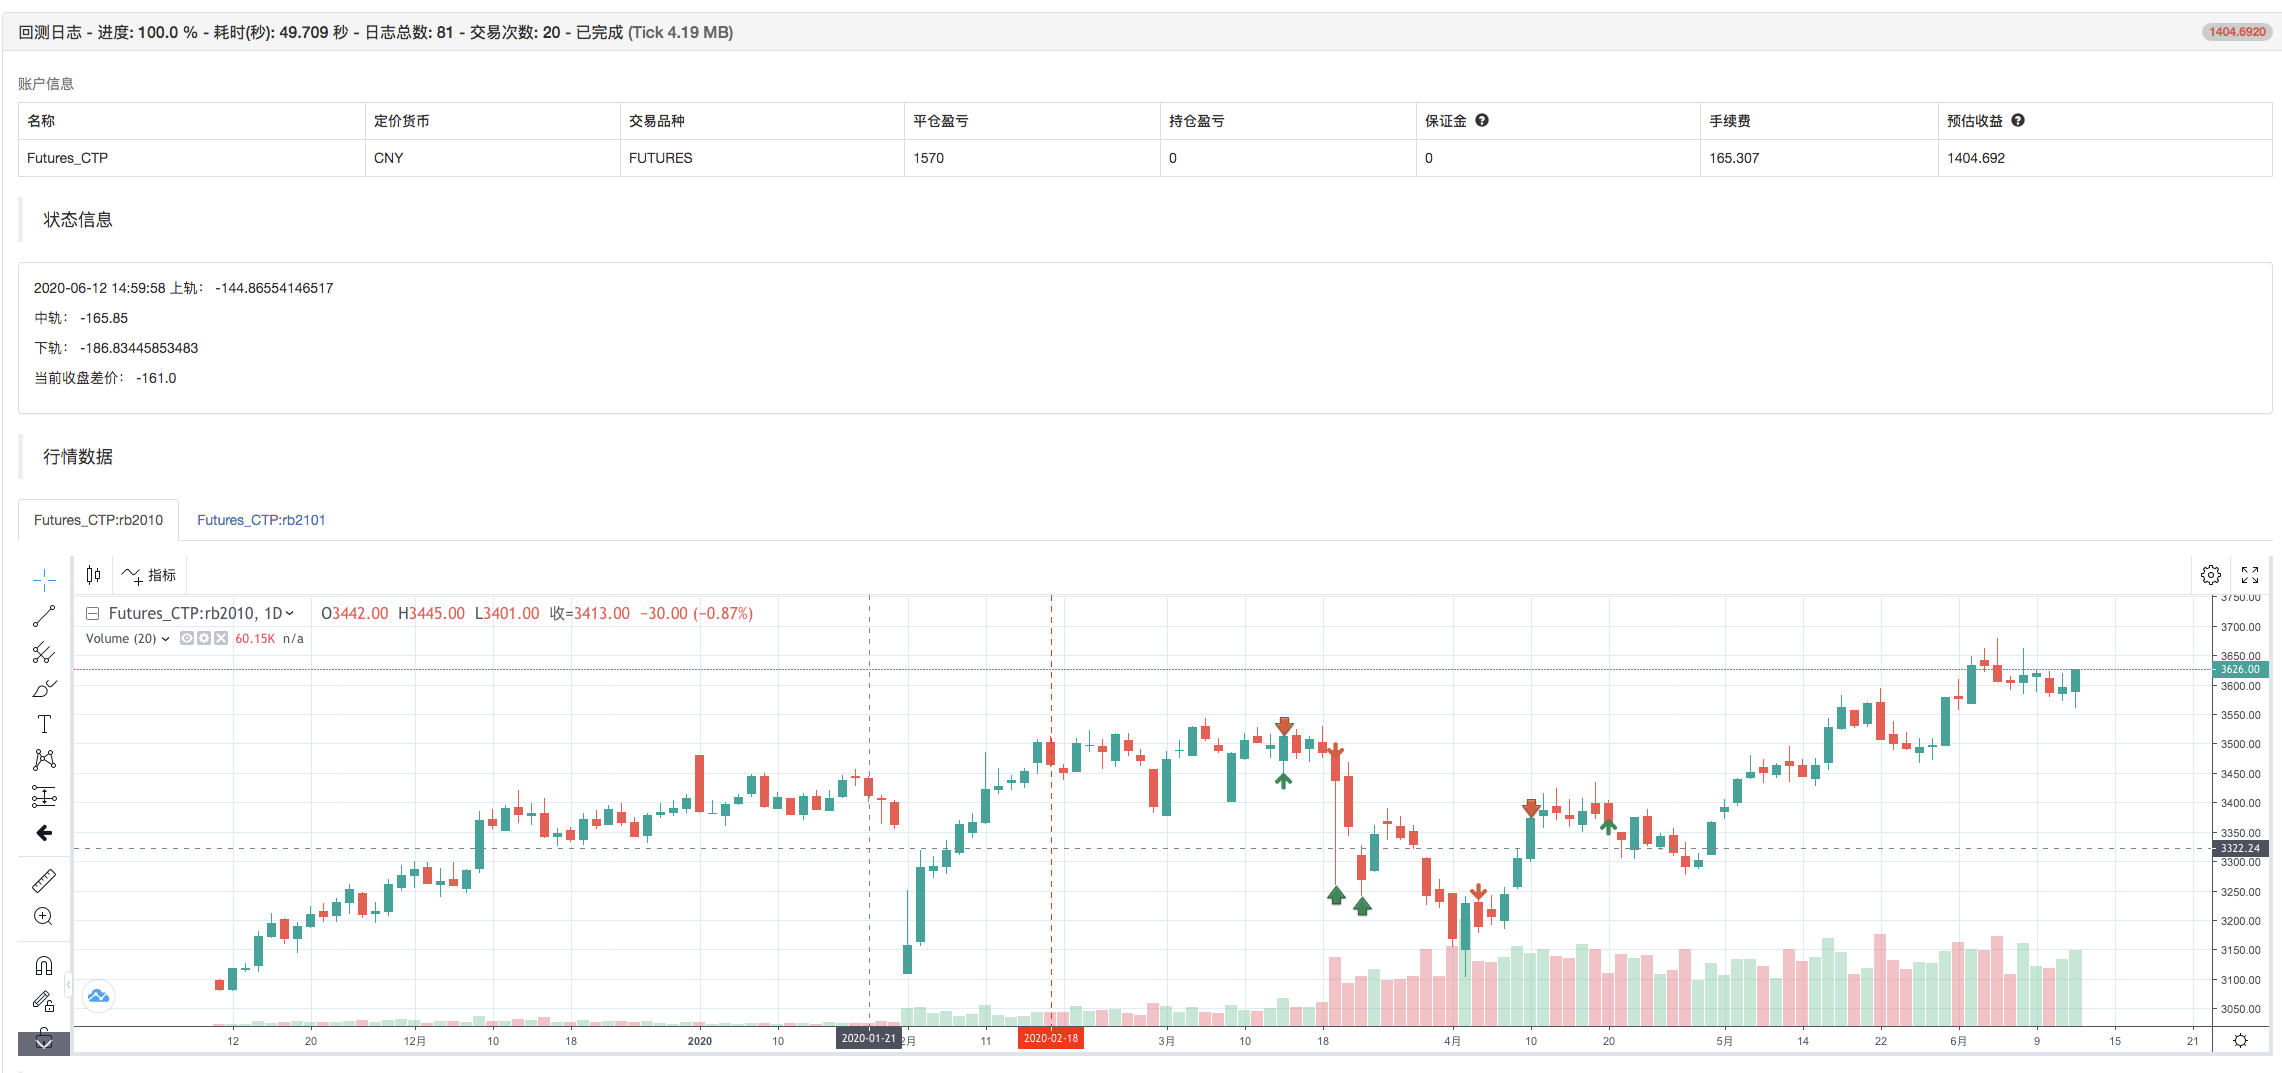
この 記事 は 主 に 研究 目的 で のみ 用い られ て い ます. 完全な戦略:https://www.fmz.com/strategy/213826
関連性
- 暗号通貨市場の基本分析を定量化する: データが自分で話せ!
- 通貨圏の基礎的な定量化研究 - 数字を客観的に話すために,あらゆる
教師を信頼しなくていい! - 量化取引の必須ツール - 発明者による量化データ探索モジュール
- すべてをマスターする - FMZの新バージョンの取引ターミナルへの紹介 (TRB仲裁ソースコード)
- FMZの新バージョンの取引端末のご紹介 (TRBの利息ソースコード追加)
- FMZ Quant: 仮想通貨市場における共通要件設計例の分析 (II)
- 80行のコードで高周波戦略で 脳のない販売ボットを利用する方法
- FMZ定量化:仮想通貨市場の常用需要設計事例解析 (II)
- 80行コードの高周波戦略で脳のないロボットを搾取して売る方法
- FMZ Quant: 仮想通貨市場における共通要件設計例の分析 (I)
- FMZ定量化:仮想通貨市場の常用需要設計事例解析 (1)
もっと