コモディティ・フューチャーズの分析と実現 量占有グラフ
作者: リン・ハーン優しさ, 作成日:2020-07-03 11:06:48, 更新日:2023-10-28 15:30:11
概要
量子フットプリントチャート (Quantum Footprint Chart) は,高度なチャート分析ツールで,英語の名称は"フットプリントチャート"です.単一のK線で各価格の取引活動を表示します.価格情報を提供するだけでなく,取引量,アクティブ購入,アクティブ販売などの情報も提供しています.これは,取引量に基づいて各価格の真の分布比を示し,取引量,価格,時間との複雑な関係を説明し,トレーダーにより多くの参照を提供することができます.
量子足跡とは
簡単に言うと,量子フットプリントは, 価格の異なるレベルで 買い手と売り手に何が起こるかを微小分析することで, 市場の透明性を提供します.
- Kライン価格
- アクティブ・バイ・ボリューム (ASK)
- アクティブ・セール・ボリューム
- 均衡比率
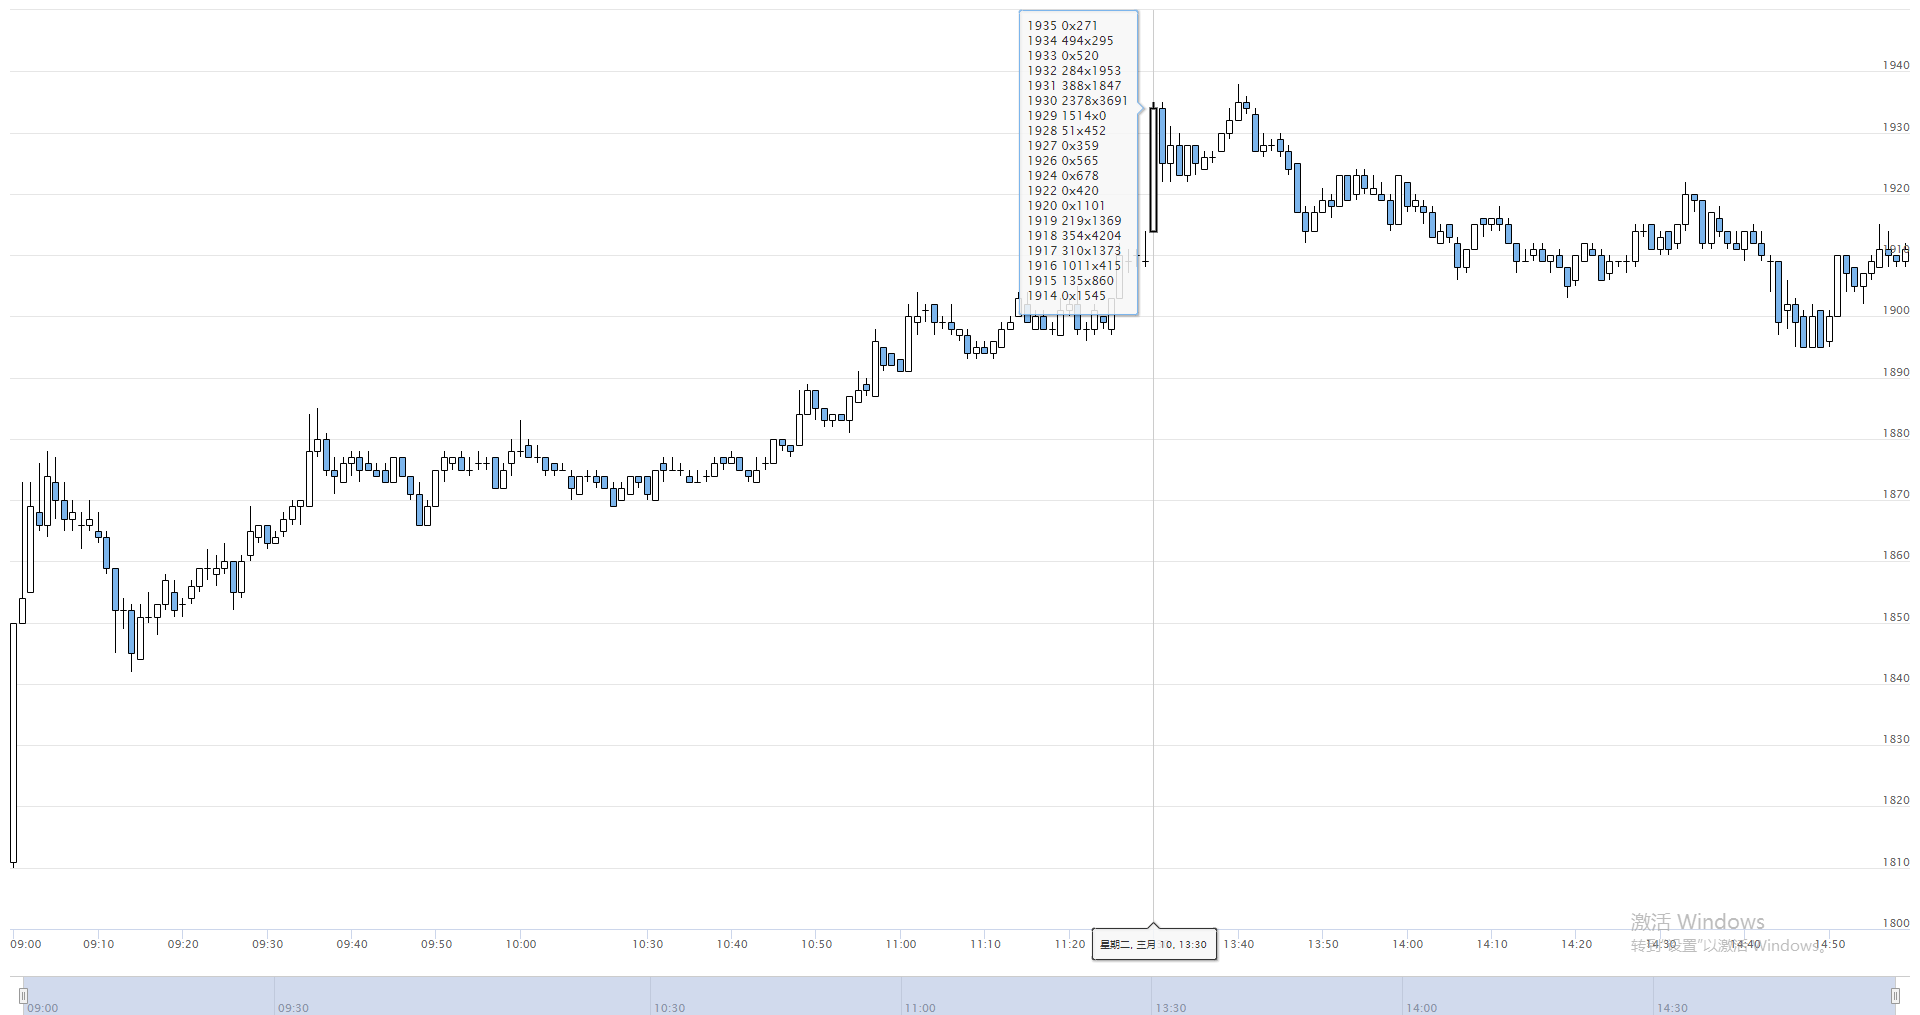
上図のように,これは取引プラットフォームで実装された量的なエネルギーフットプリントチャートのデモバージョンです.FMZ.COM計算されるのは,実際のtick市場.詳細なデータはK線に付属します.マウスがK線上に横を向くと,定量的なエネルギーフットプリントデータは提示できます.青い正方形のデータは,合計で2つの列に分割された計算結果であり,左側の列は,現在のKラインのすべての価格ポイントで,大きいから小さい順序で並べられています.右の列は,各価格レベルのための取引量で,購入取引量と販売取引量に分割され,
量子エネルギー足跡の役割
価格上昇の原因について考えてみてください. 答えは単純です. 買い手と売り手. 売り手よりも買い手が多い場合,価格は上昇します. 買い手よりも売り手数が多い場合,価格は下がります. 現在の売り手数が購入価格の数にほぼ等しい場合,市場は不安定な傾向を示します. つまり,市場はバランスの状態にあります. 大きな買い手や売り手が現れると,このバランスが崩れ,エネルギーフットプリントマップは活発な買い物と販売の極端な比率を示します.
エネルギーフットプリントは,Tickデータに基づいて動的に表示されるため,特に短期間の日中取引に適しています.トレーダーは,価格変動の理由や法則を説明し,独自の取引戦略をカスタマイズするために,各価格のアクティブ取引量を正確に確認できます.例えば:左側の購入量は右側の販売量よりもはるかに大きい場合,それは市場参加者が積極的に購入していることを意味し,価格は将来増加する可能性があります.そうでなければ,右側の販売量は左側の購入量よりもはるかに大きい場合,それは市場参加者が積極的に販売している場合,価格は将来下落する可能性があります.
量子エネルギー足跡の原理
量子エネルギーフットプリントの計算原理は,ボリュームと市場データから得られます.現在のボリュムは,市場の価格変化に応じてリアルタイムで計算されます.市場価格が上昇した場合,ボリュムはアクティブ購入として記録されます.市場価格が低下した場合,その後,ボリュムはアクティブ販売として記録されます. FMZエネルギーフットプリントグラフでは,FZのエネルギーフットプリントは,FZのエネルギーフットプリントが上昇した場合,FZのエネルギーフットプリントは,FZのエネルギーフットプリントが上昇した場合,FZのエネルギーフットプリントは,FZのエネルギーフットプリントが上昇した場合,FZのエネルギーフットプリントは,FZのエネルギーフットプリントが上昇した場合,FZのエネルギーフットプリントは,FZのエネルギーフットプリントが上昇した場合,FZのエネルギーフットプリントは,FZのエネルギーフットプリントが上昇した場合,FZのエネルギーフットプリントが上昇します.Tickデータをリアルタイムで計算し,各企業の売上を正確に計算します.Tick.
量子エネルギーフットプリントコードの実施
/*backtest
start: 2020-03-10 00:00:00
end: 2020-03-10 23:59:00
period: 1h
exchanges: [{"eid":"Futures_CTP","currency":"FUTURES"}]
mode: 1
*/

var NewFuturesTradeFilter = function (period) {
    var self = {} // Create an object
    self.c = Chart({ // Create "Chart" chart
        tooltip: {
            xDateFormat:'%Y-%m-%d %H:%M:%S, %A',
            pointFormat:'{point.tips}'
        },
        series: [{
            name: exchange.GetName(),
            type:'candlestick',
            data: []
        }]
    })
    self.c.reset() // clear chart data
    self.pre = null // used to record the last data
    self.records = []
    self.feed = function (ticker) {
        if (!self.pre) {// If the previous data is not true
            self.pre = ticker // Assign the latest data
        }
        var action ='' // Mark as empty string
        Log('ticker', ticker)
        Log('pre', self.pre)
        if (ticker.Last >= self.pre.Sell) {// If the last price of the latest data is greater than or equal to the selling price of the previous data
            action ='buy' // mark as buy
        } else if (ticker.Last <= self.pre.Buy) {// If the last price of the latest data is less than or equal to the bid price of the previous data
            action ='sell' // mark as sell
        } else {
            if (ticker.Last >= ticker.Sell) {// If the last price of the latest data is greater than or equal to the selling price of the latest data
                action ='buy' // mark as buy
            } else if (ticker.Last <= ticker.Buy) {// If the last price of the latest data is less than or equal to the buying price of the latest data
                action ='sell' // mark as "sell"
            } else {
                action ='both' // Mark as "both"
            }
        }
        // reset volume
        if (ticker.Volume <self.pre.Volume) {// If the volume of the latest data is less than the volume of the previous data
            self.pre.Volume = 0 // Assign the volume of the previous data to 0
        }
        var amount = ticker.Volume-self.pre.Volume // the volume of the latest data minus the volume of the previous data
        if (action !='' && amount> 0) {// If the tag is not an empty string and the action is greater than 0
            var epoch = parseInt(ticker.Time / period) * period // Calculate the K-line timestamp and round it
            var bar = null
            var pos = undefined
            if (
                self.records.length == 0 || // If the K-line length is 0 or the last K-line timestamp is less than "epoch"
                self.records[self.records.length-1].time <epoch
            ) {
                bar = {
                    time: epoch,
                    data: {},
                    open: ticker.Last,
                    high: ticker.Last,
                    low: ticker.Last,
                    close: ticker.Last
                } // Assign the latest data to bar
                self.records.push(bar) // Add bar to the records array
            } else {// reassign bar
                bar = self.records[self.records.length-1] // the last bar of the previous data
                bar.high = Math.max(bar.high, ticker.Last) // the maximum price of the last bar of the previous data and the maximum value of the last price of the latest data
                bar.low = Math.min(bar.low, ticker.Last) // The minimum price of the last bar of the previous data and the minimum value of the last price of the latest data
                bar.close = ticker.Last // last price of latest data
                pos = -1
            }
            if (typeof bar.data[ticker.Last] ==='undefined') {// If the data is empty
                bar.data[ticker.Last] = {// reassign value
                    buy: 0,
                    sell: 0
                }
            }
            if (action =='both') {// If the token is equal to both
                bar.data[ticker.Last]['buy'] += amount // buy accumulation
                bar.data[ticker.Last]['sell'] += amount // sell accumulated
            } else {
                bar.data[ticker.Last][action] += amount // mark accumulation
            }
            var tips =''
            Object.keys(bar.data) // Put the keys in the object into an array
                .sort() // sort
                .reverse() // Reverse the order in the array
                .forEach(function (p) {// traverse the array
                    tips +='<br>' + p + '' + bar.data[p].sell +'x' + bar.data[p].buy
                })
            self.c.add( // Add data
                0, {
                    x: bar.time,
                    open: bar.open,
                    high: bar.high,
                    low: bar.low,
                    close: bar.close,
                    tips: tips
                },
                pos
            )
        }
        self.pre = ticker // reassign
    }
    return self // return object
}


// program entry
function main() {
    Log(_C(exchange.SetContractType,'MA888')) // subscription data
    var filt = NewFuturesTradeFilter(60000) // Create an object
    while (true) {// Enter loop mode
        var ticker = exchange.GetTicker() // Get exchange tick data
        if (ticker) {// If the Tick data is successfully obtained
            filt.feed(ticker) // Start processing data
        }
    }
}
量子フットプリントコード ダウンロード
量的なコードのフットプリントチャート戦略コードがFMZ.com設定せずに使用できます.https://www.fmz.com/strategy/189965
結論から言うと
エネルギーフットプリントマップは,実質的な使用では,資金の流れをボリュームの観点からも分析することができる.大規模なトレンドの方向性や,日間の短期的な方向性を分析するかどうかは別として,重要な役割を果たす.しかし,ここでいわゆる資本流は,資金の入出を指すのではなく,市場の買出意欲と,主要なプレイヤーや個人投資家のゲーム行動を反映していることに注意すべきである.
- 暗号通貨市場の基本分析を定量化する: データが自分で話せ!
- 通貨圏の基礎的な定量化研究 - 数字を客観的に話すために,あらゆる
教師を信頼しなくていい! - 量化取引の必須ツール - 発明者による量化データ探索モジュール
- すべてをマスターする - FMZの新バージョンの取引ターミナルへの紹介 (TRB仲裁ソースコード)
- FMZの新バージョンの取引端末のご紹介 (TRBの利息ソースコード追加)
- FMZ Quant: 仮想通貨市場における共通要件設計例の分析 (II)
- 80行のコードで高周波戦略で 脳のない販売ボットを利用する方法
- FMZ定量化:仮想通貨市場の常用需要設計事例解析 (II)
- 80行コードの高周波戦略で脳のないロボットを搾取して売る方法
- FMZ Quant: 仮想通貨市場における共通要件設計例の分析 (I)
- FMZ定量化:仮想通貨市場の常用需要設計事例解析 (1)