KLineChart 関数を使って戦略図面設計を簡単にする
作者: リン・ハーン小さな夢, 作成日:2022-07-05 15:13:55, 更新日:2023-09-25 19:49:32
KLineChart 関数を使って戦略図面設計を簡単にする
戦略を設計する際には,しばしば表示するための戦略チャートを設計することが必要です.JavaScript言語,Python言語で戦略を書いているとき,プログラミングやFMZプラットフォームで使用されているチャートライブラリを知らないユーザーは,カスタムチャートで描くためのコードデザインに苦労します.
このシンプルで強力な描画方法は,豊かな描画機能で知られるPine言語で見ることができます.Pine言語の描画インターフェースがJavaScriptとPython言語の戦略に接続できれば,開発者の設計戦略の描画機能が非常に容易になります.したがって,この需要に基づいて,FMZプラットフォームはカスタム描画機能をアップグレードし,KLineChartカスタムチャートを描く機能です.APIのドキュメントを参照してください:https://www.fmz.com/api#klinechart
簡単な例から始めましょう JavaScriptを使って移行します
簡単な例
/*backtest
start: 2022-03-21 09:00:00
end: 2022-06-21 15:00:00
period: 30m
basePeriod: 15m
exchanges: [{"eid":"Binance","currency":"BTC_USDT"}]
*/

function main() {
    var c = KLineChart()
    while (true) {
        var bars = _C(exchange.GetRecords)
        for (var i = 0 ; i < bars.length ; i++) {
            var bar = bars[i]
            c.begin(bar)
            c.plot(bar.Volume, "Close")
            c.close()
        }
        Sleep(1000)
    }
}
この例は非常にシンプルです 戦略のカスタム描画エリアに K線チャートを描き,チャートのサブチャート位置にそれぞれの K線 BAR に対応するボリューム曲線を描きます
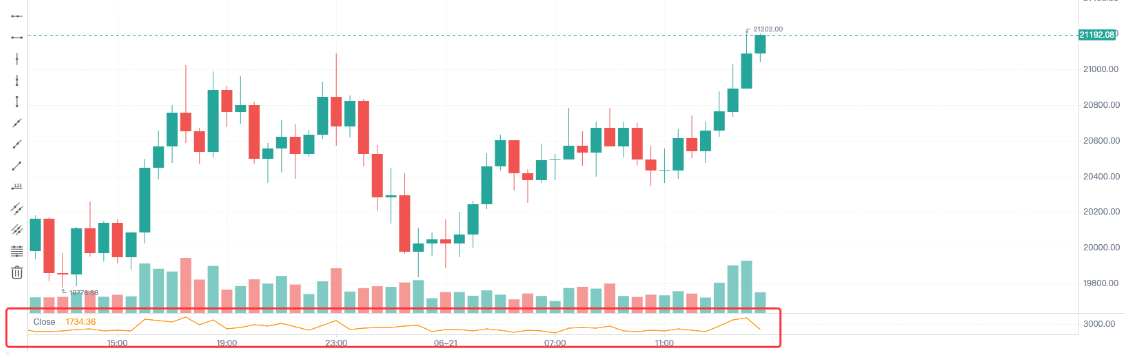
このコードではvar c = KLineChart()ループでは,K線データ (配列構造) を取得し,K線配列を横断します.例のように簡単なforループを使用して横断したり,他の方法で横断することもできます.
引く作業は,c.begin(bar)機能と終了するc.close()機能beginそしてclose次に,最も一般的に使用される図面関数を使用します.plot各BARにボリューム曲線を描く
より複雑な例
Bollinger インディケーターが付属しているグラフを設計したいとします. そして,各 BAR のボリュームグラフも付属します.
/*backtest
start: 2022-03-21 09:00:00
end: 2022-06-21 15:00:00
period: 1d
basePeriod: 1h
exchanges: [{"eid":"Binance","currency":"BTC_USDT"}]
*/

function main() {
    var c = KLineChart()

    // main strategy loop
    while(true) {
        // polling interval
        Sleep(500)

        // get K-line data
        let bars = exchange.GetRecords()
        if (!bars || bars.length <= 20) {
            continue
        }

        // calculate the Bollinger indicator
        var boll = TA.BOLL(bars)

        bars.forEach(function(bar, index) {
            c.begin(bar)
            // drawing operation
            c.plot(boll[0][index], "Boll_Up", {overlay: true})     // Draw on the main chart
            c.plot(boll[1][index], "Boll_Mid", {overlay: true})    // Draw on the main chart
            c.plot(boll[2][index], "Boll_Down", {overlay: true})   // Draw on the main chart
            c.plot(bar.Volume, "volume")                           // Draw on the sub-chart
            c.close()
        })

        // Strategy trading logic
        // ...
        // ..
    }
}
FMZプラットフォームの バックテストの構成情報は次のとおりです
/*backtest
start: 2022-03-21 09:00:00
end: 2022-06-21 15:00:00
period: 1d
basePeriod: 1h
exchanges: [{"eid":"Binance","currency":"BTC_USDT"}]
*/
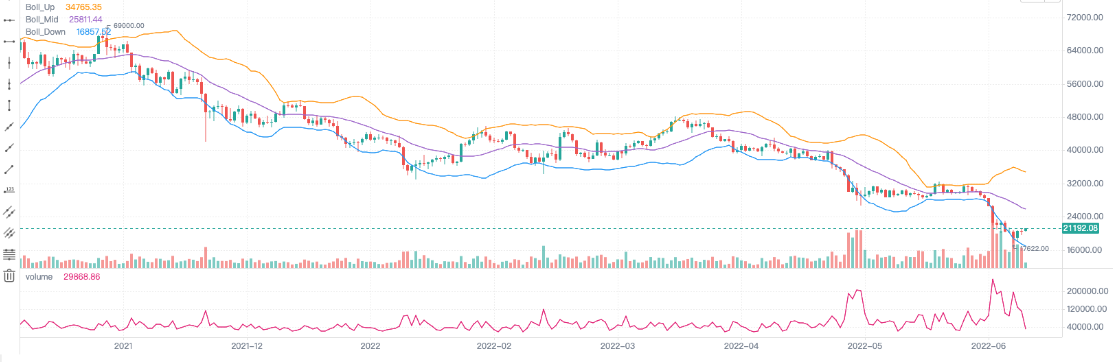
このような設定は,Binance スポット取引物体バックテストを使用することです.バックテスト効果は以下のとおりです.
図解コードをJavaScript言語で大幅に簡素化します 図解コードをJavaScript言語で簡素化します
グラフを描くために指標や他のデータを書き込む
K線データを取得し指標を計算する操作は,プラットフォーム戦略スクエアとAPIドキュメントの戦略例で一般的でシンプルです.
        // obtain K-line data
        let bars = exchange.GetRecords()
        if (!bars || bars.length <= 20) {
            // If the acquisition of the K line fails, that is, if !bar is true, execute continue, ignore the following code, and re-execute the loop
            // If bars.length is less than or equal to 20, that is, the number of K-line BAR (bar) is less than 20, the indicator cannot be calculated, and continue is also executed
            continue
        }

        // Calculate the Bollinger indicator
        var boll = TA.BOLL(bars)
Bollinger インディケーターの計算関数 TA.BOLL,Bollinger インディケーターのパラメータが指定されていない場合,デフォルトパラメータBOLL(20, 2)Bollinger インディケーターには3つの行があるので,TA.BOLL 関数で返されるデータは2次元配列である.boll[0],boll[1],boll[2]は,それぞれが線を表し,配列であるboll配列の3つの要素である.
- boll[0]:ボリンガー・バンド ラインアップ
- boll[1]:ボリンガー帯のミッドライン
- boll[2]:ボリンガー帯 下線
計算したボリンガー指標のデータをグラフに描く方法を見ていきます.
K線数列全体,つまりコード内のバー数列を横切る必要があります. このコードは,forEachfor ループは traverse に使用できます.
        bars.forEach(function(bar, index) {
            c.begin(bar)
            // Drawing operations
            c.plot(boll[0][index], "Boll_Up", {overlay: true})     // {overlay: true} Parameter control, drawn on the main chart
            c.plot(boll[1][index], "Boll_Mid", {overlay: true})    // Draw on the main chart
            c.plot(boll[2][index], "Boll_Down", {overlay: true})   // Draw on the main chart
            c.plot(bar.Volume, "volume")                           // Draw on the sub-chart
            c.close()
        })
グラフを描く操作をバーで開始するたびに,c.begin(bar)機能の呼び出しを最初に.beginグラフオブジェクト c 方法の1つです. 図を描く作業の終わりに,c.close()呼び出す必要があります.begin機能とcloseこの関数は,Pine言語の描写方法に似ている.barcolor bgcolor plot fill hline plotarrow plotshape plotchar plotcandle signalこの関数のパラメータは,Pine言語に対応する関数パラメータと同じで,描画関数も同じです.
取引信号の矢印,マーカー,水平線などを描くことも追加します.
上記のボリンジャー・バンドグラフの例に 取引信号の矢印,マーカー,水平線を追加します
/*backtest
start: 2022-03-21 09:00:00
end: 2022-06-21 15:00:00
period: 1d
basePeriod: 1h
exchanges: [{"eid":"Binance","currency":"BTC_USDT"}]
*/

function main() {
    var c = KLineChart({overlay : true})

    // Strategy main loop
    while(true) {
        // Polling interval
        Sleep(500)

        // Obtain K-line data
        let bars = exchange.GetRecords()
        if (!bars || bars.length <= 20) {
            continue
        }

        // Calculate Bollinger indicator
        var boll = TA.BOLL(bars)

        bars.forEach(function(bar, index) {
            c.begin(bar)
            // Drawing operations
            c.plot(boll[0][index], "Boll_Up", {overlay: true})     // Draw on the main chart
            c.plot(boll[1][index], "Boll_Mid", {overlay: true})    // Draw on the main chart
            c.plot(boll[2][index], "Boll_Down", {overlay: true})   // Draw on the main chart
            c.plot(bar.Volume, "volume", {overlay: false})         // Draw on the sub-chart

            c.hline(bar.Open, {overlay: true})                          // Horizontal line
            c.plotarrow(bar.Close - bar.Open, {overlay: true})          // Arrow
            c.plotshape(bar.Close - bar.Open > 0, {style: 'square'})    // Draw square markers
            c.plotchar(bar.Close - bar.Open < 0, {char: 'X'})           // Draw the character X

            c.close()
        })

        // Strategy trading logic
        // ...
        // ..
    }
}

図形構成オブジェクト
チャートスタイルを構成するために構造を宣言することができる.例えば,次のチャートCfg変数はグリッドラインの構成情報を表している.
    var chartCfg = {
        grid: {
            show: true,
            // Grid horizontal line
            horizontal: {
                show: true,
                size: 2,
                color: '#FF0000',    // Color of horizontal grid line
                // 'solid'|'dash'
                style: 'dash',       // Type of line
                dashValue: [2, 2]
            },
   	        // Grid vertical line
            vertical: {
                show: true,
                size: 2,
                color: '#32CD32',
                // 'solid'|'dash'
                style: 'solid',
                dashValue: [2, 2]
            }
        },
    }
チャート構成オブジェクトは,チャートのいくつかの属性と外観を設定するデータ構造である.例えば,グリッドラインスタイル構成が例で使用されている.X軸,Y軸関連設定,カーソルライン設定,警告メッセージ設定,技術指標スタイル設定,Kライン BARスタイル設定など,構成および変更できるオプションもたくさんあります.
グラフの設定オブジェクトを呼び出すときにそれを渡すことはできませんKLineChartグラフオブジェクトを作成する関数です. 作成されたグラフはデフォルトのスタイルです. API関数を使用します.KLineChartFMZ プラットフォームのチャートオブジェクト作成機能:
var c = KLineChart(chartCfg)
格子線を描く試験コード:
/*backtest
start: 2022-03-21 09:00:00
end: 2022-06-21 15:00:00
period: 1d
basePeriod: 1h
exchanges: [{"eid":"Binance","currency":"BTC_USDT"}]
*/

function main() {
    var chartCfg = {
        grid: {
            show: true,
            // Grid horizontal line
            horizontal: {
                show: true,
                size: 2,
                color: '#FF0000',
                // 'solid'|'dash'
                style: 'dash',
                dashValue: [2, 2]
            },
   	        // Grid vertical line
            vertical: {
                show: true,
                size: 2,
                color: '#32CD32',
                // 'solid'|'dash'
                style: 'solid',
                dashValue: [2, 2]
            }
        },
    }

    var c = KLineChart(chartCfg)

    // Strategy main loop
    while(true) {
        // Polling interval
        Sleep(500)

        // Obtain K-line data
        var bars = _C(exchange.GetRecords)
        bars.forEach(function(bar, index) {
            c.begin(bar)
            c.close()
        })

        // Strategy trading logic
        // ...
        // ..
    }
}
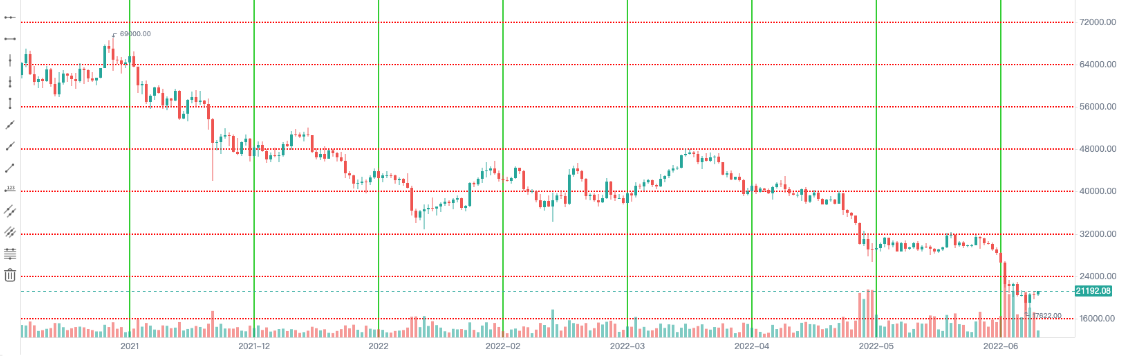
図形構成スタイルの例
グラフの構成スタイル設定を参照するために使用できます.
{
// Gridlines
grid: {
show: true,
// Grid horizontal line
horizontal: {
show: true,
size: 1,
color: '#393939',
// 'solid'|'dash'
style: 'dash',
dashValue: [2, 2]
},
// Grid vertical line
vertical: {
show: false,
size: 1,
color: '#393939',
// 'solid'|'dash'
style: 'dash',
dashValue: [2, 2]
}
},
// Candlestick chart
candle: {
// The distance between the top and bottom of the candlestick chart, greater than 1 is the absolute value, greater than 0, and 1 is the proportion
margin: {
top: 0.2,
bottom: 0.1
},
// Type of Candlestick Charts 'candle_solid'|'candle_stroke'|'candle_up_stroke'|'candle_down_stroke'|'ohlc'|'area'
type: 'candle_solid',
// Candle pillar
bar: {
upColor: '#26A69A',
downColor: '#EF5350',
noChangeColor: '#888888'
},
// Area map
area: {
lineSize: 2,
lineColor: '#2196F3',
value: 'close',
backgroundColor: [{
offset: 0,
color: 'rgba(33, 150, 243, 0.01)'
}, {
offset: 1,
color: 'rgba(33, 150, 243, 0.2)'
}]
},
priceMark: {
show: true,
// Highest price marker
high: {
show: true,
color: '#D9D9D9',
textMargin: 5,
textSize: 10,
textFamily: 'Helvetica Neue',
textWeight: 'normal'
},
// Lowest price marker
low: {
show: true,
color: '#D9D9D9',
textMargin: 5,
textSize: 10,
textFamily: 'Helvetica Neue',
textWeight: 'normal',
},
// Latest price marker
last: {
show: true,
upColor: '#26A69A',
downColor: '#EF5350',
noChangeColor: '#888888',
line: {
show: true,
// 'solid'|'dash'
style: 'dash',
dashValue: [4, 4],
size: 1
},
text: {
show: true,
size: 12,
paddingLeft: 2,
paddingTop: 2,
paddingRight: 2,
paddingBottom: 2,
color: '#FFFFFF',
family: 'Helvetica Neue',
weight: 'normal',
borderRadius: 2
}
}
},
// Tips
tooltip: {
// 'always' | 'follow_cross' | 'none'
showRule: 'always',
// 'standard' | 'rect'
showType: 'standard',
labels: ['time', 'open', 'close', 'high', 'low', 'volume'],
values: null,
defaultValue: 'n/a',
rect: {
paddingLeft: 0,
paddingRight: 0,
paddingTop: 0,
paddingBottom: 6,
offsetLeft: 8,
offsetTop: 8,
offsetRight: 8,
borderRadius: 4,
borderSize: 1,
borderColor: '#3f4254',
backgroundColor: 'rgba(17, 17, 17, .3)'
},
text: {
size: 12,
family: 'Helvetica Neue',
weight: 'normal',
color: '#D9D9D9',
marginLeft: 8,
marginTop: 6,
marginRight: 8,
marginBottom: 0
}
}
},
// Technical indicators
technicalIndicator: {
margin: {
top: 0.2,
bottom: 0.1
},
bar: {
upColor: '#26A69A',
downColor: '#EF5350',
noChangeColor: '#888888'
},
line: {
size: 1,
colors: ['#FF9600', '#9D65C9', '#2196F3', '#E11D74', '#01C5C4']
},
circle: {
upColor: '#26A69A',
downColor: '#EF5350',
noChangeColor: '#888888'
},
// Latest value marker
lastValueMark: {
show: false,
text: {
show: false,
color: '#ffffff',
size: 12,
family: 'Helvetica Neue',
weight: 'normal',
paddingLeft: 3,
paddingTop: 2,
paddingRight: 3,
paddingBottom: 2,
borderRadius: 2
}
},
// Tips
tooltip: {
// 'always' | 'follow_cross' | 'none'
showRule: 'always',
// 'standard' | 'rect'
showType: 'standard',
showName: true,
showParams: true,
defaultValue: 'n/a',
text: {
size: 12,
family: 'Helvetica Neue',
weight: 'normal',
color: '#D9D9D9',
marginTop: 6,
marginRight: 8,
marginBottom: 0,
marginLeft: 8
}
}
},
// x-axis
xAxis: {
show: true,
height: null,
// x-axis line
axisLine: {
show: true,
color: '#888888',
size: 1
},
// x-axis split text
tickText: {
show: true,
color: '#D9D9D9',
family: 'Helvetica Neue',
weight: 'normal',
size: 12,
paddingTop: 3,
paddingBottom: 6
},
// x-axis split line
tickLine: {
show: true,
size: 1,
length: 3,
color: '#888888'
}
},
// y-axis
yAxis: {
show: true,
width: null,
// 'left' | 'right'
position: 'right',
// 'normal' | 'percentage' | 'log'
type: 'normal',
inside: false,
reverse: false,
// y-axis line
axisLine: {
show: true,
color: '#888888',
size: 1
},
// y-axis split text
tickText: {
show: true,
color: '#D9D9D9',
family: 'Helvetica Neue',
weight: 'normal',
size: 12,
paddingLeft: 3,
paddingRight: 6
},
// y-axis split line
tickLine: {
show: true,
size: 1,
length: 3,
color: '#888888'
}
},
// Split line between charts
separator: {
size: 1,
color: '#888888',
fill: true,
activeBackgroundColor: 'rgba(230, 230, 230, .15)'
},
// Crosshair
crosshair: {
show: true,
// Horizontal line and text of crosshair
horizontal: {
show: true,
line: {
show: true,
// 'solid'|'dash'
style: 'dash',
dashValue: [4, 2],
size: 1,
color: '#888888'
},
text: {
show: true,
color: '#D9D9D9',
size: 12,
family: 'Helvetica Neue',
weight: 'normal',
paddingLeft: 2,
paddingRight: 2,
paddingTop: 2,
paddingBottom: 2,
borderSize: 1,
borderColor: '#505050',
borderRadius: 2,
backgroundColor: '#505050'
}
},
// Vertical line and text of crosshair
vertical: {
show: true,
line: {
show: true,
// 'solid'|'dash'
style: 'dash',
dashValue: [4, 2],
size: 1,
color: '#888888'
},
text: {
show: true,
color: '#D9D9D9',
size: 12,
family: 'Helvetica Neue',
weight: 'normal',
paddingLeft: 2,
paddingRight: 2,
paddingTop: 2,
paddingBottom: 2,
borderSize: 1,
borderColor: '#505050',
borderRadius: 2,
backgroundColor: '#505050'
}
}
},
// Graph
shape: {
point: {
backgroundColor: '#2196F3',
borderColor: '#2196F3',
borderSize: 1,
radius: 4,
activeBackgroundColor: '#2196F3',
activeBorderColor: '#2196F3',
activeBorderSize: 1,
activeRadius: 6
},
line: {
// 'solid'|'dash'
style: 'solid'
color: '#2196F3',
size: 1,
dashValue: [2, 2]
},
polygon: {
// 'stroke'|'fill'
style: 'stroke',
stroke: {
// 'solid'|'dash'
style: 'solid',
size: 1,
color: '#2196F3',
dashValue: [2, 2]
},
fill: {
color: 'rgba(33, 150, 243, 0.1)'
}
},
arc: {
// 'stroke'|'fill'
style: 'stroke',
stroke: {
// 'solid'|'dash'
style: 'solid',
size: 1,
color: '#2196F3',
dashValue: [2, 2]
},
fill: {
color: '#2196F3'
}
},
text: {
style: 'fill',
color: '#2196F3',
size: 12,
family: 'Helvetica Neue',
weight: 'normal',
offset: [0, 0]
}
},
annotation: {
// 'top' | 'bottom' | 'point'
position: 'top',
offset: [20, 0]
symbol: {
// 'diamond' | 'circle' | 'rect' | 'triangle' | 'custom' | 'none'
type: 'diamond',
size: 8,
color: '#2196F3',
activeSize: 10,
activeColor: '#FF9600'
}
},
tag: {
// 'top' | 'bottom' | 'point'
position: 'point',
offset: 0,
line: {
show: true,
style: LineStyle.DASH,
dashValue: [4, 2],
size: 1,
color: '#2196F3'
},
text: {
color: '#FFFFFF',
backgroundColor: '#2196F3',
size: 12,
family: 'Helvetica Neue',
weight: 'normal',
paddingLeft: 2,
paddingRight: 2,
paddingTop: 2,
paddingBottom: 2,
borderRadius: 2,
borderSize: 1,
borderColor: '#2196F3'
},
mark: {
offset: 0,
color: '#FFFFFF',
backgroundColor: '#2196F3',
size: 12,
family: 'Helvetica Neue',
weight: 'normal',
paddingLeft: 2,
paddingRight: 2,
paddingTop: 2,
paddingBottom: 2,
borderRadius: 2,
borderSize: 1,
borderColor: '#2196F3'
}
}
}
戦略の設計を容易にするのではないでしょうか?
- 暗号通貨市場の基本分析を定量化する: データが自分で話せ!
- 通貨圏の基礎的な定量化研究 - 数字を客観的に話すために,あらゆる
教師を信頼しなくていい! - 量化取引の必須ツール - 発明者による量化データ探索モジュール
- すべてをマスターする - FMZの新バージョンの取引ターミナルへの紹介 (TRB仲裁ソースコード)
- FMZの新バージョンの取引端末のご紹介 (TRBの利息ソースコード追加)
- FMZ Quant: 仮想通貨市場における共通要件設計例の分析 (II)
- 80行のコードで高周波戦略で 脳のない販売ボットを利用する方法
- FMZ定量化:仮想通貨市場の常用需要設計事例解析 (II)
- 80行コードの高周波戦略で脳のないロボットを搾取して売る方法
- FMZ Quant: 仮想通貨市場における共通要件設計例の分析 (I)
- FMZ定量化:仮想通貨市場の常用需要設計事例解析 (1)