フィッシャー指標のJavaScript言語の実装とFMZの描画
作者: リン・ハーンリディア, 作成日:2022-11-07 11:37:48, 更新日:2023-09-15 21:05:55 更新日:2023-09-15 更新日:2021-09-15 更新日:2021-09-15 更新日:2021-09-15 更新日:2021-09-15 更新日:2021-09-15 更新日:2021-09-15 更新日:2021-09-15 更新日:2021-09-15 更新日:2021-09-15 更新日:2021-09-15 更新日:2021-09-15 更新日:2021-09-15 更新日:2021-09-15 更新日:2021-09-15 更新日:2021-09-15
取引の技術分析では,トレーダーは株価データを通常の分布のデータとして分析し,研究する.しかし,株価データの分布は標準的な正常分布に適合していない.Fisher Transformation価格データを正規分布に変換できる方法です.Fisher Transformation取引シグナルは,現在の日および前日の指標を使用して送信することができます.
コンテンツがたくさんありますFisher Transformバイドゥ,ジフー,ここでは繰り返さない.
インディケーター アルゴリズム:
-
今日の中間価格:
mid=(low + high) / 2 -
計算期間を判断します.これは10日です. 期間中の最高値と最低値を計算します.
lowestLow = lowest price in the period,highestHigh = highest price in the period. -
価格変化パラメータ (価格変化パラメータ) を定義します.
ratio0-1 の間の定数である.例えば,0.5 または0.33):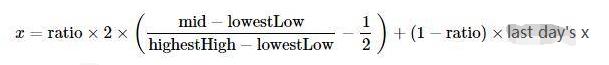
-
システムを使用
Fisher価格変化パラメータの変換xについてFisher指標は以下のように得られます: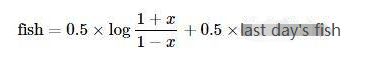
JavaScript 言語を使用してアルゴリズムを実装する
指標アルゴリズムに従って段階的に実装されます. アルゴリズムが繰り返しのアルゴリズムであることを注意してください.preXそしてpreFish初期に0に設定されていました.Math Logさらに上記のアルゴリズムは x の修正について言及しませんでした. これを書きながらほとんど無視しました:
0.99より大きい場合は 0.999にします. -0.99未満の場合も同じです.
        if (x > 0.99) {
            x = 0.999
        } else if (x < -0.99) {
            x = -0.999
        }
アルゴリズムと指標を初めて見たとき,私はアルゴリズムに従ってそれらを移植しました.私はこの実装を検証していないし,研究に興味のある人は,エラーがあるかどうかを確認することができます. 間違いを指摘してくれてありがとう.
Fisher Transform指標アルゴリズムのソースコード:
function getHighest(arr, period) {
    if (arr.length == 0 || arr.length - period < 0) {
        return null
    }
    var beginIndex = arr.length - period
    var ret = arr[beginIndex].High
    for (var i = 0 ; i < arr.length - 1 ; i++) {
        if (arr[i + 1].High > ret) {
            ret = arr[i + 1].High
        }
    }
    return ret
}

function getLowest(arr, period) {
    if (arr.length == 0 || arr.length - period < 0) {
        return null
    }
    var beginIndex = arr.length - period
    var ret = arr[beginIndex].Low
    for (var i = 0 ; i < arr.length - 1 ; i++) {
        if (arr[i + 1].Low < ret) {
            ret = arr[i + 1].Low
        }
    }
    return ret
}

function calcFisher(records, ratio, period) {
    var preFish = 0
    var preX = 0
    var arrFish = []
    // When the length of K-line is not enough to meet the period
    if (records.length < period) {
        for (var i = 0 ; i < records.length ; i++) {
            arrFish.push(0)
        }
        return arrFish
    }

    // traverse the K-line
    for (var i = 0 ; i < records.length ; i++) {
        var fish = 0
        var x = 0
        var bar = records[i]
        var mid = (bar.High + bar.Low) / 2
        // When the current BAR is insufficient in period calculation
        if (i < period - 1) {
            fish = 0
            preFish = 0
            arrFish.push(fish)
            continue
        }

        // Calculate the highest and lowest price in the period
        var bars = []
        for (var j = 0 ; j <= i ; j++) {
            bars.push(records[j])
        }
        var lowestLow = getLowest(bars, period)
        var highestHigh = getHighest(bars, period)

        // price change parameters
        x = ratio * 2 * ((mid - lowestLow) / (highestHigh - lowestLow) - 0.5) + (1 - ratio) * preX
        if (x > 0.99) {
            x = 0.999
        } else if (x < -0.99) {
            x = -0.999
        }
        preX = x
        fish = 0.5 * Math.log((1 + x) / (1 - x)) + 0.5 * preFish
        preFish = fish
        arrFish.push(fish)
    }
    return arrFish
}
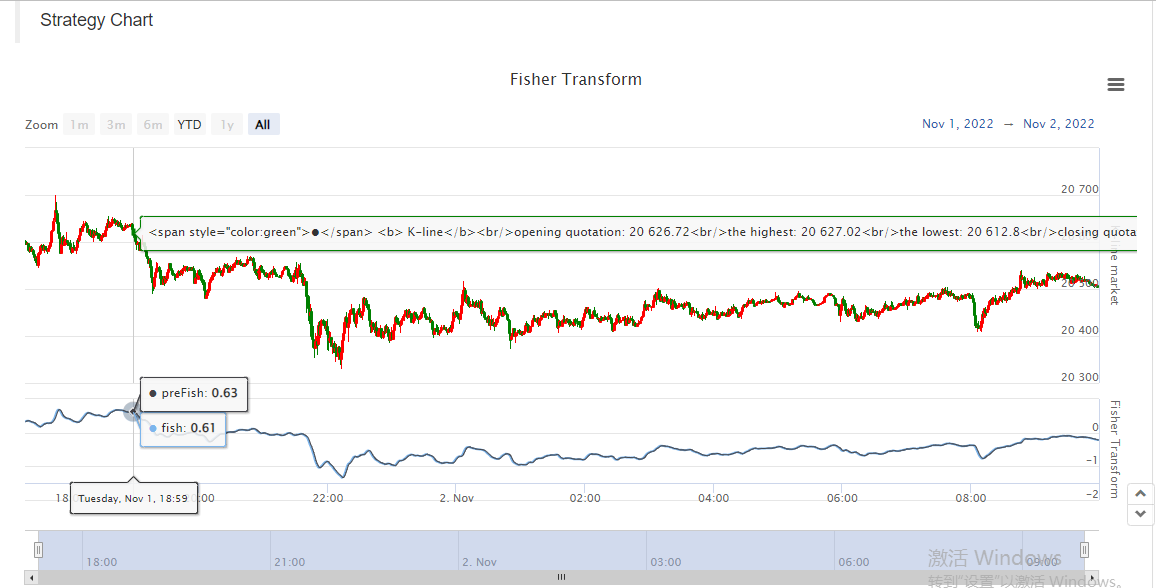
図面
FMZ,戦略広場で描くのは簡単ですhttps://www.fmz.com/square検索することができます. 検索は,
var cfg = {    // The object used to initialize chart settings (i.e. chart settings)
    plotOptions: {
        candlestick: {
            color: '#d75442',  // color value
            upColor: '#6ba583' // color value
        }
    },
    title: { text: 'Fisher Transform'},     //title
    subtitle: {text: ''},     //sub-title
    plotOptions: {
        candlestick: {
        tooltip: {
            pointFormat:
            '<span style="color:{point.color}">\u25CF</span> <b> {series.name}</b><br/>' +
            'opening quotation: {point.open}<br/>' +
            'the highest: {point.high}<br/>' +
            'the lowest: {point.low}<br/>' +
            'closing quotation: {point.close}<br/>'
            }
        }
    },
    yAxis: [{
        title: {
            text: 'K-line market'
        },
        height: '70%',
        lineWidth: 1
    }, {
        title: {
            text: 'Fisher Transform'
        },
        top: '75%',
        height: '30%',
        offset: 0,
        lineWidth: 1
    }],
    series: [//series
        {
            type: 'candlestick',
            yAxis: 0,
            name: 'K-line',
            id: 'KLine',
            // Control the candle color with downward trend
            color: 'green',
            lineColor: 'green',
            // Control the candle color with upward trend
            upColor: 'red',
            upLineColor: 'red',
            data: []
        },{
            type: 'line',         // Set the current data series type as line
            yAxis: 1,             // The y-axis used as the y-axis with the index of 0 (a highcharts chart can have multiple y-axes, and the y-axis with the index of 0 is specified here)
            showInLegend: true,   //
            name: 'fish',          // Set it according to the parameter label passed in by the function
            lineWidth: 1,
            data: [],             // Data items of data series
            tooltip: {            // Tooltip
                valueDecimals: 2  // The decimal point of the value is reserved for 5 digits
            }
        },{
            type: 'line',         // Set the current data series type as line
            yAxis: 1,             // The y-axis used as the y-axis with the index of 0 (a highcharts chart can have multiple y-axes, and the y-axis with the index of 0 is specified here)
            showInLegend: true,   //
            name: 'preFish',      // Set it according to the parameter label passed in by the function
            lineWidth: 1,
            data: [],             // Data items of data series
            tooltip: {            // Tooltip
                valueDecimals: 2  // The decimal point of the value is reserved for 5 digits
            }
        }
    ]
}

var chart = Chart(cfg)
function main() {
    var ts = 0
    chart.reset()
    while (true) {
        var r = exchange.GetRecords()
        var fisher = calcFisher(r, 0.33, 10)
        if (!r || !fisher) {
            Sleep(500)
            continue
        }

        for (var i = 0; i < r.length; i++){
            if (ts == r[i].Time) {
                chart.add([0,[r[i].Time, r[i].Open, r[i].High, r[i].Low, r[i].Close], -1])
                chart.add([1,[r[i].Time, fisher[i]], -1])
                if (i - 1 >= 0) {
                    chart.add([2,[r[i].Time, fisher[i - 1]], -1])
                }
            }else if (ts < r[i].Time) {
                chart.add([0,[r[i].Time, r[i].Open, r[i].High, r[i].Low, r[i].Close]])
                chart.add([1,[r[i].Time, fisher[i]]])
                if (i - 1 >= 0) {
                    chart.add([2,[r[i].Time, fisher[i - 1]]])
                }
                ts = r[i].Time
            }
        }
    }
}
FMZのデータ,表示チャート,デザイン戦略を研究するのは非常に便利です メッセージを残すことができます. メッセージはこちらです.
- 暗号通貨市場の基本分析を定量化する: データが自分で話せ!
- 通貨圏の基礎的な定量化研究 - 数字を客観的に話すために,あらゆる
教師を信頼しなくていい! - 量化取引の必須ツール - 発明者による量化データ探索モジュール
- すべてをマスターする - FMZの新バージョンの取引ターミナルへの紹介 (TRB仲裁ソースコード)
- FMZの新バージョンの取引端末のご紹介 (TRBの利息ソースコード追加)
- FMZ Quant: 仮想通貨市場における共通要件設計例の分析 (II)
- 80行のコードで高周波戦略で 脳のない販売ボットを利用する方法
- FMZ定量化:仮想通貨市場の常用需要設計事例解析 (II)
- 80行コードの高周波戦略で脳のないロボットを搾取して売る方法
- FMZ Quant: 仮想通貨市場における共通要件設計例の分析 (I)
- FMZ定量化:仮想通貨市場の常用需要設計事例解析 (1)