YouTubeベテランの"マジック・ダブル・EMA戦略"
作者: リン・ハーンリディア, 作成日:2022-11-07 12:02:31, 更新日:2023-09-15 20:51:23 更新日:2023-09-15 更新日:2021-09-15 更新日:2021-09-15 更新日:2021-09-15 更新日:2021-09-15 更新日:2021-09-15 更新日:2021-09-15 更新日:2021-09-15 更新日:2021-09-15 更新日:2021-09-15 更新日:2021-09-15 更新日:2021-09-15 更新日:2021-09-15 更新日:2021-09-15 更新日:2021-09-15
YouTubeベテランからの"マジック・ダブル・EMA戦略"
本号では,YouTubeから"Stock and Cryptocurrency Marketのキラー"として知られる"Magic Double EMA Strategy"について説明します.この戦略は2つのトレードビューインジケーターを使用するトレードビュー言語戦略です.ビデオのバックテスト効果は非常に良好で,FMZはトレードビューのバックテスト言語もサポートしています.だから私は自分でバックテストと分析をしたいのです.それで作業を開始しましょう!ビデオの戦略を複製しましょう.
戦略で使用される指標
- EMA指標
ビデオで示した移動平均指数を使用しません. 代わりに,取引ビューの内蔵の ta.ema を使用します (実際には同じです).
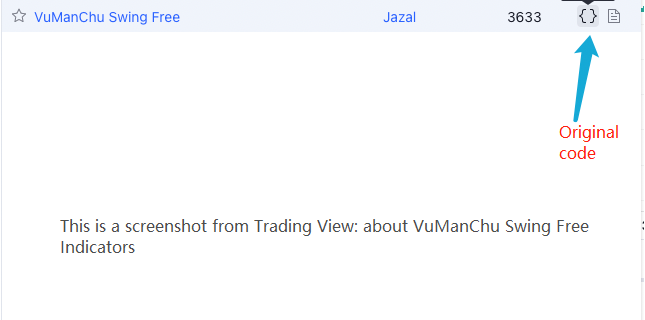
- VuManChu スイングフリー インディケーター
これはトレードビューの指標です トレーディングビューに行って ソースコードを拾う必要があります
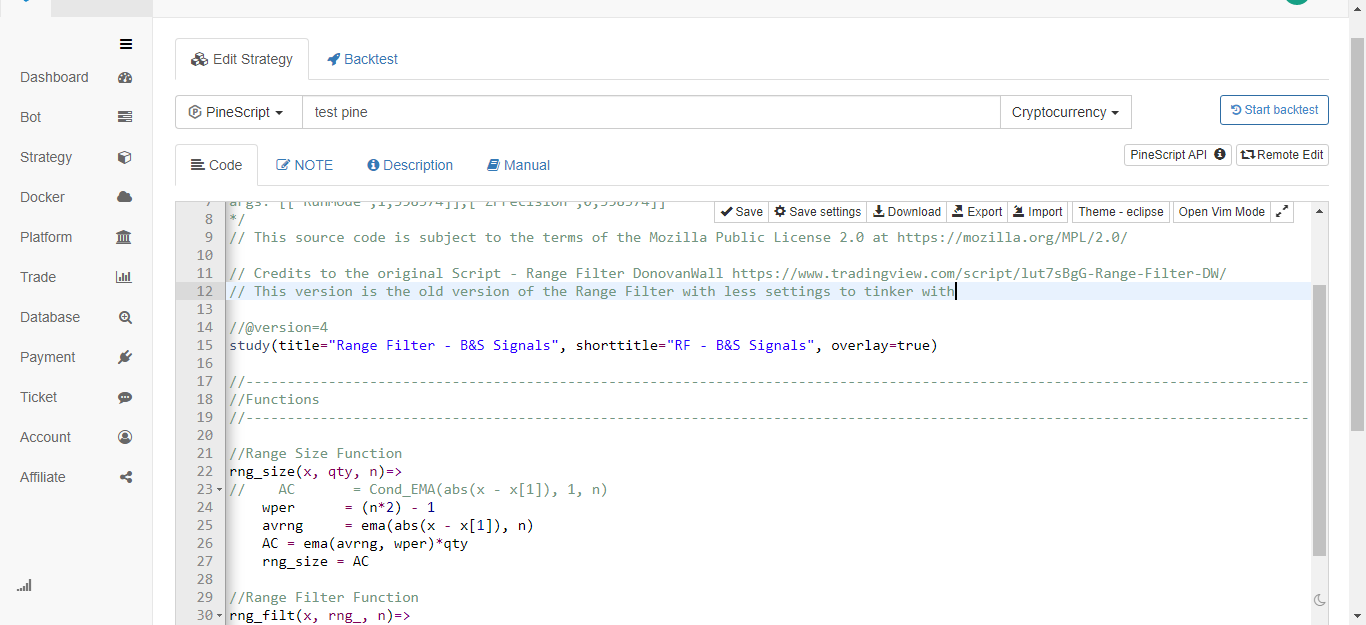
ヴァンマンチュ・スイング・フリーのコード
// This source code is subject to the terms of the Mozilla Public License 2.0 at https://mozilla.org/MPL/2.0/

// Credits to the original Script - Range Filter DonovanWall https://www.tradingview.com/script/lut7sBgG-Range-Filter-DW/
// This version is the old version of the Range Filter with less settings to tinker with

//@version=4
study(title="Range Filter - B&S Signals", shorttitle="RF - B&S Signals", overlay=true)

//-----------------------------------------------------------------------------------------------------------------------------------------------------------------
//Functions
//-----------------------------------------------------------------------------------------------------------------------------------------------------------------

//Range Size Function
rng_size(x, qty, n)=>
//    AC       = Cond_EMA(abs(x - x[1]), 1, n)
    wper      = (n*2) - 1
    avrng     = ema(abs(x - x[1]), n)
    AC = ema(avrng, wper)*qty
    rng_size = AC

//Range Filter Function
rng_filt(x, rng_, n)=>
    r          = rng_
    var rfilt  = array.new_float(2, x)
    array.set(rfilt, 1, array.get(rfilt, 0))
    if x - r > array.get(rfilt, 1)
        array.set(rfilt, 0, x - r)
    if x + r < array.get(rfilt, 1)
        array.set(rfilt, 0, x + r)
    rng_filt1 = array.get(rfilt, 0)

    hi_band   = rng_filt1 + r
    lo_band   = rng_filt1 - r
    rng_filt  = rng_filt1
    [hi_band, lo_band, rng_filt]

//-----------------------------------------------------------------------------------------------------------------------------------------------------------------
//Inputs
//-----------------------------------------------------------------------------------------------------------------------------------------------------------------

//Range Source
rng_src = input(defval=close, type=input.source, title="Swing Source")

//Range Period
rng_per = input(defval=20, minval=1, title="Swing Period")

//Range Size Inputs
rng_qty   = input(defval=3.5, minval=0.0000001, title="Swing Multiplier")

//Bar Colors
use_barcolor = input(defval=false, type=input.bool, title="Bar Colors On/Off")

//-----------------------------------------------------------------------------------------------------------------------------------------------------------------
//Definitions
//-----------------------------------------------------------------------------------------------------------------------------------------------------------------

//Range Filter Values
[h_band, l_band, filt] = rng_filt(rng_src, rng_size(rng_src, rng_qty, rng_per), rng_per)

//Direction Conditions
var fdir = 0.0
fdir    := filt > filt[1] ? 1 : filt < filt[1] ? -1 : fdir
upward   = fdir==1 ? 1 : 0
downward = fdir==-1 ? 1 : 0

//Trading Condition
longCond = rng_src > filt and rng_src > rng_src[1] and upward > 0 or rng_src > filt and rng_src < rng_src[1] and upward > 0
shortCond = rng_src < filt and rng_src < rng_src[1] and downward > 0 or rng_src < filt and rng_src > rng_src[1] and downward > 0

CondIni = 0
CondIni := longCond ? 1 : shortCond ? -1 : CondIni[1]
longCondition = longCond and CondIni[1] == -1
shortCondition = shortCond and CondIni[1] == 1

//Colors
filt_color = upward ? #05ff9b : downward ? #ff0583 : #cccccc
bar_color  = upward and (rng_src > filt) ? (rng_src > rng_src[1] ? #05ff9b : #00b36b) :
             downward and (rng_src < filt) ? (rng_src < rng_src[1] ? #ff0583 : #b8005d) : #cccccc

//-----------------------------------------------------------------------------------------------------------------------------------------------------------------
//Outputs
//-----------------------------------------------------------------------------------------------------------------------------------------------------------------

//Filter Plot
filt_plot = plot(filt, color=filt_color, transp=67, linewidth=3, title="Filter")

//Band Plots
h_band_plot = plot(h_band, color=color.new(#05ff9b, 100), title="High Band")
l_band_plot = plot(l_band, color=color.new(#ff0583, 100), title="Low Band")

//Band Fills
fill(h_band_plot, filt_plot, color=color.new(#00b36b, 92), title="High Band Fill")
fill(l_band_plot, filt_plot, color=color.new(#b8005d, 92), title="Low Band Fill")

//Bar Color
barcolor(use_barcolor ? bar_color : na)

//Plot Buy and Sell Labels
plotshape(longCondition, title = "Buy Signal", text ="BUY", textcolor = color.white, style=shape.labelup, size = size.normal, location=location.belowbar, color = color.new(color.green, 0))
plotshape(shortCondition, title = "Sell Signal", text ="SELL", textcolor = color.white, style=shape.labeldown, size = size.normal, location=location.abovebar, color = color.new(color.red, 0))

//Alerts
alertcondition(longCondition, title="Buy Alert", message = "BUY")
alertcondition(shortCondition, title="Sell Alert", message = "SELL")
戦略の論理
EMA指標:この戦略は2つの EMAを使用しており,一つは高速線 (小期パラメータ) で,もう一つはスローライン (大期パラメータ) です.ダブルEMA移動平均の目的は主に市場のトレンドの方向性を決定するのに役立ちます.
-
ロングポジション 速い線は遅い線の上にあります.
-
ショートポジション 速い線は遅い線の下にある.
VuManChu Swing Free インディケーター:VuManChu Swing Free インディケーターは,シグナルを送信し,他の条件と組み合わせて注文するかどうかを判断するために使用されます.VuManChu Swing Free インディケーターのソースコードから,longCondition変数は購入信号,shortCondition変数は販売信号を表すことがわかります.これらの2つの変数は,注文条件の後の書き込みに使用されます.
取引シグナルの特定のトリガー条件についてお話ししましょう.
-
ロングポジションへの入場規則: ポジティブなKラインの閉じる価格は,EMAの高速ラインの上,両EMAはロングポジション (スローライン上の高速ライン) で,VuManChu Swing Freeインジケーターは購入信号 (longCondition true) を表示すべきである.この3つの条件が満たされている場合,このKラインはロングポジションのエントリーのためのキーKラインであり,このKラインの閉じる価格はエントリーポジションである.
-
ショートポジションへの入場規則 (ロングポジションとは異なり): 負のKラインの閉じる価格は,EMAの速いラインを下回り,2つのEMAはショートポジション (スローラインの下の速いライン) で,VuManChu Swing Freeインジケーターはセールシグナル (shortCondition true) を表示すべきである.この3つの条件が満たされている場合,Kラインの閉じる価格はショートエントリーポジションである.
取引の論理は非常にシンプルですか? ソースビデオでは利益ストップと損失ストップを指定していないため,私は利得ストップと損失ストップ方法を自由に使用し,損失を止める固定ポイントを使用して,利益ストップを追跡します.
コードの設計
戦略コードに直接入れました 変更なしです
取引機能を実装する パイン言語のコードを書きます
// extend
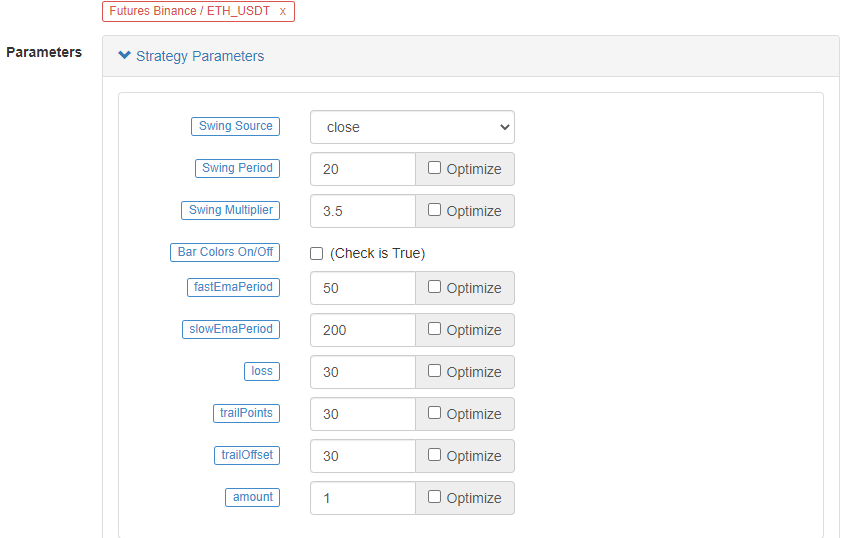
fastEmaPeriod = input(50, "fastEmaPeriod") // fast line period
slowEmaPeriod = input(200, "slowEmaPeriod") // slow line period
loss = input(30, "loss") // stop loss points
trailPoints = input(30, "trailPoints") // number of trigger points for moving stop loss
trailOffset = input(30, "trailOffset") // moving stop profit offset (points)
amount = input(1, "amount") // order amount
emaFast = ta.ema(close, fastEmaPeriod) // calculate the fast line EMA
emaSlow = ta.ema(close, slowEmaPeriod) // calculate the slow line EMA
buyCondition = longCondition and emaFast > emaSlow and close > open and close > emaFast // entry conditions for long positions
sellCondition = shortCondition and emaFast < emaSlow and close < open and close < emaFast // entry conditions for short positions
if buyCondition and strategy.position_size == 0
strategy.entry("long", strategy.long, amount)
strategy.exit("exit_long", "long", amount, loss=loss, trail_points=trailPoints, trail_offset=trailOffset)
if sellCondition and strategy.position_size == 0
strategy.entry("short", strategy.short, amount)
strategy.exit("exit_short", "short", amount, loss=loss, trail_points=trailPoints, trail_offset=trailOffset)
A.ItbuyConditionが trueであるとき,つまり:
- 変数 longCondition true (VuManChu Swing Free インジケーターはロングポジション信号を送る).
- emaFast > emaSlow (EMAのロングポジションアライナメント)
- close > open (現在の BAR が正であることを意味) close > emaFast (閉じる価格は EMA の快線以上であることを意味)
3つの条件は 長期にわたって維持されます
B. sellCondition が真である場合,ショートポジションの3つの条件が成立します (ここでは繰り返しません).
条件が判断信号をトリガーした場合に,入力し,ポジションを開くために戦略.エントリー関数を使用し,設定しますstrategy.exit損失を止め,利益を追跡する機能です.
完全なコード
/*backtest
start: 2022-01-01 00:00:00
end: 2022-10-08 00:00:00
period: 15m
basePeriod: 5m
exchanges: [{"eid":"Futures_Binance","currency":"ETH_USDT"}]
args: [["ZPrecision",0,358374]]
*/

// This source code is subject to the terms of the Mozilla Public License 2.0 at https://mozilla.org/MPL/2.0/

// Credits to the original Script - Range Filter DonovanWall https://www.tradingview.com/script/lut7sBgG-Range-Filter-DW/
// This version is the old version of the Range Filter with less settings to tinker with

//@version=4
study(title="Range Filter - B&S Signals", shorttitle="RF - B&S Signals", overlay=true)

//-----------------------------------------------------------------------------------------------------------------------------------------------------------------
//Functions
//-----------------------------------------------------------------------------------------------------------------------------------------------------------------

//Range Size Function
rng_size(x, qty, n)=>
//    AC       = Cond_EMA(abs(x - x[1]), 1, n)
    wper      = (n*2) - 1
    avrng     = ema(abs(x - x[1]), n)
    AC = ema(avrng, wper)*qty
    rng_size = AC

//Range Filter Function
rng_filt(x, rng_, n)=>
    r          = rng_
    var rfilt  = array.new_float(2, x)
    array.set(rfilt, 1, array.get(rfilt, 0))
    if x - r > array.get(rfilt, 1)
        array.set(rfilt, 0, x - r)
    if x + r < array.get(rfilt, 1)
        array.set(rfilt, 0, x + r)
    rng_filt1 = array.get(rfilt, 0)

    hi_band   = rng_filt1 + r
    lo_band   = rng_filt1 - r
    rng_filt  = rng_filt1
    [hi_band, lo_band, rng_filt]

//-----------------------------------------------------------------------------------------------------------------------------------------------------------------
//Inputs
//-----------------------------------------------------------------------------------------------------------------------------------------------------------------

//Range Source
rng_src = input(defval=close, type=input.source, title="Swing Source")

//Range Period
rng_per = input(defval=20, minval=1, title="Swing Period")

//Range Size Inputs
rng_qty   = input(defval=3.5, minval=0.0000001, title="Swing Multiplier")

//Bar Colors
use_barcolor = input(defval=false, type=input.bool, title="Bar Colors On/Off")

//-----------------------------------------------------------------------------------------------------------------------------------------------------------------
//Definitions
//-----------------------------------------------------------------------------------------------------------------------------------------------------------------

//Range Filter Values
[h_band, l_band, filt] = rng_filt(rng_src, rng_size(rng_src, rng_qty, rng_per), rng_per)

//Direction Conditions
var fdir = 0.0
fdir    := filt > filt[1] ? 1 : filt < filt[1] ? -1 : fdir
upward   = fdir==1 ? 1 : 0
downward = fdir==-1 ? 1 : 0

//Trading Condition
longCond = rng_src > filt and rng_src > rng_src[1] and upward > 0 or rng_src > filt and rng_src < rng_src[1] and upward > 0
shortCond = rng_src < filt and rng_src < rng_src[1] and downward > 0 or rng_src < filt and rng_src > rng_src[1] and downward > 0

CondIni = 0
CondIni := longCond ? 1 : shortCond ? -1 : CondIni[1]
longCondition = longCond and CondIni[1] == -1
shortCondition = shortCond and CondIni[1] == 1

//Colors
filt_color = upward ? #05ff9b : downward ? #ff0583 : #cccccc
bar_color  = upward and (rng_src > filt) ? (rng_src > rng_src[1] ? #05ff9b : #00b36b) :
             downward and (rng_src < filt) ? (rng_src < rng_src[1] ? #ff0583 : #b8005d) : #cccccc

//-----------------------------------------------------------------------------------------------------------------------------------------------------------------
//Outputs
//-----------------------------------------------------------------------------------------------------------------------------------------------------------------

//Filter Plot
filt_plot = plot(filt, color=filt_color, transp=67, linewidth=3, title="Filter")

//Band Plots
h_band_plot = plot(h_band, color=color.new(#05ff9b, 100), title="High Band")
l_band_plot = plot(l_band, color=color.new(#ff0583, 100), title="Low Band")

//Band Fills
fill(h_band_plot, filt_plot, color=color.new(#00b36b, 92), title="High Band Fill")
fill(l_band_plot, filt_plot, color=color.new(#b8005d, 92), title="Low Band Fill")

//Bar Color
barcolor(use_barcolor ? bar_color : na)

//Plot Buy and Sell Labels
plotshape(longCondition, title = "Buy Signal", text ="BUY", textcolor = color.white, style=shape.labelup, size = size.normal, location=location.belowbar, color = color.new(color.green, 0))
plotshape(shortCondition, title = "Sell Signal", text ="SELL", textcolor = color.white, style=shape.labeldown, size = size.normal, location=location.abovebar, color = color.new(color.red, 0))

//Alerts
alertcondition(longCondition, title="Buy Alert", message = "BUY")
alertcondition(shortCondition, title="Sell Alert", message = "SELL")


// extend
fastEmaPeriod = input(50, "fastEmaPeriod")
slowEmaPeriod = input(200, "slowEmaPeriod")
loss = input(30, "loss")
trailPoints = input(30, "trailPoints")
trailOffset = input(30, "trailOffset")
amount = input(1, "amount")

emaFast = ta.ema(close, fastEmaPeriod)
emaSlow = ta.ema(close, slowEmaPeriod)

buyCondition = longCondition and emaFast > emaSlow and close > open and close > emaFast
sellCondition = shortCondition and emaFast < emaSlow and close < open and close < emaFast

if buyCondition and strategy.position_size == 0
    strategy.entry("long", strategy.long, amount)
    strategy.exit("exit_long", "long", amount, loss=loss, trail_points=trailPoints, trail_offset=trailOffset)
if sellCondition and strategy.position_size == 0
    strategy.entry("short", strategy.short, amount)
    strategy.exit("exit_short", "short", amount, loss=loss, trail_points=trailPoints, trail_offset=trailOffset)
バックテスト
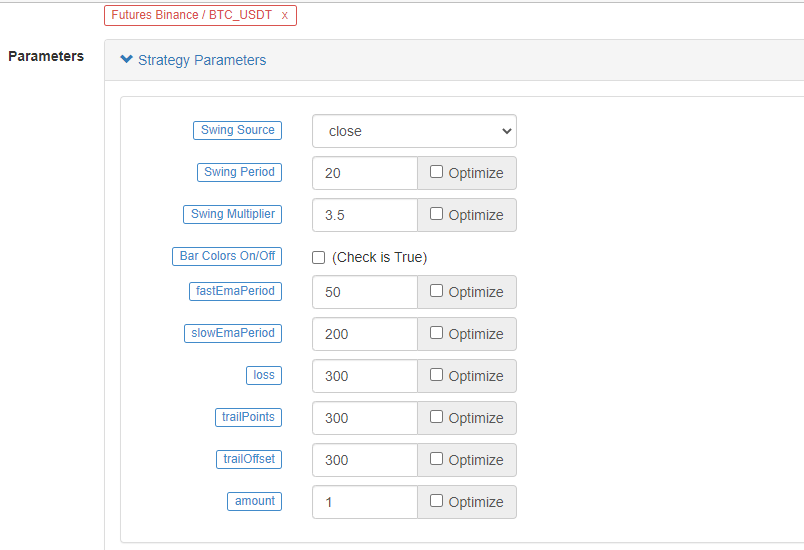
バックテストの時間範囲は2022年1月から2022年10月までの間である.Kライン期間は15分であり,閉値モデルはバックテストに使用される.市場はBinance ETH_USDT永久契約を選択する.パラメータはソースビデオの50期間の高速ラインと200期間の遅いラインに従って設定されている.他のパラメータはデフォルトで変わらない.私はストップ損失とトラッキングストップ利益ポイントを主観的に30ポイントに設定した.
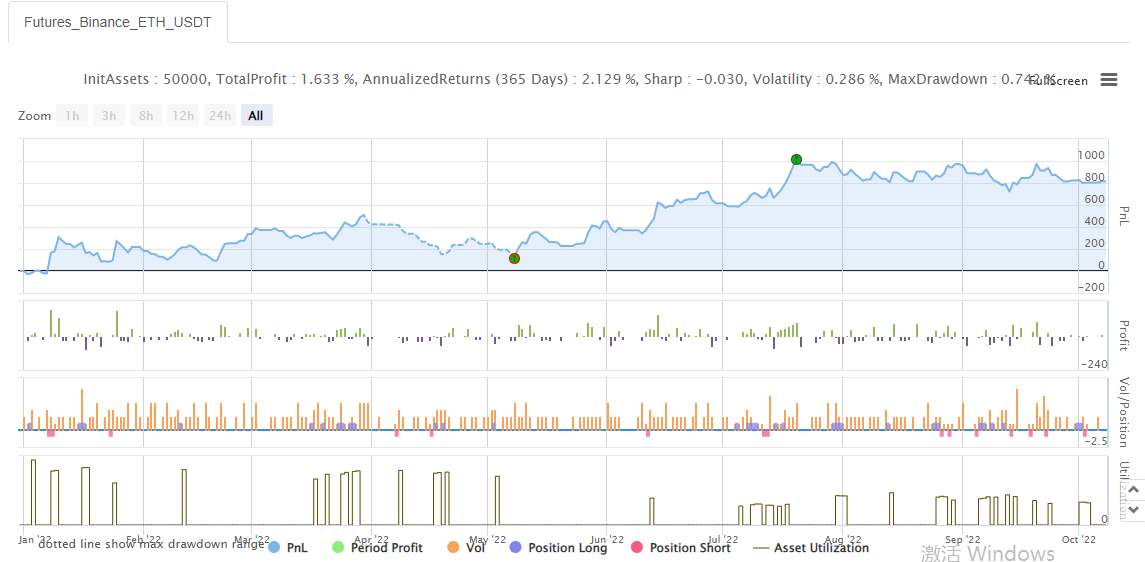
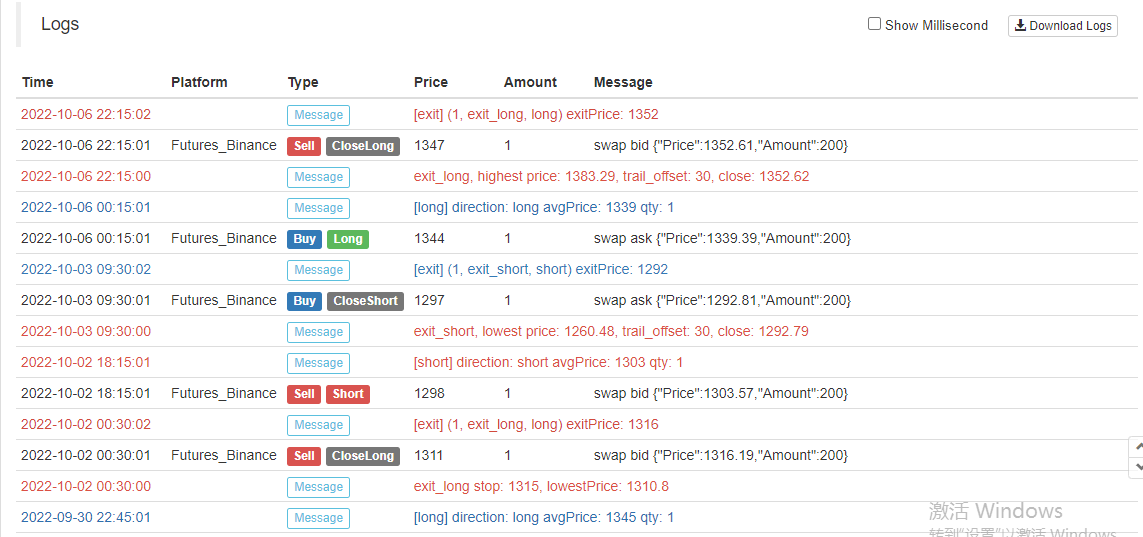
バックテストの結果は普通で,ストップ・ロスのパラメータがバックテスト結果に何らかの影響を及ぼすようです.この側面はまだ最適化され設計する必要があると感じています.しかし,戦略信号が取引を誘発した後,勝利率はまだOKです.
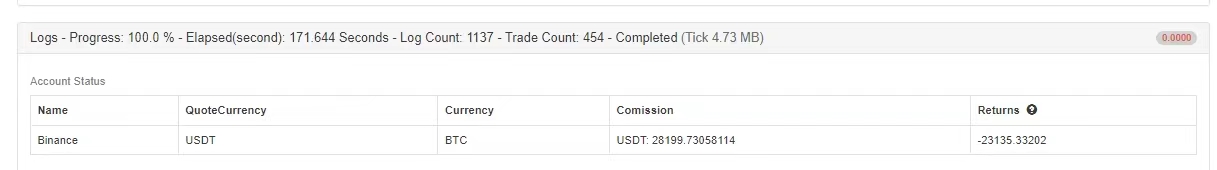
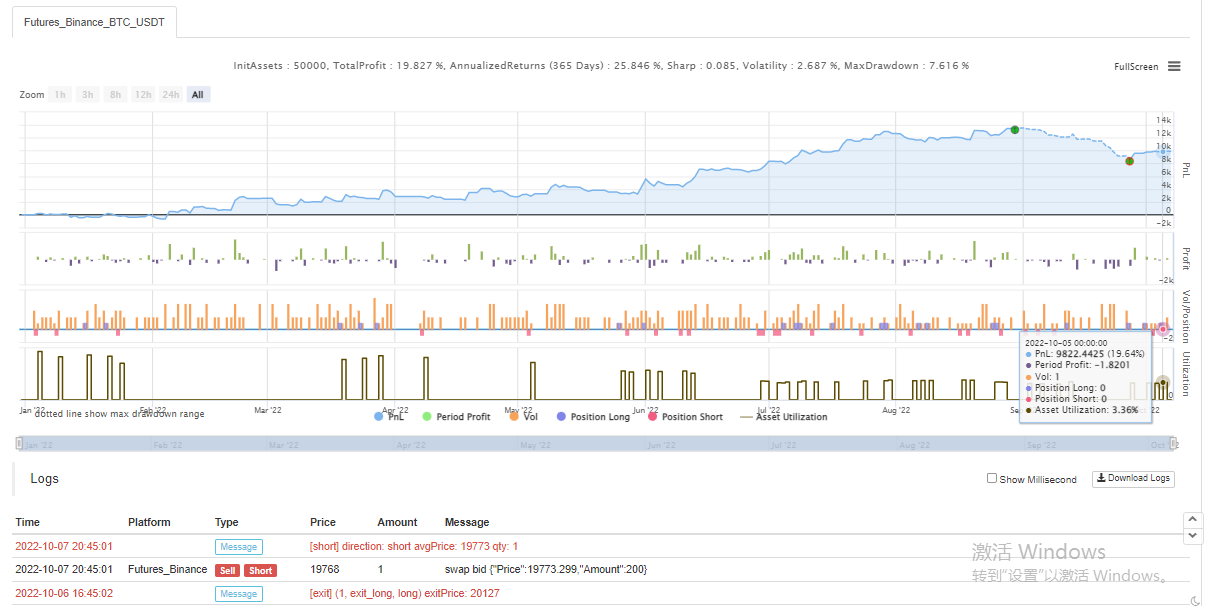
BTC_USDTの永続契約を試してみましょう.
BTCのバックテストの結果も非常に有利でした.
戦略はhttps://www.fmz.com/strategy/385745
このトレードメソッドはトレンドを把握するのに比較的信頼性が高いようです. このアイデアに従ってデザインを最適化し続けることができます. この記事では,ダブル移動平均戦略のアイデアについて学び,またYouTubeのベテランの戦略を処理し学ぶ方法も学びました.OK,上記の戦略コードは私のレンガとモルタルだけです.バックテスト結果は特定のリアルボットの結果を表現していません. 戦略コード,デザインは参照のみです. サポートありがとうございました,次回はお会いします!
- 暗号通貨市場の基本分析を定量化する: データが自分で話せ!
- 通貨圏の基礎的な定量化研究 - 数字を客観的に話すために,あらゆる
教師を信頼しなくていい! - 量化取引の必須ツール - 発明者による量化データ探索モジュール
- すべてをマスターする - FMZの新バージョンの取引ターミナルへの紹介 (TRB仲裁ソースコード)
- FMZの新バージョンの取引端末のご紹介 (TRBの利息ソースコード追加)
- FMZ Quant: 仮想通貨市場における共通要件設計例の分析 (II)
- 80行のコードで高周波戦略で 脳のない販売ボットを利用する方法
- FMZ定量化:仮想通貨市場の常用需要設計事例解析 (II)
- 80行コードの高周波戦略で脳のないロボットを搾取して売る方法
- FMZ Quant: 仮想通貨市場における共通要件設計例の分析 (I)
- FMZ定量化:仮想通貨市場の常用需要設計事例解析 (1)