デジタル通貨先物多種 ATR戦略 (チュートリアル)
作者: リン・ハーンリディア作成日:2022年11月08日 10:34:22 更新日:2023年9月15日 20:55:33 更新日:2023年9月15日 更新日:2023年9月15日 更新日:2023年9月15日 更新日:2023年9月15日 更新日:2023年9月15日 更新日:2023年9月15日 更新日:2023年9月15日
最近,当社のプラットフォームユーザーの何人かは,MyLanguage戦略をJavaScript戦略に移植することを楽しみにしています.これは柔軟に多くの最適化アイデアを追加することができます.さらに戦略をマルチスペイスバージョンに拡張します.MyLanguage戦略は通常トレンド戦略であり,その多くは閉値モデルに基づいて実行されます.戦略リクエスト交換のAPIインターフェースはあまり頻繁ではありません.マルチスペイス戦略バージョンに移植するのに適しています.この記事では,簡単なMyLanguage戦略を例として,JavaScript言語の単純なバージョンに移植します.主な目的は教育とバックアップ研究です.実際のボットを作りたい場合は,いくつかの詳細を追加する必要があります (注文価格,定量精度,注文量制御,資産による注文,状態情報表示など),そして実際のボットテストも必要です.
MyLanguageの戦略を導入する
TR:=MAX(MAX((H-L),ABS(REF(C,1)-H)),ABS(REF(C,1)-L));
ATR:=EMA(TR,LENGTH2);

MIDLINE^^EMA((H + L + C)/3,LENGTH1);
UPBAND^^MIDLINE + N*ATR;
DOWNBAND^^MIDLINE - N*ATR;


BKVOL=0 AND C>=UPBAND AND REF(C,1)<REF(UPBAND,1),BPK;
SKVOL=0 AND C<=DOWNBAND AND REF(C,1)>REF(DOWNBAND,1),SPK;

BKVOL>0 AND C<=MIDLINE,SP(BKVOL);
SKVOL>0 AND C>=MIDLINE,BP(SKVOL);
// stop loss
// stop loss
C>=SKPRICE*(1+SLOSS*0.01),BP;
C<=BKPRICE*(1-SLOSS*0.01),SP;
AUTOFILTER;
この戦略の取引論理は単純である.まず,パラメータに従ってATRを計算し,その後,すべてのKラインBARの最高値,最低値,閉じる価格の平均を計算し,その後,平均データに基づいてEMA指標を計算する.最後に,パラメータにATRと係数Nを組み合わせて,upBandとdownBandを計算する.
オープン・販売ポジションは,閉じる価格に基づいています. アップ・バンドを超えるとロング・ポジションを開き,オープニング・ポジション (ショート・ポジションを保持する場合) を売却します. ダウン・バンドを超えるとショート・ポジションを開き,オープニング・ポジションを売却します. 閉じる価格がミッドラインに達すると,ポジションは閉鎖され,閉じる価格がストップ・ロスの価格に達すると,ポジションも閉鎖されます (SLOSSによると,ストップ・ロスは1で,つまり0.01,つまり1%です). ストラテジーは閉じる価格モデルで実行されます.
MyLanguageの戦略的ニーズやアイデアを理解すれば 移植を始めることができます
移植と設計戦略プロトタイプ
戦略プロトタイプコードは1行から200行まで多くありません.戦略書きアイデアの学習を容易にするため,コメントは戦略コードに直接書かれています.
// parse params parameters, and parse strings as objects
var arrParam = JSON.parse(params)

// this function creates a chart configuration
function createChartConfig(symbol, atrPeriod, emaPeriod, index) {   // symbol : trading pair, atrPeriod : ATR parameter period , emaPeriod : EMA parameter period, exchange object index corresponding to index
    var chart = {
        __isStock: true,
        extension: {
                layout: 'single',
                height: 600,
        },
        title : { text : symbol},
        xAxis: { type: 'datetime'},
        series : [
            {
                type: 'candlestick',    // K-line data series
                name: symbol,
                id: symbol + "-" + index,
                data: []
            }, {
                type: 'line',           // EMA
                name: symbol + ',EMA:' + emaPeriod,
                data: [],
            }, {
                type: 'line',           // upBand
                name: symbol + ',upBand' + atrPeriod,
                data: []
            }, {
                type: 'line',           // downBand
                name: symbol + ',downBand' + atrPeriod,
                data: []
            }, {
                type: 'flags',
                onSeries: symbol + "-" + index,
                data: [],
            }
        ]
    }
    return chart
}

// main Logic
function process(e, kIndex, c) {    // e is the exchange object, exchanges [0]..., kIndex is the K-line data series in the chart, and c is the chart object
    // obtain K-line data
    var r = e.GetRecords(e.param.period)
    if (!r || r.length < e.param.atrPeriod + 2 || r.length < e.param.emaPeriod + 2) {
        // if the K-line data length is insufficient, return
        return
    }

    // calculate ATR indicators
    var atr = TA.ATR(r, e.param.atrPeriod)
    var arrAvgPrice = []
    _.each(r, function(bar) {
        arrAvgPrice.push((bar.High + bar.Low + bar.Close) / 3)
    })
    // calculate EMA indicators
    var midLine = TA.EMA(arrAvgPrice, e.param.emaPeriod)
    // calculate upBand and downBand
    var upBand = []
    var downBand = []
    _.each(midLine, function(mid, index) {
        if (index < e.param.emaPeriod - 1 || index < e.param.atrPeriod - 1) {
            upBand.push(NaN)
            downBand.push(NaN)
            return
        }
        upBand.push(mid + e.param.trackRatio * atr[index])
        downBand.push(mid - e.param.trackRatio * atr[index])
    })

    // draw the chart
    for (var i = 0 ; i < r.length ; i++) {
        if (r[i].Time == e.state.lastBarTime) {
            // update
            c.add(kIndex, [r[i].Time, r[i].Open, r[i].High, r[i].Low, r[i].Close], -1)
            c.add(kIndex + 1, [r[i].Time, midLine[i]], -1)
            c.add(kIndex + 2, [r[i].Time, upBand[i]], -1)
            c.add(kIndex + 3, [r[i].Time, downBand[i]], -1)
        } else if (r[i].Time > e.state.lastBarTime) {
            // add
            e.state.lastBarTime = r[i].Time
            c.add(kIndex, [r[i].Time, r[i].Open, r[i].High, r[i].Low, r[i].Close])
            c.add(kIndex + 1, [r[i].Time, midLine[i]])
            c.add(kIndex + 2, [r[i].Time, upBand[i]])
            c.add(kIndex + 3, [r[i].Time, downBand[i]])
        }
    }

    // check the position
    var pos = e.GetPosition()
    if (!pos) {
        return
    }
    var holdAmount = 0
    var holdPrice = 0
    if (pos.length > 1) {
        throw "long and short positions are checked at the same time!"
    } else if (pos.length != 0) {
        holdAmount = pos[0].Type == PD_LONG ? pos[0].Amount : -pos[0].Amount
        holdPrice = pos[0].Price
    }

    if (e.state.preBar == -1) {
        e.state.preBar = r[r.length - 1].Time
    }
    // check the signal
    if (e.state.preBar != r[r.length - 1].Time) {   // closing price model
        if (holdAmount <= 0 && r[r.length - 3].Close < upBand[upBand.length - 3] && r[r.length - 2].Close > upBand[upBand.length - 2]) {   // the closing price cross over the upBand
            if (holdAmount < 0) {   // hold a short positions, close them
                Log(e.GetCurrency(), "close short positions", "#FF0000")
                $.CoverShort(e, e.param.symbol, Math.abs(holdAmount))
                c.add(kIndex + 4, {x: r[r.length - 2].Time, color: 'red', shape: 'flag', title: 'close', text: "close short positions"})
            }
            // open long positions
            Log(e.GetCurrency(), "open long positions", "#FF0000")
            $.OpenLong(e, e.param.symbol, 10)
            c.add(kIndex + 4, {x: r[r.length - 2].Time, color: 'red', shape: 'flag', title: 'long', text: "open long positions"})
        } else if (holdAmount >= 0 && r[r.length - 3].Close > downBand[downBand.length - 3] && r[r.length - 2].Close < downBand[downBand.length - 2]) {  // the closing price cross down the downBand
            if (holdAmount > 0) {   // hold long positions, close them
                Log(e.GetCurrency(), "close long positions", "#FF0000")
                $.CoverLong(e, e.param.symbol, Math.abs(holdAmount))
                c.add(kIndex + 4, {x: r[r.length - 2].Time, color: 'green', shape: 'flag', title: 'close', text: "close long positions"})
            }
            // open short positions
            Log(e.GetCurrency(), "open short positions", "#FF0000")
            $.OpenShort(e, e.param.symbol, 10)
            c.add(kIndex + 4, {x: r[r.length - 2].Time, color: 'green', shape: 'flag', title: 'short', text: "open short positions"})
        } else {
            // close positions
            if (holdAmount > 0 && (r[r.length - 2].Close <= holdPrice * (1 - e.param.stopLoss) || r[r.length - 2].Close <= midLine[midLine.length - 2])) {   // Hold a long position, the closing price is less than or equal to the midline, stop loss at the opening price
                Log(e.GetCurrency(), "trigger midline or stop loss, close long positions", "#FF0000")
                $.CoverLong(e, e.param.symbol, Math.abs(holdAmount))
                c.add(kIndex + 4, {x: r[r.length - 2].Time, color: 'green', shape: 'flag', title: 'close', text: "close long positions"})
            } else if (holdAmount < 0 && (r[r.length - 2].Close >= holdPrice * (1 + e.param.stopLoss) || r[r.length - 2].Close >= midLine[midLine.length - 2])) {  // Hold a short position, the closing price is greater than or equal to the midline, stop loss at the opening price
                Log(e.GetCurrency(), "trigger midline or stop loss, close short positions", "#FF0000")
                $.CoverShort(e, e.param.symbol, Math.abs(holdAmount))
                c.add(kIndex + 4, {x: r[r.length - 2].Time, color: 'red', shape: 'flag', title: 'close', text: "close short positions"})
            }
        }
        e.state.preBar = r[r.length - 1].Time
    }
}

function main() {
    var arrChartConfig = []
    if (arrParam.length != exchanges.length) {
        throw "Parameters and exchange objects do not match!"
    }
    var arrState = _G("arrState")
    _.each(exchanges, function(e, index) {
        if (e.GetName() != "Futures_Binance") {
            throw "The exchange is not supported!"
        }
        e.param = arrParam[index]
        e.state = {lastBarTime: 0, symbol: e.param.symbol, currency: e.GetCurrency()}
        if (arrState) {
            if (arrState[index].symbol == e.param.symbol && arrState[index].currency == e.GetCurrency()) {
                Log("restore:", e.state)
                e.state = arrState[index]
            } else {
                throw "The restored data does not match the current settings!"
            }
        }
        e.state.preBar = -1   // initial setting -1
        e.SetContractType(e.param.symbol)
        Log(e.GetName(), e.GetLabel(), "set contracts:", e.param.symbol)
        arrChartConfig.push(createChartConfig(e.GetCurrency(), e.param.atrPeriod, e.param.emaPeriod, index))
    })
    var chart = Chart(arrChartConfig)
    chart.reset()

    while (true) {
        _.each(exchanges, function(e, index) {
            process(e, index + index * 4, chart)
            Sleep(500)
        })
    }
}

function onexit() {
    // record e.state
    var arrState = []
    _.each(exchanges, function(e) {
        arrState.push(e.state)
    })
    Log("record:", arrState)
    _G("arrState", arrState)
}
戦略パラメータ:
var params = '[{
        "symbol" : "swap",    // contract code
        "period" : 86400,     // K-line period, 86,400 seconds is a day
        "stopLoss" : 0.07,    // stop loss factor, 0.07 or 7%
        "atrPeriod" : 10,     // ATR indicator parameters
        "emaPeriod" : 10,     // EMA indicator parameters
        "trackRatio" : 1,     // upBand and downBand coefficients
        "openRatio" : 0.1     // The reserved opening percentage, which is not supported for now
    }, {
        "symbol" : "swap",
        "period" : 86400,
        "stopLoss" : 0.07,
        "atrPeriod" : 10,
        "emaPeriod" : 10,
        "trackRatio" : 1,
        "openRatio" : 0.1
    }]'
バックテストスクリーンショット:
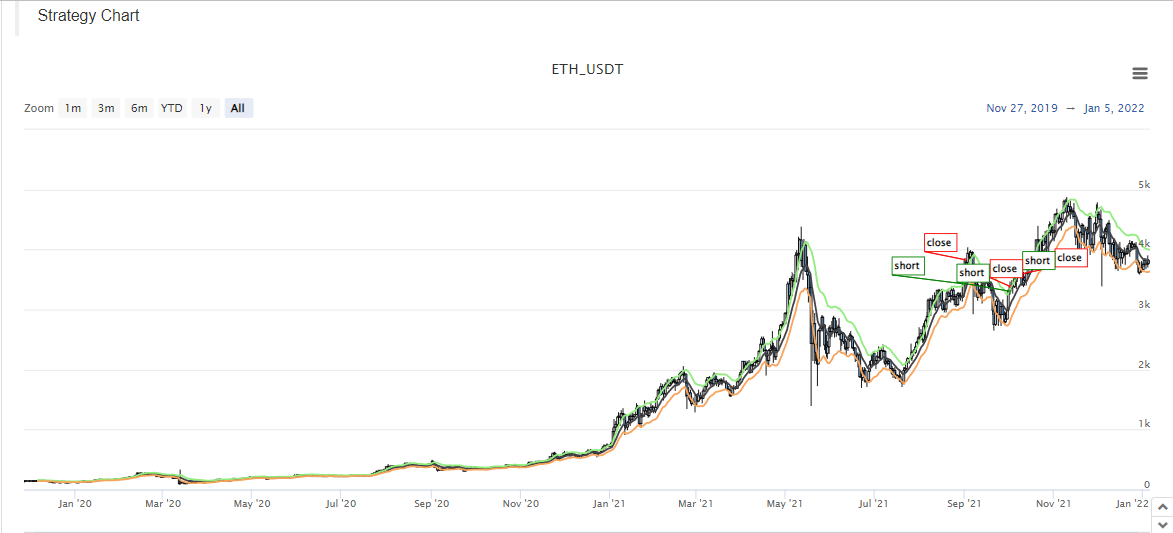
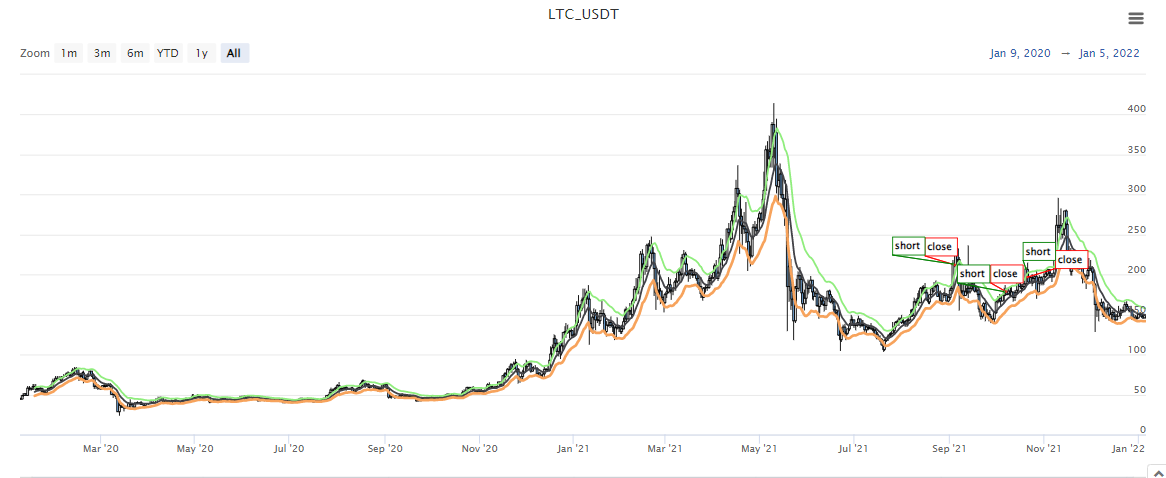
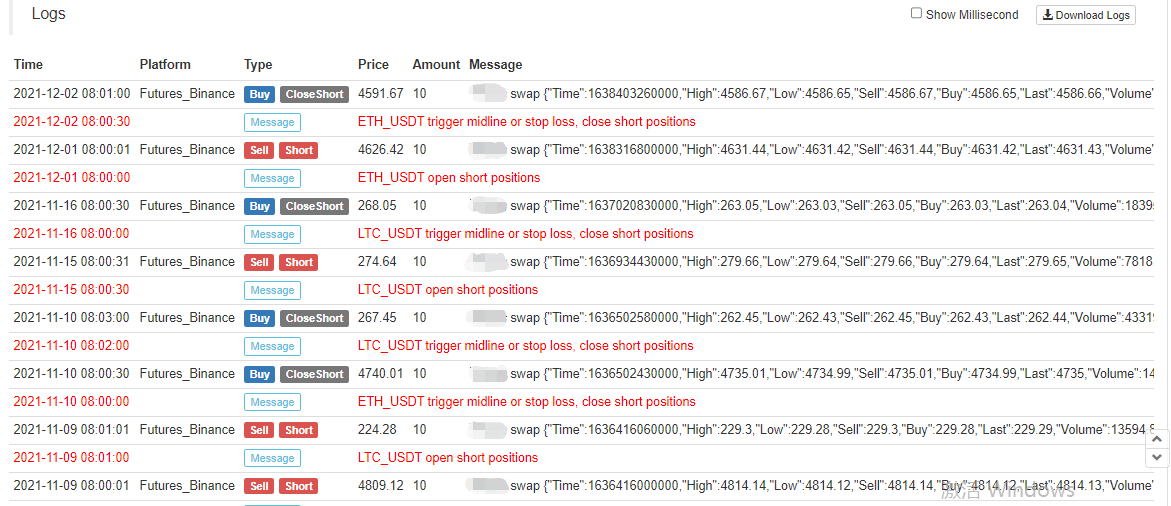
戦略のソースコード:https://www.fmz.com/strategy/339344
戦略はバックテストと学習研究のみです. 変更,最適化,そして本物のボットを参照してください.
- 暗号通貨市場の基本分析を定量化する: データが自分で話せ!
- 通貨圏の基礎的な定量化研究 - 数字を客観的に話すために,あらゆる
教師を信頼しなくていい! - 量化取引の必須ツール - 発明者による量化データ探索モジュール
- すべてをマスターする - FMZの新バージョンの取引ターミナルへの紹介 (TRB仲裁ソースコード)
- FMZの新バージョンの取引端末のご紹介 (TRBの利息ソースコード追加)
- FMZ Quant: 仮想通貨市場における共通要件設計例の分析 (II)
- 80行のコードで高周波戦略で 脳のない販売ボットを利用する方法
- FMZ定量化:仮想通貨市場の常用需要設計事例解析 (II)
- 80行コードの高周波戦略で脳のないロボットを搾取して売る方法
- FMZ Quant: 仮想通貨市場における共通要件設計例の分析 (I)
- FMZ定量化:仮想通貨市場の常用需要設計事例解析 (1)