戦略にマルチチャートサポートを追加することを教える
作者: リン・ハーンリディア, 作成日:2022-12-26 11:28:50, 更新日:2023-09-20 09:52:47
戦略にマルチチャートサポートを追加することを教える
トレンド戦略を書くとき,特に様々な指標のトリガー条件によって混乱することがあります.この時点で,分析と表示のためにデータを視覚化することが緊急です. 戦略に単一のチャートを追加するときに,チャートを直接描くために"図書図書室"テンプレートを使用できます. しかし,時には異なるK線周期を持つ複数のチャートを持つ必要があり,または指標のためにY軸を別々に使用することもあります. このようにして,図書コードは別々に実装する必要があります.
参照のための例です. サンプルコードの行ごとにコメントします. コードを読み終えると,戦略にチャートサポートを追加する新しい理解を得ることができます.
/*backtest
start: 2019-07-01 00:00:00
end: 2019-08-24 00:00:00
period: 1h
exchanges: [{"eid":"Futures_OKCoin","currency":"BTC_USD"}]
args: [["IsSynthesisDayKL",true]]
*/

var chart0 = {
    __isStock: true,
    // /*
    extension: {
            layout: 'single',
            height: 300,
    },
    // */
    title : { text : 'Daily K-line chart'},
    xAxis: { type: 'datetime'},
    series : [
        {
            type: 'candlestick',
            name: 'r',
            id: 'r',
            data: []
        }
    ]
}

var chart1 = {
    __isStock: true,
    // /*
    extension: {
            layout: 'single',
            height: 300,
    },
    // */
    title : { text : 'EMA'},
    xAxis: { type: 'datetime'},
    series : [
        {
            type: 'candlestick',
            name: 'r1',
            id: 'r1',
            data: []
        }, {
            type: 'line',
            name: 'chart1_EMA1',
            data: [],
        }, {
            type: 'line',
            name: 'chart1_EMA2',
            data: []
        }
    ]
}

var chart2 = {
    __isStock: true,
    // /*
    extension: {
            layout: 'single',
            height: 300,
    },
    // */
    title : { text : 'MACD'},
    xAxis: { type: 'datetime'},
    yAxis : [
        {
            title: {text: 'price'},
            opposite: false
        }, {
            title:{text: "Indicator axis"},
            opposite: true,
        }
    ],
    series : [
        {
            type: 'candlestick',
            name: 'r2',
            id: 'r2',
            data: []
        }, {
            type: 'line',
            yAxis: 1,
            name: 'dif',
            data: []
        }, {
            type: 'line',
            yAxis: 1,
            name: 'dea',
            data: []
        }
    ]
}

function CreatePlotter (e, chart) {
    var obj = {}                      // Declare an empty object for adding methods in the following code, and finally return this object, that is, the constructed drawing object.

    obj.e = e                         // The reference to the exchange object passed by the parameter is assigned to a property of the obj object.
    obj.params = {}                   // Constructed parameters
    obj.params.EMA_param1 = 5         // We preset the parameters of some indicators on the chart to be used in the calculation of the indicator, for example, an EMA indicator line parameter.
    obj.params.EMA_param2 = 20        // The second EMA indicator line parameters, usually small parameters are called fast lines, large parameters are called slow lines.
    obj.params.MACD_fast = 12         // MACD parameter
    obj.params.MACD_slow = 26         // MACD parameter
    obj.params.MACD_sig = 9           // MACD parameter

    obj.runTime = {}                  // Used to store some data during runtime.
    obj.runTime.arrPreBarTime = [0, 0, 0]    // Store the timestamp of the previous bar of each K-line data for comparison.

    obj.GetAllRecords = function () {              // A method of the drawing object, used to get the K-line data, our example is used to display three charts at the same time, so, the function get three different periods of K-line data at the same time.
        obj.r = _C(obj.e.GetRecords, PERIOD_H1)    // The K-line data of the first chart, which is the 1-hour level K-line data.
        Sleep(1000)
        obj.r1 = _C(obj.e.GetRecords, PERIOD_M15)  // The K-line data of the second chart, which is the 15-minute level K-line data.
        Sleep(1000)
        obj.r2 = _C(obj.e.GetRecords, PERIOD_D1)   // The K-line data of the third chart, which is the daily level K-line data.
    }

    obj.Run = function () {                        // Execute the functions of drawing objects.
        obj.Plot()                                 // Execute the specific drawing code.
    }

    obj.CalcMACD = function (r, fast, slow, sig) {       // MACD indicator calculation function, return MACD indicator data.
        if (r.length <= Math.max(fast, slow, sig)) {
            return false
        }
        return TA.MACD(r, fast, slow, sig)
    }


    obj.Plot = function () {                   // Focus section with specific drawing code.
        obj.GetAllRecords()                    // Before each plot, update all K-line data first.
        var arr = [obj.r, obj.r1, obj.r2]      // Put all K-line data in an array and traverse it.
        var arrKIndex = [0, 1, 4]              // Indexing of K-line data series in chart objects.
        for (var i = 0; i < arr.length; i++) { // Traversal operations
            for (var j = 0; j < arr[i].length; j++) {
                if (arr[i][j].Time == obj.runTime.arrPreBarTime[i]) {    // When the last bar of the K-line data is not updated, we only update the data and do not add it. Note that when the chart.add function is called, the last parameter uses -1, which means that the data is updated and not added.
                    chart.add(arrKIndex[i], [arr[i][j].Time, arr[i][j].Open, arr[i][j].High, arr[i][j].Low, arr[i][j].Close], -1)

                   if (i == 1) {    // Update the EMA indicator data in the second chart.
                        var nowR = arr[i].slice(0, j + 1)
                        var ema1 = TA.EMA(nowR, obj.params.EMA_param1)
                        var ema2 = TA.EMA(nowR, obj.params.EMA_param2)
                        if (obj.r2.length <= obj.params.EMA_param1 || obj.r2.length <= obj.params.EMA_param2 || isNaN(ema1[j]) || isNaN(ema2[j])) {
                            continue
                        }

                        chart.add(2, [arr[i][j].Time, ema1[ema1.length - 1]], -1)
                        chart.add(3, [arr[i][j].Time, ema2[ema2.length - 1]], -1)
                    } else if (i == 2) {     // Update the MACD indicator data in the third chart
                        var nowR = arr[i].slice(0, j + 1)
                        var macd = obj.CalcMACD(nowR, obj.params.MACD_fast, obj.params.MACD_slow, obj.params.MACD_sig)
                        if (!macd) {
                            continue
                        }

                        var dif = macd[0]
                        var dea = macd[1]
                        chart.add(5, [arr[i][j].Time, dif[dif.length - 1]], -1)
                        chart.add(6, [arr[i][j].Time, dea[dea.length - 1]], -1)
                    }
                } else if (arr[i][j].Time > obj.runTime.arrPreBarTime[i]) {   // When the last bar of the current K-line data is larger than the last bar timestamp recorded previously, it indicates that a new bar has been generated for the K-line. At this time, a new bar and a new indicator data point should be added.
                    obj.runTime.arrPreBarTime[i] = arr[i][j].Time             // Update the record of the last bar timestamp for the next comparison. If the next timestamp is the same, data will not be added unless a new bar is generated.
                    chart.add(arrKIndex[i], [arr[i][j].Time, arr[i][j].Open, arr[i][j].High, arr[i][j].Low, arr[i][j].Close])
                    if (i == 1) {
                        var nowR = arr[i].slice(0, j + 1)
                        var ema1 = TA.EMA(nowR, obj.params.EMA_param1)
                        var ema2 = TA.EMA(nowR, obj.params.EMA_param2)
                        if (nowR.length <= obj.params.EMA_param1 || nowR.length <= obj.params.EMA_param2 || isNaN(ema1[ema1.length - 1]) || isNaN(ema2[ema2.length - 1])) {
                            continue
                        }

                        chart.add(2, [arr[i][j].Time, ema1[ema1.length - 1]])
                        chart.add(3, [arr[i][j].Time, ema2[ema2.length - 1]])
                    } else if (i == 2) {
                        var nowR = arr[i].slice(0, j + 1)
                        var macd = obj.CalcMACD(nowR, obj.params.MACD_fast, obj.params.MACD_slow, obj.params.MACD_sig)
                        if (!macd) {
                            continue
                        }

                        var dif = macd[0]
                        var dea = macd[1]
                        chart.add(5, [arr[i][j].Time, dif[dif.length - 1]])
                        chart.add(6, [arr[i][j].Time, dea[dea.length - 1]])
                    }
                }
            }
        }
    }
    obj.Plot()

    return obj
}

function main () {
    var chart = Chart([chart0, chart1, chart2])
    chart.reset()

    exchange.SetContractType("quarter")
    var plotter = CreatePlotter(exchange, chart)
    while (true) {
        plotter.Run()
        Sleep(1000)
    }
}
まず 分析を進めますmain機能:
function main () {                                  // Strategy entry function, of course, this strategy does not do anything, there are no transactions, just drawing charts.
    var chart = Chart([chart0, chart1, chart2])     // chart0, chart1, chart2 are pre-declared chart configuration objects, call the Chart function is to load the chart configuration, return a chart control object chart.
    chart.reset()                                   // Call the reset method of the chart control object chart to reset the chart.

    exchange.SetContractType("quarter")             // The backtest configuration is OKX futures, so here to set the contract, the contract is set to quarter.
    var plotter = CreatePlotter(exchange, chart)    // Call the CreatePlotter function to generate the plotter object -- plotter.
    while (true) {
        plotter.Run()                               // Execute drawing object plotter member function Run to draw.
        Sleep(1000)                                 // The drawing object plotter is responsible for "how to draw", and the chart control object chart is responsible for specific drawing. The former is implemented by our code, and the latter is the control object returned by the underlying API function of the system.
    }
}
グラフで示したCreatePlotter図形オブジェクトを構成する際に図形関数を実装します.var plotter=CreatePlotter(exchange, chart)図表のプロットには,交換とグラフが伝わります.前者はK線データを取得するために使用されます (exchange.GetRecordsを呼び出し),後者はグラフを操作し,グラフにデータを追加するために使用されます.
物語の最も重要な部分はPlotコードにコメントが書かれています.
バックテスト操作:
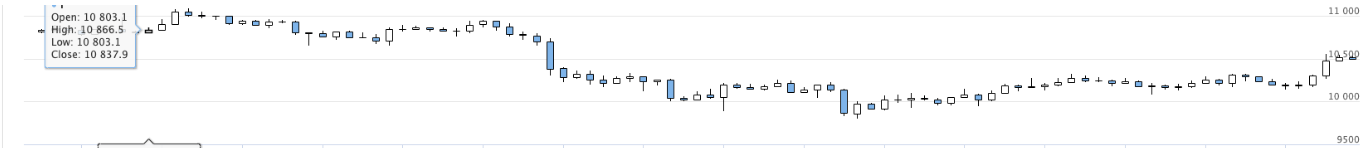
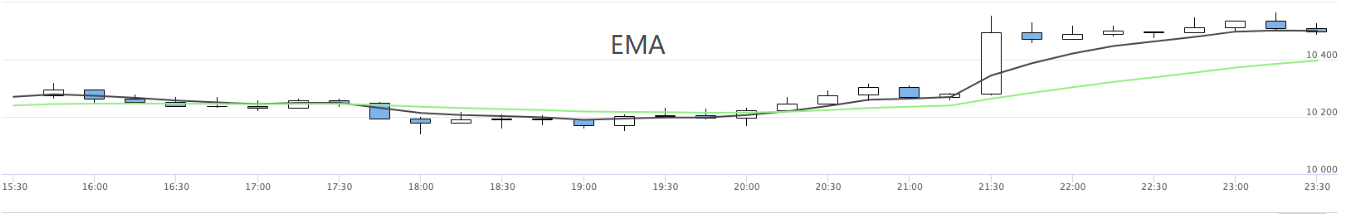
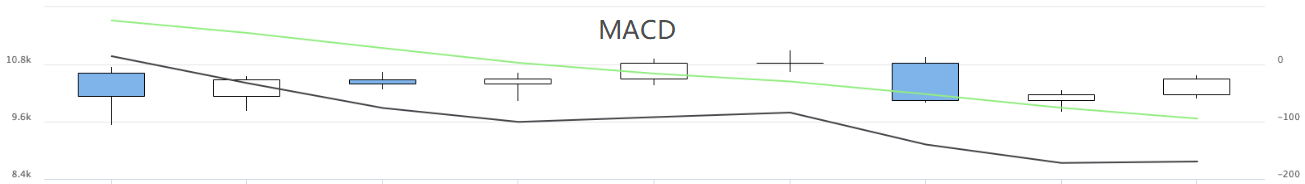
戦略の複数のチャートが表示されます.
関連性
- 暗号通貨市場の基本分析を定量化する: データが自分で話せ!
- 通貨圏の基礎的な定量化研究 - 数字を客観的に話すために,あらゆる
教師を信頼しなくていい! - 量化取引の必須ツール - 発明者による量化データ探索モジュール
- すべてをマスターする - FMZの新バージョンの取引ターミナルへの紹介 (TRB仲裁ソースコード)
- FMZの新バージョンの取引端末のご紹介 (TRBの利息ソースコード追加)
- FMZ Quant: 仮想通貨市場における共通要件設計例の分析 (II)
- 80行のコードで高周波戦略で 脳のない販売ボットを利用する方法
- FMZ定量化:仮想通貨市場の常用需要設計事例解析 (II)
- 80行コードの高周波戦略で脳のないロボットを搾取して売る方法
- FMZ Quant: 仮想通貨市場における共通要件設計例の分析 (I)
- FMZ定量化:仮想通貨市場の常用需要設計事例解析 (1)
もっと