複数の均衡価格トレンドフォローと反転取引戦略

1
Follow
1781
Followers
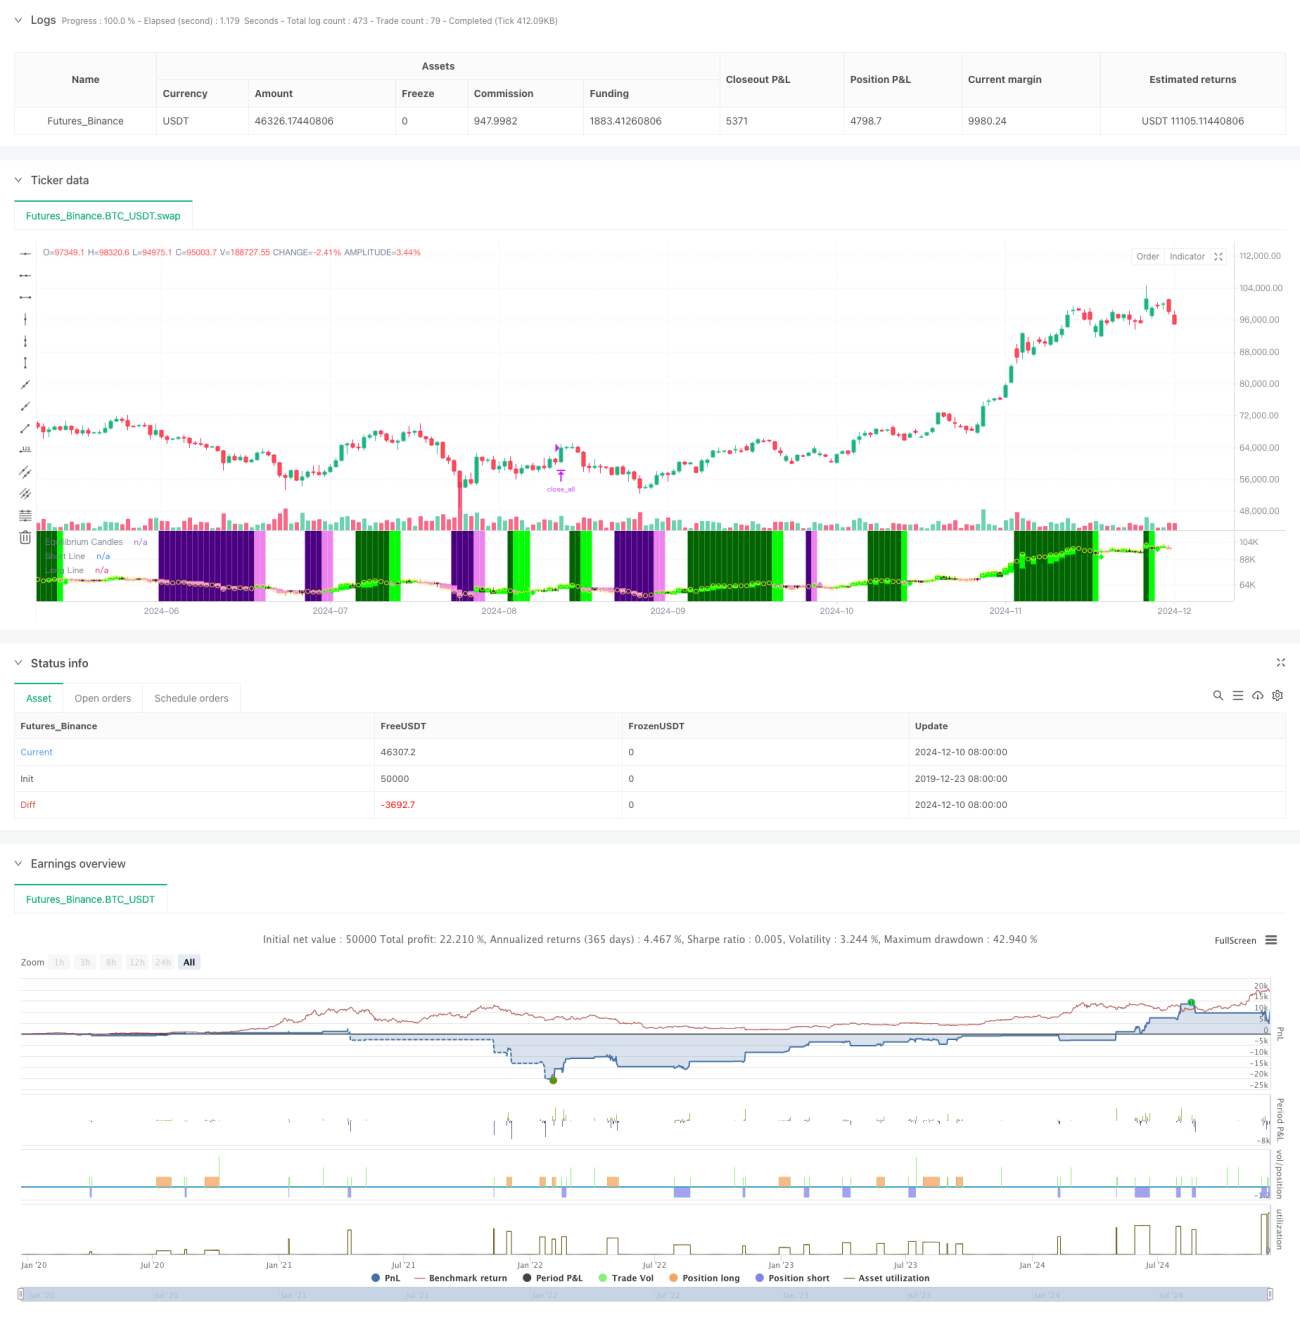
戦略概要
この戦略は,価格均衡点に基づくトレンド追跡および反転取引システムである.過去X根K線の最高点と最低点の中間値を計算して均衡価格を決定し,収束価格が均衡価格に対する位置によってトレンド方向を判断する.価格が均衡価格の片側に連続して維持され,設定されたK線の数に達すると,システムはトレンドを認識する.最初の反動時に形成された ((価格が均衡価格を突破する) システムでは,入場チャンスを求める.この戦略は,設定されたトレンド追跡または反転取引モードを選択することができる.
戦略原則
- 均衡価格計算:過去X根K線の最高価格と最低価格の中間点を均衡価格として使用し,これは一目均衡図の基準線計算方法と同じである.
- トレンド判定:価格が均衡価格の同じ側で連続してX根K線 (デフォルト7根) を維持するときは,トレンドとして判定される.
- 入場シグナル:トレンドが確立された後の最初の回調 (価格が均衡価格を突破する) 時に入場シグナルをトリガーする.
- ストップ・ストップ:ATRの60%の分数を用いてストップ・ストップ距離を動的に調整し,リスク管理の柔軟性を提供します.
- 大幅な変動保護:価格が均衡点から偏って設定されたATR倍数を超えると,システムは,大幅な引き下げを防ぐために自動的に平仓する.
戦略的優位性
- 適応性:市場の特性に合わせてトレンドを追跡し,逆転する取引モデルに柔軟に切り替えることができます.
- リスク管理は完備:動的なATRの停止と,大幅な波動の保護メカニズムがある.
- 操作の明快さ:取引信号は明快で,複雑な技術指標の組み合わせに依存しません.
- カラーK線と背景を使って市場状況を直感的に表示する.
- 自動化フレンドリー:MT5などの取引プラットフォームを簡単にペアして自動化取引を実現できます.
戦略リスク
- 横盤の振動市場では,頻繁に偽信号が生じることがあります.
- スライドポイントの影響: 激しい波動で大きなスライドポイントに直面する可能性があります.
- パラメータの感受性:均衡期,トレンド判断周期などのコアパラメータは,異なる市場に対して注意深く最適化する必要があります.
- 市場切り替えリスク:市場がトレンドから震動へと移行する時期は,大きな反発を引き起こす可能性がある.
戦略最適化の方向性
- 市場環境認識:市場環境判断モジュールを追加し,異なる市場条件で動的に戦略パラメータを調整する.
- 信号フィルタリング:偽信号をフィルタリングするために,交通量,波動率などの補助指標を追加することを検討する.
- ポジション管理:波動率に基づく動的調整のようなより複雑なポジション管理機構を導入する.
- 複数のタイムサイクル:取引の正確性を高めるために複数のタイムサイクルから信号を統合する.
- 取引コストの最適化: 異なる取引品種に対するコスト特性を最適化して市場に出るタイミング.
要約する
これは合理的に設計されたトレンド取引システムであり,均衡価格という核心概念によって明確な取引論理を提供します. この戦略の最大の特徴は,トレンド追跡と逆転取引の両方に使用できる柔軟性であり,完全なリスク制御機構を有しています. いくつかの市場条件下で挑戦される可能性がありますが,継続的な最適化と柔軟な調整により,この戦略は,さまざまな市場環境で安定したパフォーマンスを維持する見込みがあります.
Source
Pine
Strategy parameters
Related strategies
Comment
All comments (0)
No data
- 1