초보자용 암호화폐 양적 거래 - 암호화폐 양적 거래에 더 가까워지도록 (5)
저자:리디아, 창작: 2022-08-03 16:08:50, 업데이트: 2023-09-21 21:07:02
이전 기사에서는 간단한 그리드 전략의 거래 논리 분석을 설명했습니다. 이 기사에서는 이 튜토리얼 전략의 디자인을 계속 완료할 것입니다.
-
거래 논리 분석 이전 기사에서 언급했듯이, 각 그리드 라인을 가로질러 현재 가격의 위 또는 아래의 교차를 판단하여 거래 동작을 유발할 수 있습니다. 그러나 실제로는 여전히 많은 논리 세부 사항이 있으며 전략 글쓰기를 이해하지 못하는 초보자도 종종 논리가 매우 간단하며 코드가 몇 줄에 불과해야하지만 실제 글쓰기에서 발견되는 많은 세부 사항이 있습니다.
우리가 고려해야 할 첫 번째 세부 사항은 무한 격자 설계입니다.
createNet이 함수는 제한된 수의 그리드 라인을 가진 그리드 데이터 구조를 생성합니다. 그렇다면 전략이 실행될 때 가격이 이 그리드 데이터 구조의 경계를 넘어서면 (가격이 가장 높은 상위 그리드 라인과 가장 낮은 하위 그리드 라인을 넘어서면) 어떻게 될까요? 그래서 먼저 네트워크 데이터 구조에 확장 메커니즘을 추가해야 합니다.전략의 주요 함수를 작성하기 시작해 봅시다. 전략이 실행되기 시작하는 코드입니다.
var diff = 50                                 // Global variables and grid spacing can be designed as parameters for easy explanation. We write this parameter into the code.
function main() {
    // After the real bot starts running, execute the strategy code from here
    var ticker = _C(exchange.GetTicker)       // To get the latest market data ticker, please refer to the FMZ API documentation for the structure of the ticker data: https://www.fmz.com/api#ticker
    var net = createNet(ticker.Last, diff)    // The function we designed in the previous article to construct the grid data structure initially, here we construct a grid data structure net

    while (true) {                            // Then the program logic enters this while infinite loop, and the strategy execution will continue to execute the code within the {} symbol here.
        ticker = _C(exchange.GetTicker)       // The first line of the infinite loop code section, get the latest market data and update it to the ticker variable
        // Check the grid range
        while (ticker.Last >= net[net.length - 1].price) {
            net.push({
                buy : false,
                sell : false,
                price : net[net.length - 1].price + diff,
            })
        }
        while (ticker.Last <= net[0].price) {
            var price = net[0].price - diff
            if (price <= 0) {
                break
            }
            net.unshift({
                buy : false,
                sell : false,
                price : price,
            })
        }

        // There are other codes...
    }
}
그리드 데이터 구조를 확장할 수 있도록 하는 것은 다음 코드 (위 코드에서 추출된):
      // Check the grid range
      while (ticker.Last >= net[net.length - 1].price) {   // If the price exceeds the grid line of the highest price of the grid
          net.push({                                       // Just add a new grid line after the grid line with the highest price of the grid
              buy : false,                                 // Initialize sell marker
              sell : false,                                // Initialize buy marker
              price : net[net.length - 1].price + diff,    // dd a grid spacing to the previous highest price
          })
      }
      while (ticker.Last <= net[0].price) {                // If the price is lower than the grid line of the lowest price of the grid
          var price = net[0].price - diff                  // Different from adding upwards, it should be noted that the price of adding new grid lines downwards cannot be less than or equal to 0, so it is necessary to judge here
          if (price <= 0) {                                // Less than or equal to 0 will not be added, jump out of this loop
              break
          }
          net.unshift({                                    // Add a new grid line just before the grid line with the lowest price of the grid
              buy : false,
              sell : false,
              price : price,
          })
      }
다음 단계는 트레이딩 트리거를 구체적으로 구현하는 방법을 고려하는 것입니다.
var diff = 50
var amount = 0.002       // Add a global variable, which can also be designed as a parameter. Of course, for the sake of simplicity, we also write it in the strategy code.
                         // This parameter controls the trade volume each time a trade is triggered on the grid line
function main() {
    var ticker = _C(exchange.GetTicker)
    var net = createNet(ticker.Last, diff)
    var preTicker = ticker       // Before the main loop (fixed loop) starts, set a variable to record the last market data
    while (true) {
        ticker = _C(exchange.GetTicker)
        // Check the grid range
        while (ticker.Last >= net[net.length - 1].price) {
            net.push({
                buy : false,
                sell : false,
                price : net[net.length - 1].price + diff,
            })
        }
        while (ticker.Last <= net[0].price) {
            var price = net[0].price - diff
            if (price <= 0) {
                break
            }
            net.unshift({
                buy : false,
                sell : false,
                price : price,
            })
        }

        // Retrieve grid
        for (var i = 0 ; i < net.length ; i++) {     // Iterate over all grid lines in the grid data structure
            var p = net[i]
            if (preTicker.Last < p.price && ticker.Last > p.price) {         // Above the SMA, sell, the current node has already traded, regardless of SELL BUY, it will no longer be traded
                if (i != 0) {
                    var downP = net[i - 1]
                    if (downP.buy) {
                        exchange.Sell(-1, amount, ticker)
                        downP.buy = false
                        p.sell = false
                        continue
                    }
                }
                if (!p.sell && !p.buy) {
                    exchange.Sell(-1, amount, ticker)
                    p.sell = true
                }
            } else if (preTicker.Last > p.price && ticker.Last < p.price) {  // Below the SMA, buy
                if (i != net.length - 1) {
                    var upP = net[i + 1]
                    if (upP.sell) {
                        exchange.Buy(-1, amount * ticker.Last, ticker)
                        upP.sell = false
                        p.buy = false
                        continue
                    }
                }
                if (!p.buy && !p.sell) {
                    exchange.Buy(-1, amount * ticker.Last, ticker)
                    p.buy = true
                }
            }
        }
        preTicker = ticker    // Record the current market data in preTicker, and in the next cycle, use it as a comparison between the "previous" market data and the latest one to judge whether to be above the SMA or below the SMA.
        Sleep(500)
    }
}
다음과 같은 것을 볼 수 있습니다.
- 격자선 위의 교차 조건:
preTicker.Last < p.price && ticker.Last > p.price - 격자선 아래를 통과하는 조건:
preTicker.Last > p.price && ticker.Last < p.price
이것은 우리가 이전 게시물에서 말한 것입니다.
- 격자선 위의 교차 조건:
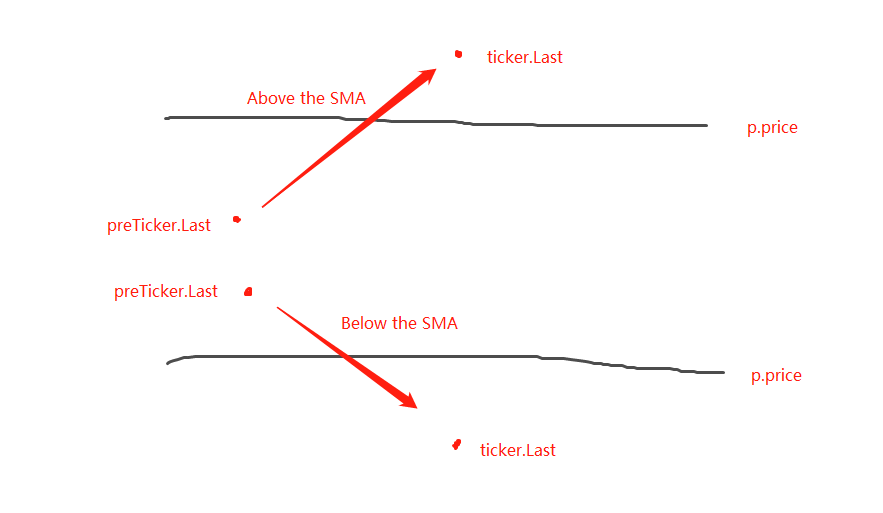
SMA 이상 또는 SMA 이하가 될지 판단하는 것은 주문을 할 수 있는지 판단하는 첫 번째 단계일 뿐이고, 그리드 라인 데이터의 마크를 판단하는 것도 필요합니다.
만약 SMA보다 높다면, 가격은 현재 그리드 라인과 가장 가까운 그리드 라인의 구매 마크보다 낮다고 판단됩니다. 만약 구매 마크의 값이 사실이라면, 그것은 이전 그리드 라인이 구매되었고, 이전 구매 마크를 거짓으로 재설정하고, 현재 그리드 라인을 거짓으로 재설정하는 것을 의미합니다.
조건들을 판단한 후, 트리거가 없다면 계속 판단한다. 현재 그리드 라인의 구매/판매 마크가 모두 거짓이라면, 현재 그리드 라인이 거래될 수 있다는 뜻이다. 현재 그리드 라인이 SMA 위에 있기 때문에, 여기서 판매 작전을 수행할 것이다. 실행 후, 현재 그리드 라인의 판매 마크를 true로 표시한다.
처리 논리는 SMA 아래에서 동일한 것입니다.
전체 전략 백테스팅
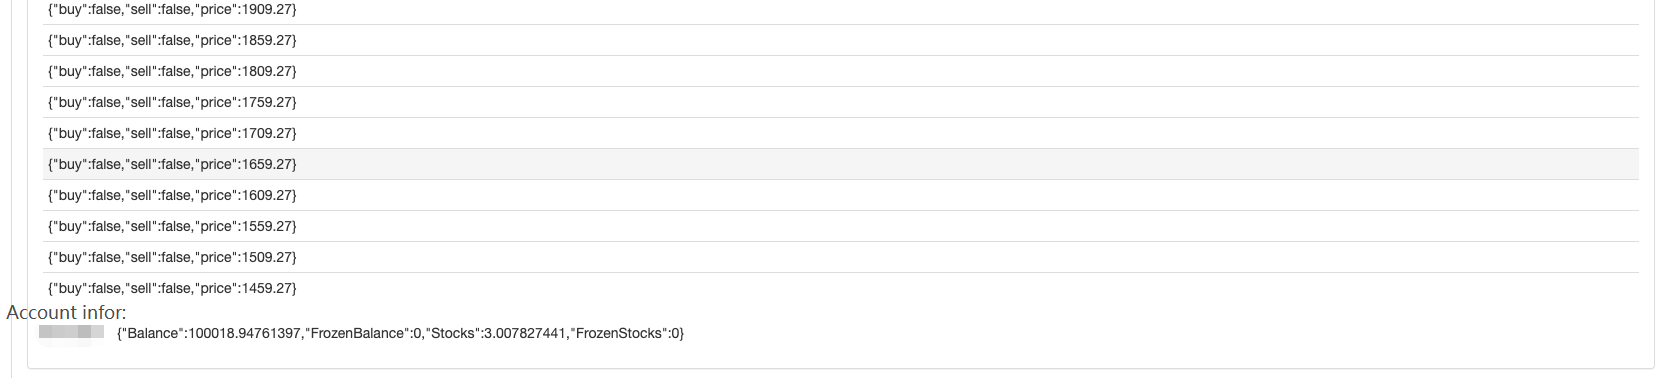
백테스팅 중에 어떤 데이터를 보려면, 함수showTbl데이터를 표시하기 위해 작성되었습니다.
function showTbl(arr) {
    var tbl = {
        type : "table",
        title : "grid",
        cols : ["grid information"],
        rows : []
    }
    var arrReverse = arr.slice(0).reverse()
    _.each(arrReverse, function(ele) {
        var color = ""
        if (ele.buy) {
            color = "#FF0000"
        } else if (ele.sell) {
            color = "#00FF00"
        }
        tbl.rows.push([JSON.stringify(ele) + color])
    })
    LogStatus(_D(), "\n`" + JSON.stringify(tbl) + "`", "\n account Information:", exchange.GetAccount())
}
전체 전략 코드:
/*backtest
start: 2021-04-01 22:00:00
end: 2021-05-22 00:00:00
period: 1d
basePeriod: 1m
exchanges: [{"eid":"OKEX","currency":"ETH_USDT","balance":100000}]
*/

var diff = 50
var amount = 0.002
function createNet(begin, diff) {
    var oneSideNums = 10
    var up = []
    var down = []
    for (var i = 0 ; i < oneSideNums ; i++) {
        var upObj = {
            buy : false,
            sell : false,
            price : begin + diff / 2 + i * diff,
        }
        up.push(upObj)

        var j = (oneSideNums - 1) - i
        var downObj = {
            buy : false,
            sell : false,
            price : begin - diff / 2 - j * diff,
        }
        if (downObj.price <= 0) {  // The price cannot be less than or equal to 0
            continue
        }
        down.push(downObj)
    }

    return down.concat(up)
}

function showTbl(arr) {
    var tbl = {
        type : "table",
        title : "grid",
        cols : ["grid Information"],
        rows : []
    }
    var arrReverse = arr.slice(0).reverse()
    _.each(arrReverse, function(ele) {
        var color = ""
        if (ele.buy) {
            color = "#FF0000"
        } else if (ele.sell) {
            color = "#00FF00"
        }
        tbl.rows.push([JSON.stringify(ele) + color])
    })
    LogStatus(_D(), "\n`" + JSON.stringify(tbl) + "`", "\n account Information:", exchange.GetAccount())
}

function main() {
    var ticker = _C(exchange.GetTicker)
    var net = createNet(ticker.Last, diff)
    var preTicker = ticker
    while (true) {
        ticker = _C(exchange.GetTicker)
        // Check the grid range
        while (ticker.Last >= net[net.length - 1].price) {
            net.push({
                buy : false,
                sell : false,
                price : net[net.length - 1].price + diff,
            })
        }
        while (ticker.Last <= net[0].price) {
            var price = net[0].price - diff
            if (price <= 0) {
                break
            }
            net.unshift({
                buy : false,
                sell : false,
                price : price,
            })
        }

        // Retrieve grid
        for (var i = 0 ; i < net.length ; i++) {
            var p = net[i]
            if (preTicker.Last < p.price && ticker.Last > p.price) {         // Being above the SMA, sell, the current node has already traded, regardless of SELL BUY, it will no longer be traded
                if (i != 0) {
                    var downP = net[i - 1]
                    if (downP.buy) {
                        exchange.Sell(-1, amount, ticker)
                        downP.buy = false
                        p.sell = false
                        continue
                    }
                }
                if (!p.sell && !p.buy) {
                    exchange.Sell(-1, amount, ticker)
                    p.sell = true
                }
            } else if (preTicker.Last > p.price && ticker.Last < p.price) {  // Being below the SMA, buy
                if (i != net.length - 1) {
                    var upP = net[i + 1]
                    if (upP.sell) {
                        exchange.Buy(-1, amount * ticker.Last, ticker)
                        upP.sell = false
                        p.buy = false
                        continue
                    }
                }
                if (!p.buy && !p.sell) {
                    exchange.Buy(-1, amount * ticker.Last, ticker)
                    p.buy = true
                }
            }
        }

        showTbl(net)
        preTicker = ticker
        Sleep(500)
    }
}
전략 백테스팅:
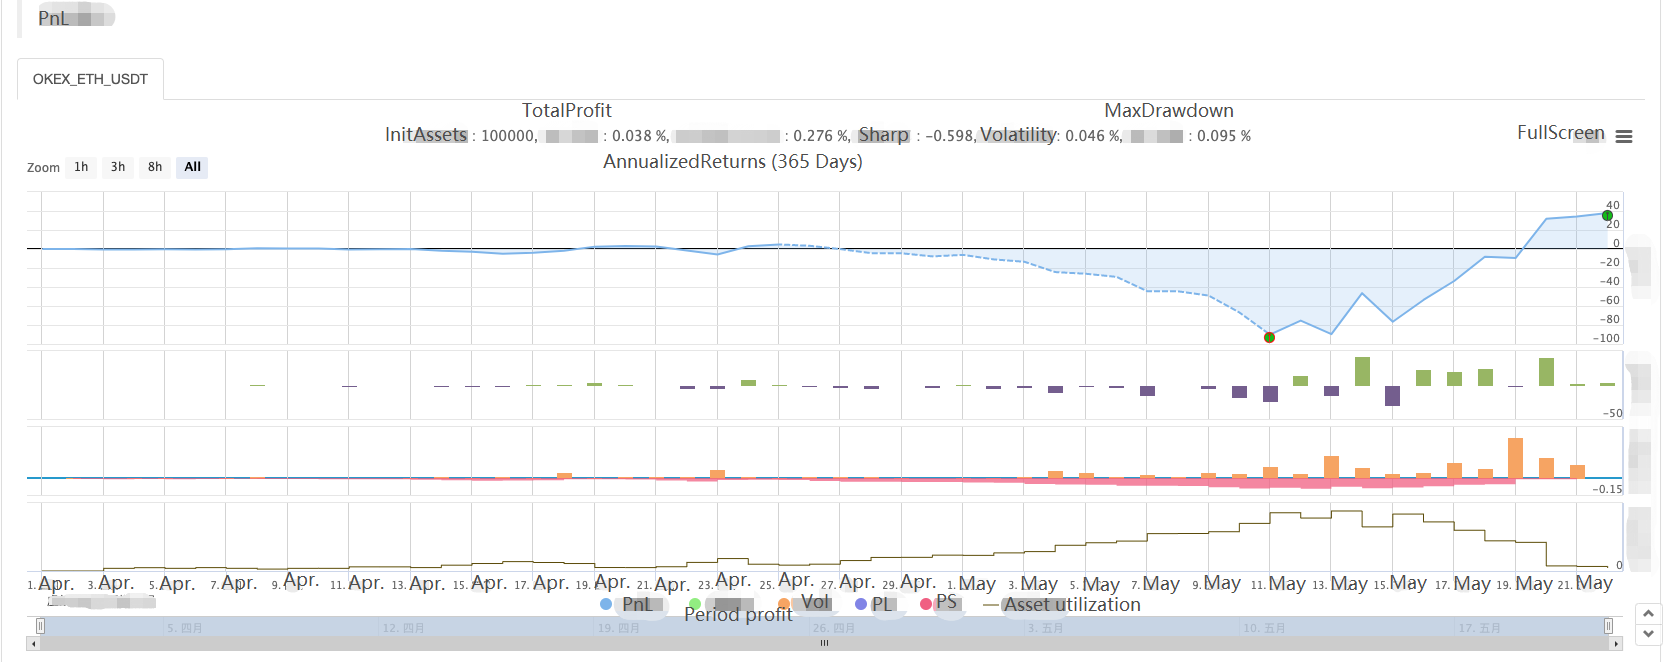
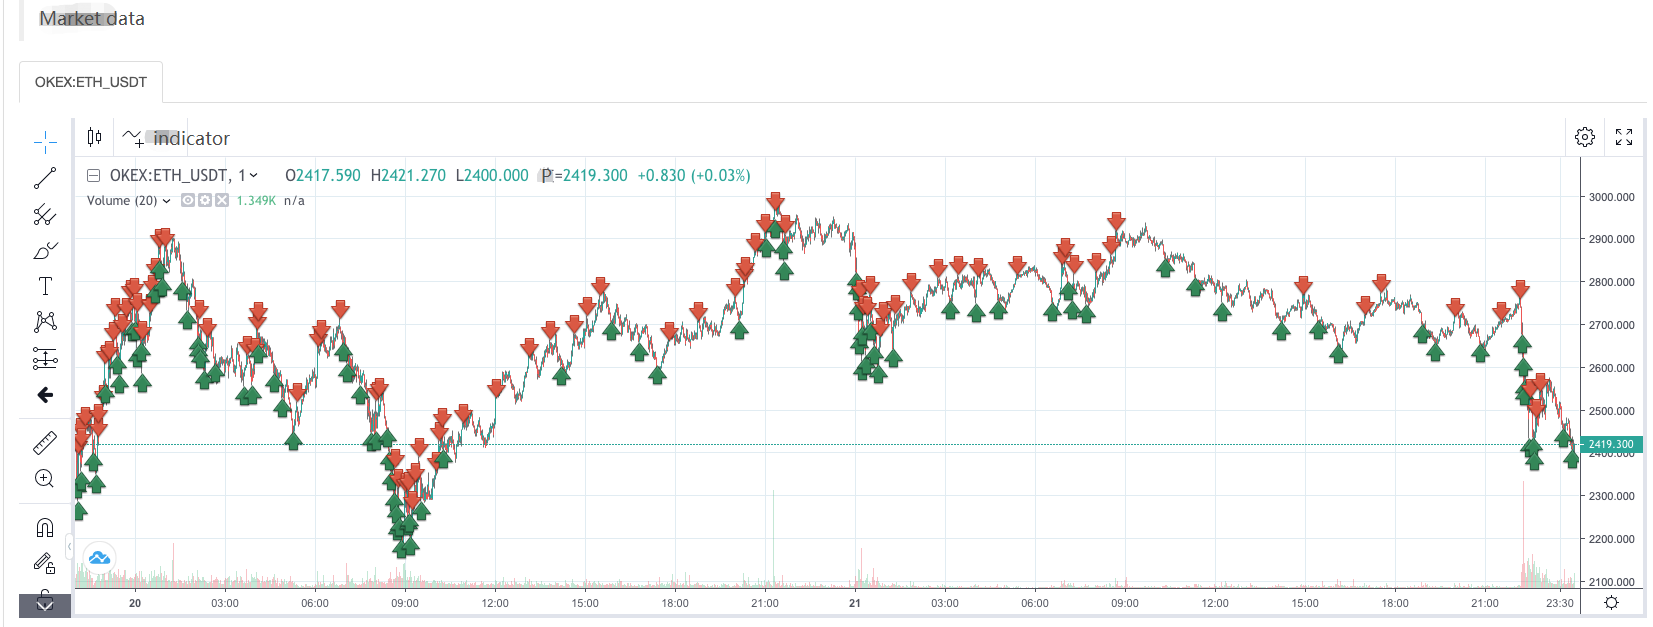
그리드 전략의 특징을 볼 수 있습니다. 시장이 트렌딩할 때 큰 부동 손실이 발생하고 수익은 변동적인 시장에서 회복됩니다.
따라서 네트워크 전략은 위험하지 않습니다. 스포트 전략은 여전히
- 암호화폐 시장의 근본 분석을 정량화: 데이터를 스스로 이야기하도록!
- 동전圈의 기초적인 양적 연구 - 더 이상 모든
선생님들을 믿지 말고, 데이터를 객관적으로 이야기하십시오! - 양적 거래의 필수 도구 - 발명자 양적 데이터 탐색 모듈
- 모든 것을 마스터 - FMZ에 대한 소개 트레이딩 터미널의 새로운 버전 (TRB 중재 소스 코드)
- FMZ의 새로운 거래 단말기 소개 (TRB 리비트 소스 추가)
- FMZ 퀀트: 암호화폐 시장에서 공통 요구 사항 설계 예제 분석 (II)
- 80 줄의 코드에서 고주파 전략으로 뇌 없는 판매봇을 이용하는 방법
- FMZ 정량화: 암호화폐 시장의 일반적인 요구 디자인 사례 분석 (II)
- 80줄의 코드의 고주파 전략으로 뇌 없는 로봇을 파는 방법
- FMZ Quant: 암호화폐 시장에서 공통 요구 사항 디자인 예의 분석 (I)
- FMZ 정량화: 암호화폐 시장의 일반적인 요구 디자인 사례 분석 (1)