재화 선물 거래량 발자국 차트 분석 및 실현
저자:선함, 2020-07-03 11:06:48, 업데이트: 2023-10-28 15:30:11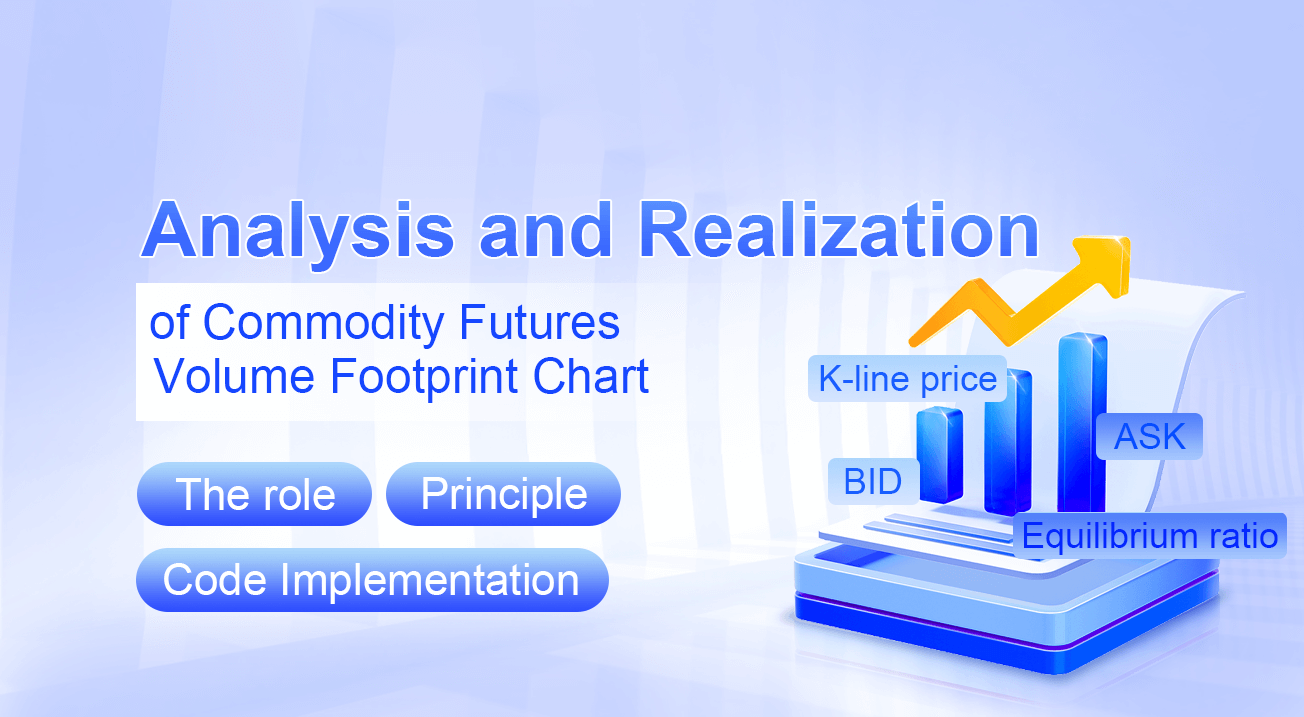
요약
양자 발자국 차트 (Quantum footprint chart) 는 고급 차트 분석 도구로, 영어 이름은
양자 발자국이란 무엇인가요?
간단히 말해서, 양자 발자국은 다양한 가격 수준에서 구매자와 판매자에게 무슨 일이 일어나는지 마이크로 분석함으로써 시장의 투명성을 제공합니다.
- K 라인 가격
- 액티브 구매 부피 (ASK)
- 활성 판매량 (BID)
- 균형 비율
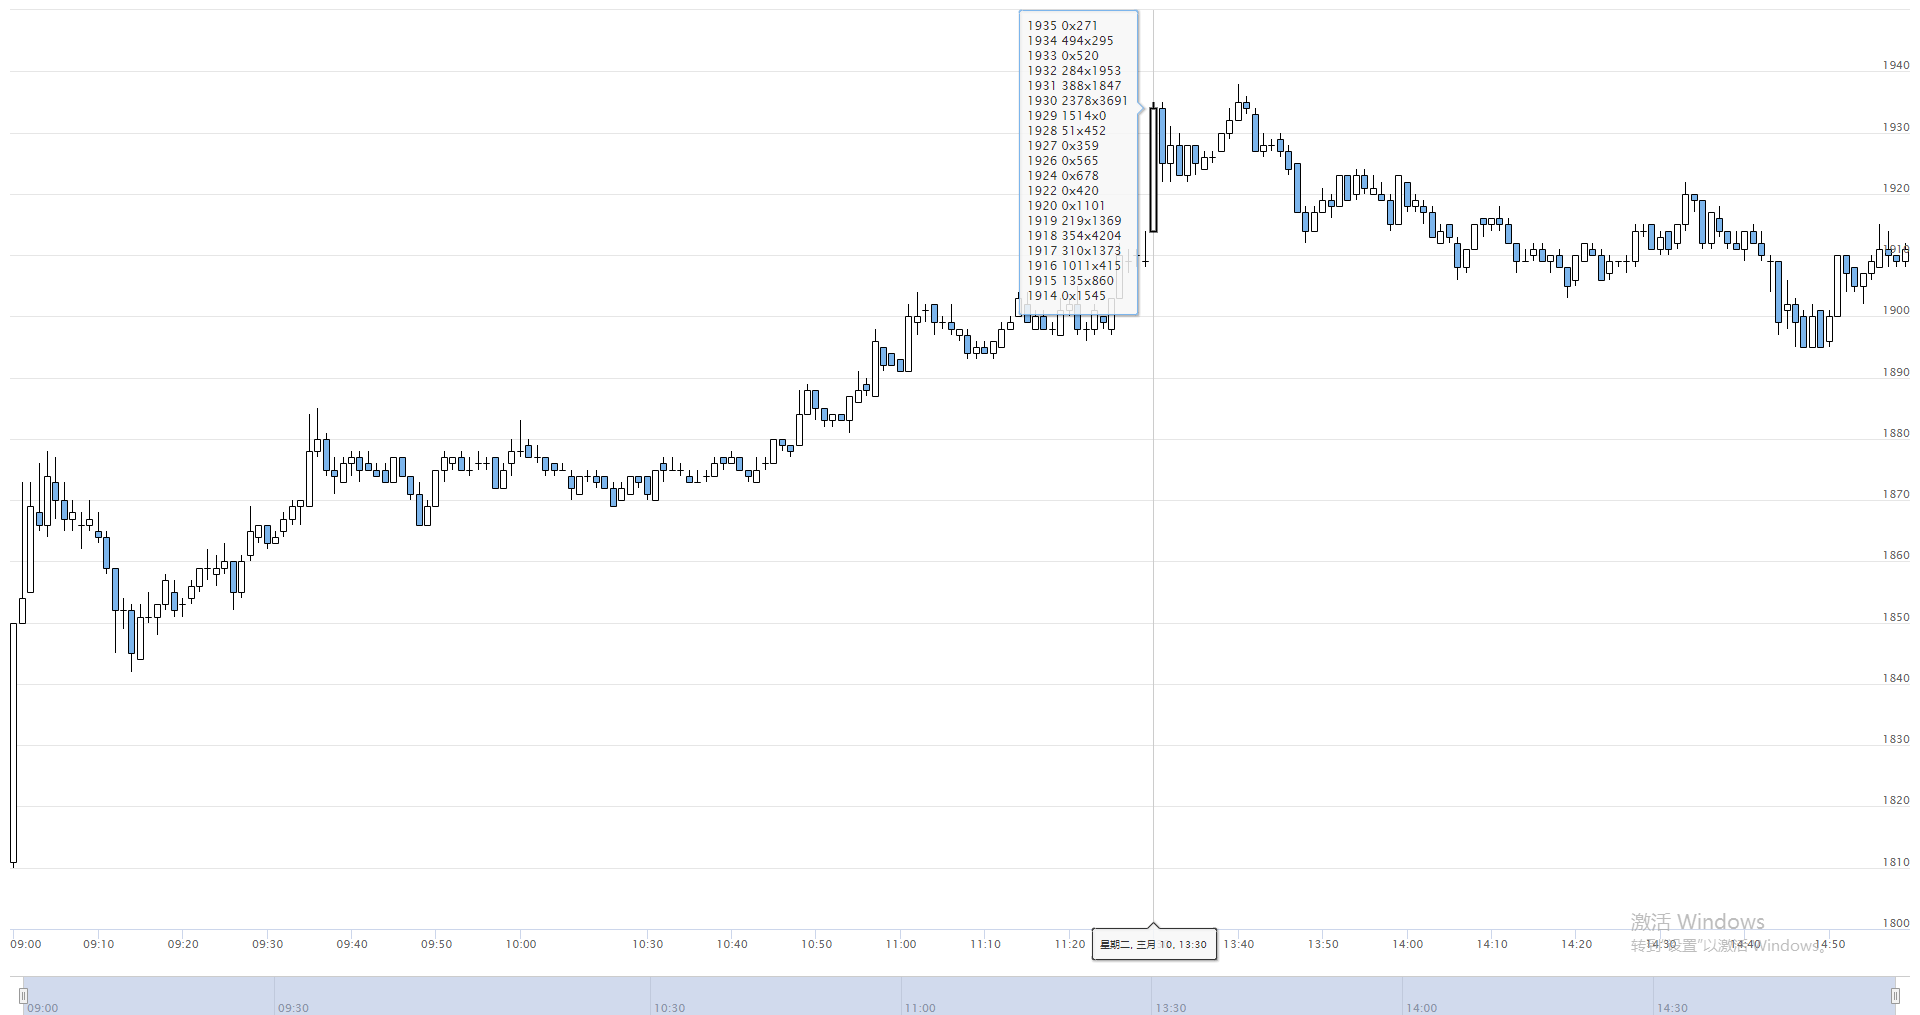
위의 그림에서 보듯이 이것은 거래 플랫폼에서 구현된 양적 에너지 발자국 차트의 시범 버전입니다.FMZ.COM이 금액은 실제tick시장. 자세한 데이터는 K 라인에 첨부됩니다. 마우스를 누르면 K 라인 위에 양적 에너지 발자국 데이터가 표시 될 수 있습니다. 파란색 사각형의 데이터는 계산 결과이며, 총 두 열로 나뉘며 왼쪽 열은 현재 K 라인의 모든 가격 포인트이며, 큰 것부터 작은 것으로 배열됩니다. 오른쪽 열은 각 가격 수준에 대한 거래량이며, 구매 거래량과 판매 거래량으로 분할되며,
양자 에너지 발자국 역할
가격 상승의 원인을 생각해보십시오. 대답은 간단합니다. 구매자와 판매자. 판매자보다 구매자가 더 많으면 가격이 상승합니다. 구매자보다 판매자가 더 많으면 가격이 떨어집니다. 현재 판매자 수가 구매 가격의 수와 대략 같다면 시장은 변동성 추세를 보일 것입니다. 즉, 시장은 균형 상태입니다. 큰 구매자 또는 판매자가 나타나면이 균형은 깨질 것이고 에너지 발자국 지도는 적극적인 구매와 판매의 극단적인 비율을 보여줄 것입니다.
에너지 발자국은 Tick 데이터에 기반하여 동적으로 표시되므로 특히 단기 내일 거래에 적합합니다. 거래자는 가격 변동의 이유 또는 법칙을 설명하고 자신의 거래 전략을 사용자 정의하기 위해 각 가격의 활성 거래량을 정확하게 볼 수 있습니다. 예를 들어: 왼쪽의 구매 부피가 오른쪽의 판매 부피보다 훨씬 크다면 시장 참여자가 적극적으로 구매하고 있으며 가격이 미래에 증가 할 수 있음을 의미합니다. 그렇지 않으면 오른쪽의 판매 부피가 왼쪽의 구매 부피보다 훨씬 크다면 시장 참여자가 적극적으로 판매하면 ભાવ이 미래에 떨어질 수 있음을 의미합니다.
양자 에너지 발자국 원리
양자 에너지 발자국 계산 원리는 양량 및 시장 데이터에서 나온다. 현재 양은 시장의 가격 변화에 따라 실시간으로 계산된다. 시장 가격이 상승하면 양은 적극적인 구매로 기록된다. 시장 가격이 떨어지면 양은 적극적으로 판매로 기록된다. FMZ 에너지 발자국 그래프에서,Tick데이터를 실시간으로 계산하여 매출을 정확하게 계산합니다.Tick.
양자 에너지 발자국 코드 구현
/*backtest
start: 2020-03-10 00:00:00
end: 2020-03-10 23:59:00
period: 1h
exchanges: [{"eid":"Futures_CTP","currency":"FUTURES"}]
mode: 1
*/

var NewFuturesTradeFilter = function (period) {
    var self = {} // Create an object
    self.c = Chart({ // Create "Chart" chart
        tooltip: {
            xDateFormat:'%Y-%m-%d %H:%M:%S, %A',
            pointFormat:'{point.tips}'
        },
        series: [{
            name: exchange.GetName(),
            type:'candlestick',
            data: []
        }]
    })
    self.c.reset() // clear chart data
    self.pre = null // used to record the last data
    self.records = []
    self.feed = function (ticker) {
        if (!self.pre) {// If the previous data is not true
            self.pre = ticker // Assign the latest data
        }
        var action ='' // Mark as empty string
        Log('ticker', ticker)
        Log('pre', self.pre)
        if (ticker.Last >= self.pre.Sell) {// If the last price of the latest data is greater than or equal to the selling price of the previous data
            action ='buy' // mark as buy
        } else if (ticker.Last <= self.pre.Buy) {// If the last price of the latest data is less than or equal to the bid price of the previous data
            action ='sell' // mark as sell
        } else {
            if (ticker.Last >= ticker.Sell) {// If the last price of the latest data is greater than or equal to the selling price of the latest data
                action ='buy' // mark as buy
            } else if (ticker.Last <= ticker.Buy) {// If the last price of the latest data is less than or equal to the buying price of the latest data
                action ='sell' // mark as "sell"
            } else {
                action ='both' // Mark as "both"
            }
        }
        // reset volume
        if (ticker.Volume <self.pre.Volume) {// If the volume of the latest data is less than the volume of the previous data
            self.pre.Volume = 0 // Assign the volume of the previous data to 0
        }
        var amount = ticker.Volume-self.pre.Volume // the volume of the latest data minus the volume of the previous data
        if (action !='' && amount> 0) {// If the tag is not an empty string and the action is greater than 0
            var epoch = parseInt(ticker.Time / period) * period // Calculate the K-line timestamp and round it
            var bar = null
            var pos = undefined
            if (
                self.records.length == 0 || // If the K-line length is 0 or the last K-line timestamp is less than "epoch"
                self.records[self.records.length-1].time <epoch
            ) {
                bar = {
                    time: epoch,
                    data: {},
                    open: ticker.Last,
                    high: ticker.Last,
                    low: ticker.Last,
                    close: ticker.Last
                } // Assign the latest data to bar
                self.records.push(bar) // Add bar to the records array
            } else {// reassign bar
                bar = self.records[self.records.length-1] // the last bar of the previous data
                bar.high = Math.max(bar.high, ticker.Last) // the maximum price of the last bar of the previous data and the maximum value of the last price of the latest data
                bar.low = Math.min(bar.low, ticker.Last) // The minimum price of the last bar of the previous data and the minimum value of the last price of the latest data
                bar.close = ticker.Last // last price of latest data
                pos = -1
            }
            if (typeof bar.data[ticker.Last] ==='undefined') {// If the data is empty
                bar.data[ticker.Last] = {// reassign value
                    buy: 0,
                    sell: 0
                }
            }
            if (action =='both') {// If the token is equal to both
                bar.data[ticker.Last]['buy'] += amount // buy accumulation
                bar.data[ticker.Last]['sell'] += amount // sell accumulated
            } else {
                bar.data[ticker.Last][action] += amount // mark accumulation
            }
            var tips =''
            Object.keys(bar.data) // Put the keys in the object into an array
                .sort() // sort
                .reverse() // Reverse the order in the array
                .forEach(function (p) {// traverse the array
                    tips +='<br>' + p + '' + bar.data[p].sell +'x' + bar.data[p].buy
                })
            self.c.add( // Add data
                0, {
                    x: bar.time,
                    open: bar.open,
                    high: bar.high,
                    low: bar.low,
                    close: bar.close,
                    tips: tips
                },
                pos
            )
        }
        self.pre = ticker // reassign
    }
    return self // return object
}


// program entry
function main() {
    Log(_C(exchange.SetContractType,'MA888')) // subscription data
    var filt = NewFuturesTradeFilter(60000) // Create an object
    while (true) {// Enter loop mode
        var ticker = exchange.GetTicker() // Get exchange tick data
        if (ticker) {// If the Tick data is successfully obtained
            filt.feed(ticker) // Start processing data
        }
    }
}
양자 발자국 코드 다운로드
양적 코드 발자국 차트 전략 코드는FMZ.com그리고 일반 사용자는 설정 없이 사용할 수 있습니다.https://www.fmz.com/strategy/189965
요약하면
실제 사용에서는 에너지 발자국 지도는 또한 용량의 관점에서 자금 흐름을 분석할 수 있다. 대규모 트렌드의 방향이나 하루의 단기 방향의 방향을 분석하기 위해서든 중요한 역할을 한다. 그러나, 여기서 소위 자본 흐름은 자금의 입출입을 가리키는 것이 아니라 시장의 구매 및 판매 의향과 주요 플레이어와 소매 투자자들의 게임 행동을 반영한다는 점에 유의해야 한다.
- 암호화폐 시장의 근본 분석을 정량화: 데이터를 스스로 이야기하도록!
- 동전圈의 기초적인 양적 연구 - 더 이상 모든
선생님들을 믿지 말고, 데이터를 객관적으로 이야기하십시오! - 양적 거래의 필수 도구 - 발명자 양적 데이터 탐색 모듈
- 모든 것을 마스터 - FMZ에 대한 소개 트레이딩 터미널의 새로운 버전 (TRB 중재 소스 코드)
- FMZ의 새로운 거래 단말기 소개 (TRB 리비트 소스 추가)
- FMZ 퀀트: 암호화폐 시장에서 공통 요구 사항 설계 예제 분석 (II)
- 80 줄의 코드에서 고주파 전략으로 뇌 없는 판매봇을 이용하는 방법
- FMZ 정량화: 암호화폐 시장의 일반적인 요구 디자인 사례 분석 (II)
- 80줄의 코드의 고주파 전략으로 뇌 없는 로봇을 파는 방법
- FMZ Quant: 암호화폐 시장에서 공통 요구 사항 디자인 예의 분석 (I)
- FMZ 정량화: 암호화폐 시장의 일반적인 요구 디자인 사례 분석 (1)