초보자용 암호화폐 양적 거래 - 암호화폐 양적 거래에 더 가까워질 수 있습니다 (7)
저자:리디아, 창작: 2022-08-09 11:15:23, 업데이트: 2023-09-21 21:00:10
이전 기사에서 우리는 간단한 다종 격자 전략을 함께 생각하고 설계했습니다. 다음으로 우리는 양적 거래의 길을 계속 배우고 앞으로 나아갈 것입니다. 이 기사에서 우리는 더 복잡한 전략 설계 - 헤지 전략의 설계를 탐구 할 것입니다. 이 기사에서는 다종 간 시간적 헤지 전략을 설계할 계획입니다. 시간 간 헤지 전략에 관해서는 미래에셋 거래에 익숙한 사람들은 익숙해야합니다. 초보자는이 개념을 이해하지 못할 수 있으므로 시간 간 헤지 개념에 대한 간략한 설명으로 시작해 보겠습니다.
시간 간 헤지
간단히 말해서, 시간 간 헤딩은 계약을 길게 하고, 계약을 짧게 하고, 세 가지 상황 (장과 단) 을 동시에 닫기 위해 기다리는 것입니다.
- 만약 당신이 롱으로 가서 돈을 벌고, 쇼트로 돈을 잃고, 수익이 손실보다 많을 때 포지션을 닫으면, 당신은 이익/손실 균형 이후 수익을 올릴 것입니다.
- 긴 포지션은 돈을 잃고, 짧은 포지션은 돈을 벌고, 상위와 같은 포지션이 손실보다 수익성이 높을 때 포지션을 닫습니다.
- 길게 가면 돈을 벌고, 짧게 가면 돈을 벌고, 왜 망설이는 거야?
다른 경우에는 부동 손실이 위치에서 확장하거나 계속됩니다. (스프레드 변동이 일방 변동보다 온화하기 때문에 상대적 위험은 작습니다.
Let A1 be the price of contract A at moment 1, and set B1 to be the price of contract B at moment 1. At this time, short contract A, short price A1, long contract B, and long price B1.
Let A2 be the price of contract A at moment 2, and set B2 to be the price of contract B at moment 2. At this time, close the position contract A (short), close short A2, close the position B contract (long), and close long price B2.

Moment 1 difference:A1 - B1 = X
Moment 2 difference:A2 - B2 = Y
X - Y = A1 - B1 - (A2 - B2)
X - Y = A1 - B1 - A2 + B2
X - Y = A1 - A2 + B2 - B1

It can be seen that A1 - A2 is the profit difference in closing the position of contract A.
B2 - B1 is the profit spread of closing the position of contract B. As long as the two closed positions are overall positive, ie: A1 - A2 + B2 - B1 > 0 is profitable. That is, as long as X - Y > 0.
Because of: X - Y = A1 - A2 + B2 - B1

It is concluded that as long as the difference X of opening a position is greater than the difference Y of closing a position, it is profitable (note that it is short A, long B to open a position, the reverse will be the opposite), of course, this is theoretical, practical factors such as commission and slippage should also be considered.
왜냐하면 암호화폐 거래소는 배달 계약과 영구 계약이 모두 있기 때문입니다. 그리고 영구 계약의 가격은 투자율로 인해 항상 현금 가격에 가깝습니다. 그러면 우리는 헤지 중재에 배달 계약과 영구 계약을 사용하도록 선택합니다. 배달 계약은 장기 계약을 선택하므로 헤지 계약은 자주 설정 할 필요가 없습니다.
먼저 여러 종에 걸쳐서 퍼진 통계 자료를 준비해 보세요.
기본 원리를 알고 나면 전략 작성에 서두르지 않아도 됩니다. 첫째, 퍼진 통계를 얻고, 차트를 그리고 퍼진을 관찰할 수 있습니다.
우리는OKEX 계약. FMZ에 그리는 것은 매우 간단합니다. 그리는 패키지 함수를 사용하는 것은 매우 쉽습니다. 차트 라이브러리는하이라이트 차트API 문헌에 있는 그림 기능 설명:https://www.fmz.com/api#chart...
그것은 다종이기 때문에, 무엇보다도, 그 종의 가격 차이를 결정하는 것이 필요합니다. 도출하기 전에. 코드에, 먼저 두 개의 배열을 작성하십시오.
var arrSwapContractType = ["BTC-USDT-SWAP", "LTC-USDT-SWAP", "ETH-USDT-SWAP", "ETC-USDT-SWAP"]   // Perpetual contracts
var arrDeliveryContractType = ["BTC-USDT-210924", "LTC-USDT-210924", "ETH-USDT-210924", "ETC-USDT-210924"]  // Delivery contracts
여기에 설정된 계약 코드에 따라 차트 구성 초기화. 이 차트 구성은 확실히 하드 코딩 될 수 없습니다, 당신은 어떤 종과 얼마나 많은 종을해야하는지 모르기 때문에 (이들은 arrDeliveryContractType와 arrSwapContractType의 값에 의해 결정됩니다), 그래서 차트 구성은 함수로 반환됩니다.
function createCfg(symbol) {
    var cfg = {
        extension: {
            // No grouping, displayed separately, default is 'group'
            layout: 'single',
            // Specify the height, which can be set as a string, "300px", and the value 300 will be replaced with "300px" automatically
            height: 300,
            // The unit value of the specified width, the total value is 12
            col: 6
        },
        title: {
            text: symbol
        },
        xAxis: {
            type: 'datetime'
        },
        series: [{
            name: 'plus',
            data: []
        }]
    }

    return cfg
}

function main() {
    // Declare arrCfg
    var arrCfg = []                                    // Declare an array to store chart configuration information
    _.each(arrSwapContractType, function(ct) {         // Record the array of perpetual contract codes iteratively, pass the XXX-USDT part of the contract name as a parameter to the createCfg function, construct the chart configuration information, and return
        arrCfg.push(createCfg(formatSymbol(ct)[0]))    // The chart configuration information returned by createCfg is pushed into the arrCfg array
    })
    var objCharts = Chart(arrCfg)                      // Call the chart function Chart of the FMZ platform to create the chart control object objCharts
    objCharts.reset()                                  // Initialize chart content

    // Hereafter omitted ...
}
다음으로 데이터를 준비합니다. 우리는 OKEX 계약의 집계 시장 인터페이스를 사용합니다.
USDT 상시계약:
https://www.okex.com/api/v5/market/tickers?instType=SWAP
USDT 배송 계약:
https://www.okex.com/api/v5/market/tickers?instType=FUTURES
우리는 이 두 인터페이스의 호출을 처리하기 위해 함수를 작성하고 데이터를 포맷으로 넣습니다:
function getTickers(url) {
    var ret = []
    try {
        var arr = JSON.parse(HttpQuery(url)).data
        _.each(arr, function(ele) {
            ret.push({
                bid1: parseFloat(ele.bidPx),             // Price of stock buy order
                bid1Vol: parseFloat(ele.bidSz),          // Amount for the price of stock buy order
                ask1: parseFloat(ele.askPx),             // Price of stock sell order
                ask1Vol: parseFloat(ele.askSz),          // Amount for the price of stock sell order
                symbol: formatSymbol(ele.instId)[0],     // Formats into trading pairs
                type: "Futures",                         // Type
                originalSymbol: ele.instId               // Original contract code
            })
        })
    } catch (e) {
        return null
    }
    return ret
}
계약 코드를 처리하는 다른 함수를 작성
function formatSymbol(originalSymbol) {
    var arr = originalSymbol.split("-")
    return [arr[0] + "_" + arr[1], arr[0], arr[1]]
}
이제 남은 것은 수집된 데이터를 반복적으로 결합하고 스프레드를 계산하고 출력을 그래프화하는 것입니다. 여기서 테스트는 2분기 계약 210924과 영구 계약 사이의 스프레드입니다. 전체 코드:
// Temporary parameters
var arrSwapContractType = ["BTC-USDT-SWAP", "LTC-USDT-SWAP", "ETH-USDT-SWAP", "ETC-USDT-SWAP"]
var arrDeliveryContractType = ["BTC-USDT-210924", "LTC-USDT-210924", "ETH-USDT-210924", "ETC-USDT-210924"]
var interval = 2000

function createCfg(symbol) {
    var cfg = {
        extension: {
            // No grouping, displayed separately, default is 'group'
            layout: 'single',
            // Specify the height, which can be set as a string, "300px", and the value 300 will be replaced with "300px" automatically
            height: 300,
            // The unit value of the specified width, the total value is 12
            col: 6
        },
        title: {
            text: symbol
        },
        xAxis: {
            type: 'datetime'
        },
        series: [{
            name: 'plus',
            data: []
        }]
    }

    return cfg
}

function formatSymbol(originalSymbol) {
    var arr = originalSymbol.split("-")
    return [arr[0] + "_" + arr[1], arr[0], arr[1]]
}

function getTickers(url) {
    var ret = []
    try {
        var arr = JSON.parse(HttpQuery(url)).data
        _.each(arr, function(ele) {
            ret.push({
                bid1: parseFloat(ele.bidPx),
                bid1Vol: parseFloat(ele.bidSz),
                ask1: parseFloat(ele.askPx),
                ask1Vol: parseFloat(ele.askSz),
                symbol: formatSymbol(ele.instId)[0],
                type: "Futures",
                originalSymbol: ele.instId
            })
        })
    } catch (e) {
        return null
    }
    return ret
}

function main() {
    // Declare arrCfg
    var arrCfg = []
    _.each(arrSwapContractType, function(ct) {
        arrCfg.push(createCfg(formatSymbol(ct)[0]))
    })
    var objCharts = Chart(arrCfg)
    objCharts.reset()

    while (true) {
        // Obtain market data
        var deliveryTickers = getTickers("https://www.okex.com/api/v5/market/tickers?instType=FUTURES")
        var swapTickers = getTickers("https://www.okex.com/api/v5/market/tickers?instType=SWAP")
        if (!deliveryTickers || !swapTickers) {
            Sleep(2000)
            continue
        }

        var tbl = {
            type : "table",
            title : "delivery - perpetual spread",
            cols : ["trading pairs", "delivery", "perpetual", "positive hedging", "negative hedging"],
            rows : []
        }

        var subscribeDeliveryTickers = []
        var subscribeSwapTickers = []
        _.each(deliveryTickers, function(deliveryTicker) {
            _.each(arrDeliveryContractType, function(symbol) {
                if (deliveryTicker.originalSymbol == symbol) {
                    subscribeDeliveryTickers.push(deliveryTicker)
                }
            })
        })
        _.each(swapTickers, function(swapTicker) {
            _.each(arrSwapContractType, function(symbol) {
                if (swapTicker.originalSymbol == symbol) {
                    subscribeSwapTickers.push(swapTicker)
                }
            })
        })

        var pairs = []
        var ts = new Date().getTime()
        _.each(subscribeDeliveryTickers, function(deliveryTicker) {
            _.each(subscribeSwapTickers, function(swapTicker) {
                if (deliveryTicker.symbol == swapTicker.symbol) {
                    var pair = {symbol: swapTicker.symbol, swapTicker: swapTicker, deliveryTicker: deliveryTicker, plusDiff: deliveryTicker.bid1 - swapTicker.ask1, minusDiff: deliveryTicker.ask1 - swapTicker.bid1}
                    pairs.push(pair)
                    tbl.rows.push([pair.symbol, deliveryTicker.originalSymbol, swapTicker.originalSymbol, pair.plusDiff, pair.minusDiff])
                    for (var i = 0 ; i < arrCfg.length ; i++) {
                        if (arrCfg[i].title.text == pair.symbol) {
                            objCharts.add([i, [ts, pair.plusDiff]])
                        }
                    }
                }
            })
        })

        LogStatus(_D(), "\n`" + JSON.stringify(tbl) + "`")
        Sleep(interval)
    }
}
진짜 로봇이 달리고 있어
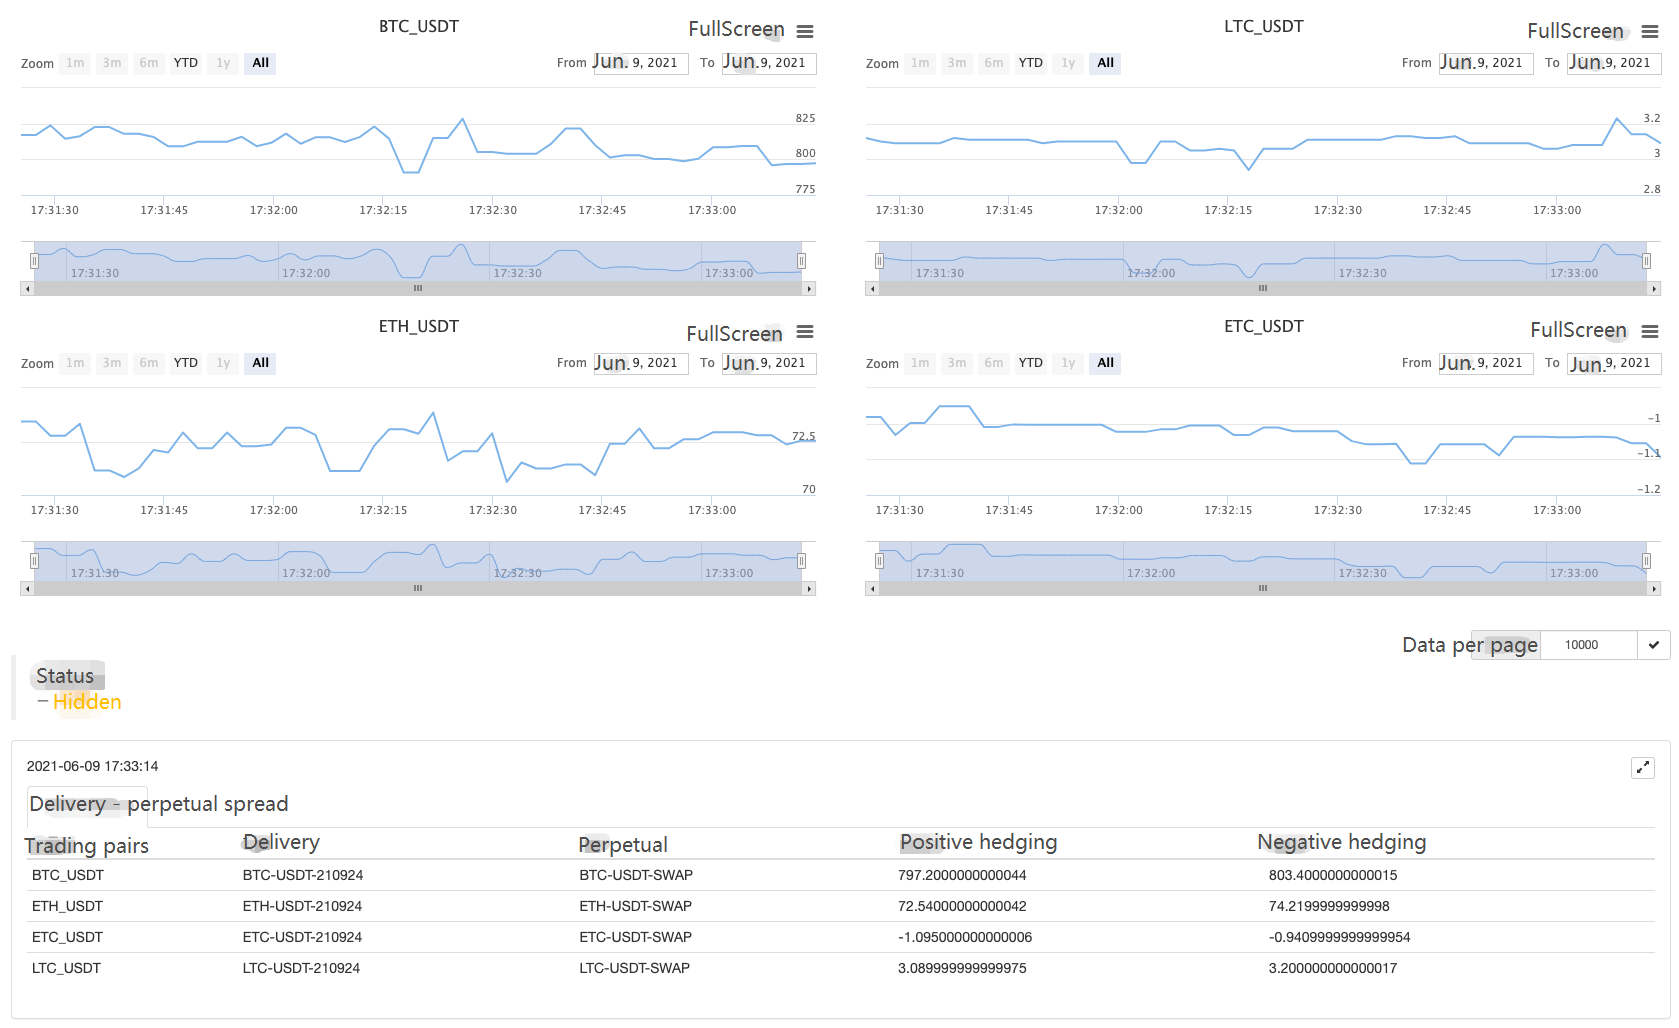
잠시 도망쳐~
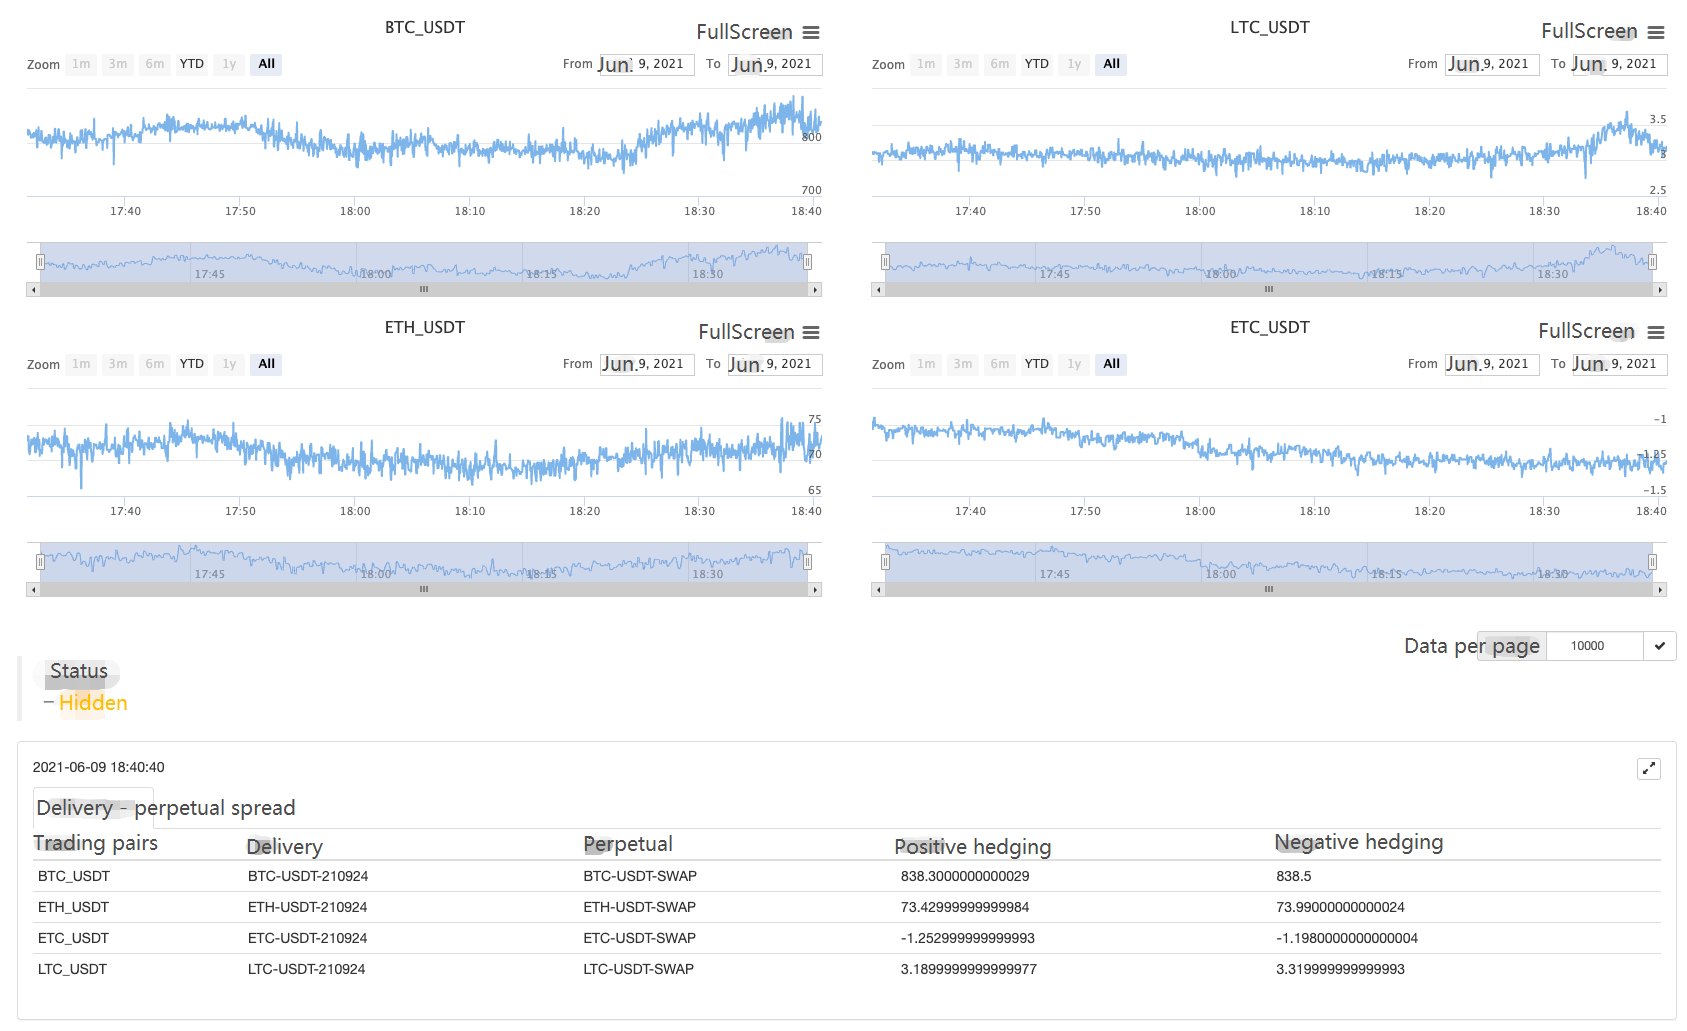
확산 현상을 관찰하고 그 다음에 얘기하세요!
- 암호화폐 시장의 근본 분석을 정량화: 데이터를 스스로 이야기하도록!
- 동전圈의 기초적인 양적 연구 - 더 이상 모든
선생님들을 믿지 말고, 데이터를 객관적으로 이야기하십시오! - 양적 거래의 필수 도구 - 발명자 양적 데이터 탐색 모듈
- 모든 것을 마스터 - FMZ에 대한 소개 트레이딩 터미널의 새로운 버전 (TRB 중재 소스 코드)
- FMZ의 새로운 거래 단말기 소개 (TRB 리비트 소스 추가)
- FMZ 퀀트: 암호화폐 시장에서 공통 요구 사항 설계 예제 분석 (II)
- 80 줄의 코드에서 고주파 전략으로 뇌 없는 판매봇을 이용하는 방법
- FMZ 정량화: 암호화폐 시장의 일반적인 요구 디자인 사례 분석 (II)
- 80줄의 코드의 고주파 전략으로 뇌 없는 로봇을 파는 방법
- FMZ Quant: 암호화폐 시장에서 공통 요구 사항 디자인 예의 분석 (I)
- FMZ 정량화: 암호화폐 시장의 일반적인 요구 디자인 사례 분석 (1)