유튜브 베테랑들의 "마법적인 이중 EMA 전략"
저자:리디아, 창작: 2022-11-07 12:02:31, 업데이트: 2023-09-15 20:51:23
유튜브 베테랑의 마법의 이중 EMA 전략
이 쟁점에서는 유튜브의
전략에서 사용하는 지표
- EMA 지표
디자인의 단순성을 위해, 우리는 비디오에 나열된 이동 평균 지수치를 사용하지 않을 것입니다. 대신 거래 뷰의 내장 된 ta.ema를 사용할 것입니다. (실제로 동일합니다.)
- VuManChu 스윙 프리 표시기
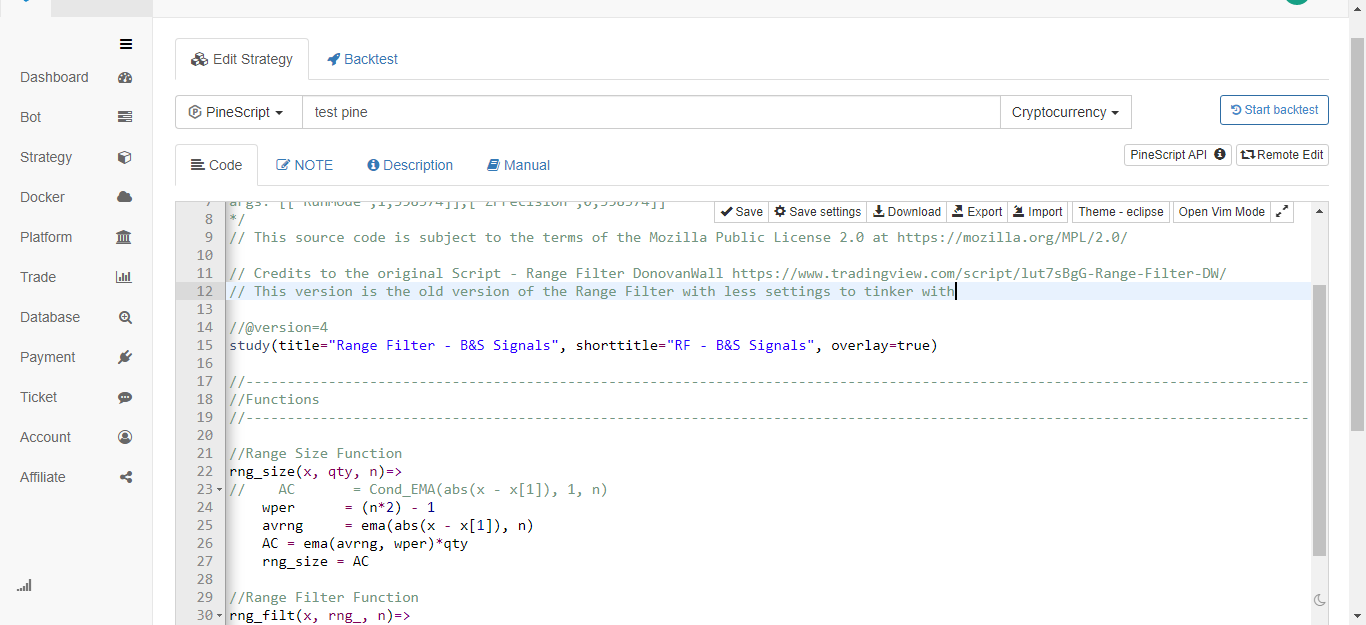
이것은 트레이딩 뷰의 지표입니다. 트레이딩 뷰로 가서 소스 코드를 가져가야 합니다.
VuManChu Swing Free의 코드:
// This source code is subject to the terms of the Mozilla Public License 2.0 at https://mozilla.org/MPL/2.0/

// Credits to the original Script - Range Filter DonovanWall https://www.tradingview.com/script/lut7sBgG-Range-Filter-DW/
// This version is the old version of the Range Filter with less settings to tinker with

//@version=4
study(title="Range Filter - B&S Signals", shorttitle="RF - B&S Signals", overlay=true)

//-----------------------------------------------------------------------------------------------------------------------------------------------------------------
//Functions
//-----------------------------------------------------------------------------------------------------------------------------------------------------------------

//Range Size Function
rng_size(x, qty, n)=>
//    AC       = Cond_EMA(abs(x - x[1]), 1, n)
    wper      = (n*2) - 1
    avrng     = ema(abs(x - x[1]), n)
    AC = ema(avrng, wper)*qty
    rng_size = AC

//Range Filter Function
rng_filt(x, rng_, n)=>
    r          = rng_
    var rfilt  = array.new_float(2, x)
    array.set(rfilt, 1, array.get(rfilt, 0))
    if x - r > array.get(rfilt, 1)
        array.set(rfilt, 0, x - r)
    if x + r < array.get(rfilt, 1)
        array.set(rfilt, 0, x + r)
    rng_filt1 = array.get(rfilt, 0)

    hi_band   = rng_filt1 + r
    lo_band   = rng_filt1 - r
    rng_filt  = rng_filt1
    [hi_band, lo_band, rng_filt]

//-----------------------------------------------------------------------------------------------------------------------------------------------------------------
//Inputs
//-----------------------------------------------------------------------------------------------------------------------------------------------------------------

//Range Source
rng_src = input(defval=close, type=input.source, title="Swing Source")

//Range Period
rng_per = input(defval=20, minval=1, title="Swing Period")

//Range Size Inputs
rng_qty   = input(defval=3.5, minval=0.0000001, title="Swing Multiplier")

//Bar Colors
use_barcolor = input(defval=false, type=input.bool, title="Bar Colors On/Off")

//-----------------------------------------------------------------------------------------------------------------------------------------------------------------
//Definitions
//-----------------------------------------------------------------------------------------------------------------------------------------------------------------

//Range Filter Values
[h_band, l_band, filt] = rng_filt(rng_src, rng_size(rng_src, rng_qty, rng_per), rng_per)

//Direction Conditions
var fdir = 0.0
fdir    := filt > filt[1] ? 1 : filt < filt[1] ? -1 : fdir
upward   = fdir==1 ? 1 : 0
downward = fdir==-1 ? 1 : 0

//Trading Condition
longCond = rng_src > filt and rng_src > rng_src[1] and upward > 0 or rng_src > filt and rng_src < rng_src[1] and upward > 0
shortCond = rng_src < filt and rng_src < rng_src[1] and downward > 0 or rng_src < filt and rng_src > rng_src[1] and downward > 0

CondIni = 0
CondIni := longCond ? 1 : shortCond ? -1 : CondIni[1]
longCondition = longCond and CondIni[1] == -1
shortCondition = shortCond and CondIni[1] == 1

//Colors
filt_color = upward ? #05ff9b : downward ? #ff0583 : #cccccc
bar_color  = upward and (rng_src > filt) ? (rng_src > rng_src[1] ? #05ff9b : #00b36b) :
             downward and (rng_src < filt) ? (rng_src < rng_src[1] ? #ff0583 : #b8005d) : #cccccc

//-----------------------------------------------------------------------------------------------------------------------------------------------------------------
//Outputs
//-----------------------------------------------------------------------------------------------------------------------------------------------------------------

//Filter Plot
filt_plot = plot(filt, color=filt_color, transp=67, linewidth=3, title="Filter")

//Band Plots
h_band_plot = plot(h_band, color=color.new(#05ff9b, 100), title="High Band")
l_band_plot = plot(l_band, color=color.new(#ff0583, 100), title="Low Band")

//Band Fills
fill(h_band_plot, filt_plot, color=color.new(#00b36b, 92), title="High Band Fill")
fill(l_band_plot, filt_plot, color=color.new(#b8005d, 92), title="Low Band Fill")

//Bar Color
barcolor(use_barcolor ? bar_color : na)

//Plot Buy and Sell Labels
plotshape(longCondition, title = "Buy Signal", text ="BUY", textcolor = color.white, style=shape.labelup, size = size.normal, location=location.belowbar, color = color.new(color.green, 0))
plotshape(shortCondition, title = "Sell Signal", text ="SELL", textcolor = color.white, style=shape.labeldown, size = size.normal, location=location.abovebar, color = color.new(color.red, 0))

//Alerts
alertcondition(longCondition, title="Buy Alert", message = "BUY")
alertcondition(shortCondition, title="Sell Alert", message = "SELL")
전략 논리
EMA 지표: 전략은 두 개의 EMA를 사용합니다. 하나는 빠른 라인 (작은 기간 매개 변수) 이며 다른 하나는 느린 라인 (큰 기간 매개 변수) 입니다. 이중 EMA 이동 평균의 목적은 주로 시장 트렌드의 방향을 결정하는 데 도움이됩니다.
-
긴 포지션 계약 빠른 선은 느린 선 위에 있습니다.
-
단기 포지션 계약 빠른 선은 느린 선 아래에 있습니다.
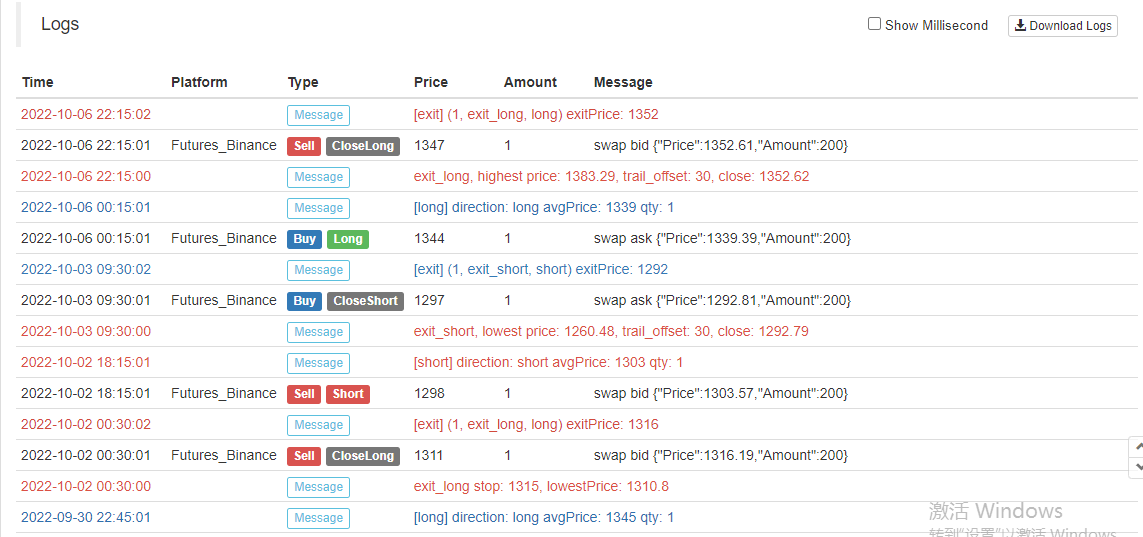
VuManChu Swing Free 인디케이터: VuManChu Swing Free 인디케이터는 신호를 보내고 다른 조건과 결합하여 주문을 할 것인지 판단하는 데 사용됩니다. VuManChu Swing Free 인디케이터 소스 코드에서 longCondition 변수가 구매 신호를 나타내고 shortCondition 변수가 판매 신호를 나타낸다는 것을 알 수 있습니다. 이 두 변수는 주문 조건의 후속 작성에 사용됩니다.
이제 트레이딩 신호의 특정 트리거 조건에 대해 이야기 해 봅시다.
-
롱 포지션에 들어가는 규칙: 긍정적인 K-라인의 폐쇄 가격은 EMA의 빠른 라인의 위에 있어야 하며, 두 EMA는 긴 포지션 (슬로우 라인의 위의 빠른 라인) 이어야 하며, VuManChu Swing Free 지표는 구매 신호를 표시해야 합니다 (longCondition true). 세 가지 조건이 충족되면 이 K-라인은 긴 포지션의 진입을 위한 핵심 K-라인이며, 이 K-라인의 폐쇄 가격은 진입 포지션입니다.
-
짧은 포지션에 들어가는 규칙 (장한 포지션과 달리): 마이너스 K 라인의 폐쇄 가격은 EMA의 빠른 라인의 아래에 있어야 하며, 두 EMA는 짧은 위치 (슬로우 라인의 빠른 라인) 이어야 하며, VuManChu Swing Free 지표는 판매 신호를 표시해야 합니다 (shortCondition is true). 세 가지 조건이 충족되면 K 라인의 폐쇄 가격은 짧은 입점 위치입니다.
거래 논리는 매우 간단합니까? 원본 비디오는 수익 중지 및 손실 중지를 지정하지 않기 때문에, 나는 중간 수익 중지 및 손실 중지 방법을 자유롭게 사용할 것입니다.
코드 설계
VuManChu Swing Free 지표의 코드는, 우리는 어떤 변화도 없이 우리의 전략 코드에 직접 넣었습니다.
그 직후, 우리는 파인 언어 코드 조각을 작성하여 거래 기능을 구현합니다.
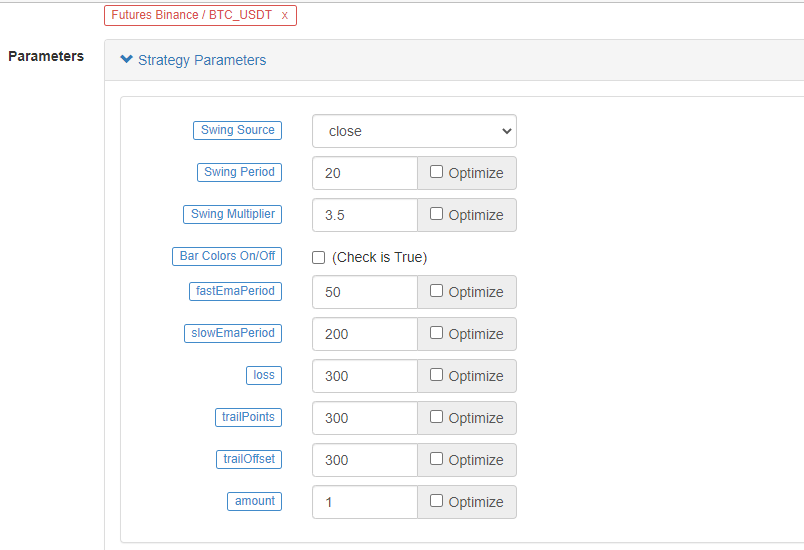
// extend
fastEmaPeriod = input(50, "fastEmaPeriod")         // fast line period
slowEmaPeriod = input(200, "slowEmaPeriod")        // slow line period
loss = input(30, "loss")                           // stop loss points
trailPoints = input(30, "trailPoints")             // number of trigger points for moving stop loss
trailOffset = input(30, "trailOffset")             // moving stop profit offset (points)
amount = input(1, "amount")                        // order amount

emaFast = ta.ema(close, fastEmaPeriod)             // calculate the fast line EMA
emaSlow = ta.ema(close, slowEmaPeriod)             // calculate the slow line EMA

buyCondition = longCondition and emaFast > emaSlow and close > open and close > emaFast         // entry conditions for long positions
sellCondition = shortCondition and emaFast < emaSlow and close < open and close < emaFast       // entry conditions for short positions

if buyCondition and strategy.position_size == 0
    strategy.entry("long", strategy.long, amount)
    strategy.exit("exit_long", "long", amount, loss=loss, trail_points=trailPoints, trail_offset=trailOffset)
if sellCondition and strategy.position_size == 0
    strategy.entry("short", strategy.short, amount)
    strategy.exit("exit_short", "short", amount, loss=loss, trail_points=trailPoints, trail_offset=trailOffset)
A.ItbuyCondition가 true일 때, 즉:
- 변수 longCondition true (VuManChu Swing Free 지표는 긴 위치 신호를 전송합니다.)
- emaFast > emaSlow (EMA 긴 위치 정렬)
- close > open (현행 BAR가 긍정적이라는 것을 의미합니다), close > emaFast (폐기 가격이 EMA 빠른 라인보다 높다는 것을 의미합니다).
3가지 조건은 장기간 유지해야 합니다.
B.sellCondition가 사실이라면, short 포지션을 만드는 세 가지 조건이 유효합니다 (여기에 반복되지 않습니다).
그 다음 우리는 if 조건 판단 신호 트리거의 경우 입점 및 포지션을 열기 위해 전략.입기 기능을 사용 하 여strategy.exit손실을 멈추고 동시에 수익을 추적하는 기능입니다.
전체 코드
/*backtest
start: 2022-01-01 00:00:00
end: 2022-10-08 00:00:00
period: 15m
basePeriod: 5m
exchanges: [{"eid":"Futures_Binance","currency":"ETH_USDT"}]
args: [["ZPrecision",0,358374]]
*/

// This source code is subject to the terms of the Mozilla Public License 2.0 at https://mozilla.org/MPL/2.0/

// Credits to the original Script - Range Filter DonovanWall https://www.tradingview.com/script/lut7sBgG-Range-Filter-DW/
// This version is the old version of the Range Filter with less settings to tinker with

//@version=4
study(title="Range Filter - B&S Signals", shorttitle="RF - B&S Signals", overlay=true)

//-----------------------------------------------------------------------------------------------------------------------------------------------------------------
//Functions
//-----------------------------------------------------------------------------------------------------------------------------------------------------------------

//Range Size Function
rng_size(x, qty, n)=>
//    AC       = Cond_EMA(abs(x - x[1]), 1, n)
    wper      = (n*2) - 1
    avrng     = ema(abs(x - x[1]), n)
    AC = ema(avrng, wper)*qty
    rng_size = AC

//Range Filter Function
rng_filt(x, rng_, n)=>
    r          = rng_
    var rfilt  = array.new_float(2, x)
    array.set(rfilt, 1, array.get(rfilt, 0))
    if x - r > array.get(rfilt, 1)
        array.set(rfilt, 0, x - r)
    if x + r < array.get(rfilt, 1)
        array.set(rfilt, 0, x + r)
    rng_filt1 = array.get(rfilt, 0)

    hi_band   = rng_filt1 + r
    lo_band   = rng_filt1 - r
    rng_filt  = rng_filt1
    [hi_band, lo_band, rng_filt]

//-----------------------------------------------------------------------------------------------------------------------------------------------------------------
//Inputs
//-----------------------------------------------------------------------------------------------------------------------------------------------------------------

//Range Source
rng_src = input(defval=close, type=input.source, title="Swing Source")

//Range Period
rng_per = input(defval=20, minval=1, title="Swing Period")

//Range Size Inputs
rng_qty   = input(defval=3.5, minval=0.0000001, title="Swing Multiplier")

//Bar Colors
use_barcolor = input(defval=false, type=input.bool, title="Bar Colors On/Off")

//-----------------------------------------------------------------------------------------------------------------------------------------------------------------
//Definitions
//-----------------------------------------------------------------------------------------------------------------------------------------------------------------

//Range Filter Values
[h_band, l_band, filt] = rng_filt(rng_src, rng_size(rng_src, rng_qty, rng_per), rng_per)

//Direction Conditions
var fdir = 0.0
fdir    := filt > filt[1] ? 1 : filt < filt[1] ? -1 : fdir
upward   = fdir==1 ? 1 : 0
downward = fdir==-1 ? 1 : 0

//Trading Condition
longCond = rng_src > filt and rng_src > rng_src[1] and upward > 0 or rng_src > filt and rng_src < rng_src[1] and upward > 0
shortCond = rng_src < filt and rng_src < rng_src[1] and downward > 0 or rng_src < filt and rng_src > rng_src[1] and downward > 0

CondIni = 0
CondIni := longCond ? 1 : shortCond ? -1 : CondIni[1]
longCondition = longCond and CondIni[1] == -1
shortCondition = shortCond and CondIni[1] == 1

//Colors
filt_color = upward ? #05ff9b : downward ? #ff0583 : #cccccc
bar_color  = upward and (rng_src > filt) ? (rng_src > rng_src[1] ? #05ff9b : #00b36b) :
             downward and (rng_src < filt) ? (rng_src < rng_src[1] ? #ff0583 : #b8005d) : #cccccc

//-----------------------------------------------------------------------------------------------------------------------------------------------------------------
//Outputs
//-----------------------------------------------------------------------------------------------------------------------------------------------------------------

//Filter Plot
filt_plot = plot(filt, color=filt_color, transp=67, linewidth=3, title="Filter")

//Band Plots
h_band_plot = plot(h_band, color=color.new(#05ff9b, 100), title="High Band")
l_band_plot = plot(l_band, color=color.new(#ff0583, 100), title="Low Band")

//Band Fills
fill(h_band_plot, filt_plot, color=color.new(#00b36b, 92), title="High Band Fill")
fill(l_band_plot, filt_plot, color=color.new(#b8005d, 92), title="Low Band Fill")

//Bar Color
barcolor(use_barcolor ? bar_color : na)

//Plot Buy and Sell Labels
plotshape(longCondition, title = "Buy Signal", text ="BUY", textcolor = color.white, style=shape.labelup, size = size.normal, location=location.belowbar, color = color.new(color.green, 0))
plotshape(shortCondition, title = "Sell Signal", text ="SELL", textcolor = color.white, style=shape.labeldown, size = size.normal, location=location.abovebar, color = color.new(color.red, 0))

//Alerts
alertcondition(longCondition, title="Buy Alert", message = "BUY")
alertcondition(shortCondition, title="Sell Alert", message = "SELL")


// extend
fastEmaPeriod = input(50, "fastEmaPeriod")
slowEmaPeriod = input(200, "slowEmaPeriod")
loss = input(30, "loss")
trailPoints = input(30, "trailPoints")
trailOffset = input(30, "trailOffset")
amount = input(1, "amount")

emaFast = ta.ema(close, fastEmaPeriod)
emaSlow = ta.ema(close, slowEmaPeriod)

buyCondition = longCondition and emaFast > emaSlow and close > open and close > emaFast
sellCondition = shortCondition and emaFast < emaSlow and close < open and close < emaFast

if buyCondition and strategy.position_size == 0
    strategy.entry("long", strategy.long, amount)
    strategy.exit("exit_long", "long", amount, loss=loss, trail_points=trailPoints, trail_offset=trailOffset)
if sellCondition and strategy.position_size == 0
    strategy.entry("short", strategy.short, amount)
    strategy.exit("exit_short", "short", amount, loss=loss, trail_points=trailPoints, trail_offset=trailOffset)
백테스트
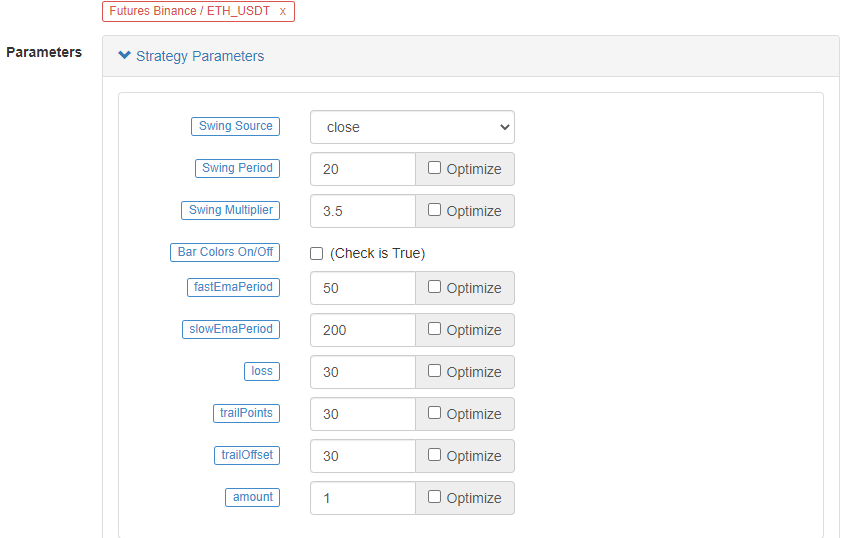
백테스트의 시간 범위는 2022년 1월부터 2022년 10월까지이다. K-라인 기간은 15분이며 폐쇄 가격 모델은 백테스트에 사용됩니다. 시장은 바이낸스 ETH_USDT 영구 계약을 선택합니다. 매개 변수는 소스 비디오의 50 기간의 빠른 라인과 200 기간의 느린 라인에 따라 설정됩니다. 다른 매개 변수는 기본적으로 변경되지 않습니다. 나는 스톱 손실 및 추적 스톱 이익 포인트를 주관적으로 30 포인트로 설정합니다.
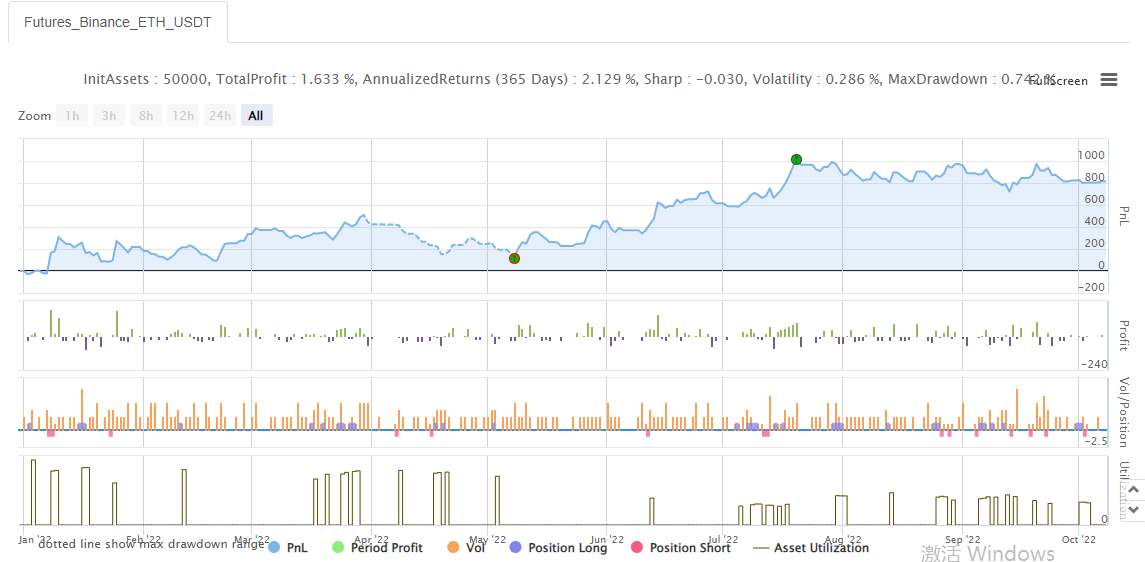
백테스팅의 결과는 평범하며, 스톱-로스 매개 변수는 백테스팅 결과에 어느 정도 영향을 미치는 것 같습니다. 이 측면은 여전히 최적화되고 설계되어야한다고 생각합니다. 그러나 전략 신호가 거래를 유발 한 후에도 승률은 여전히 좋습니다.
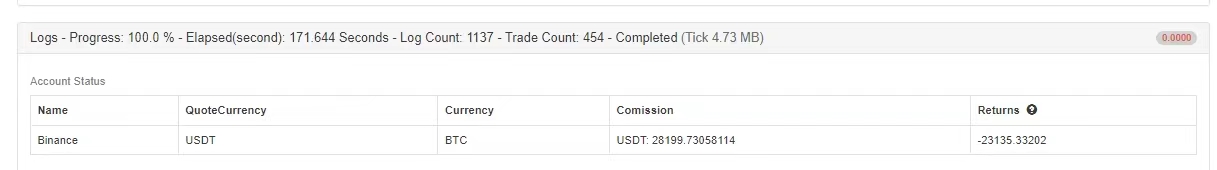
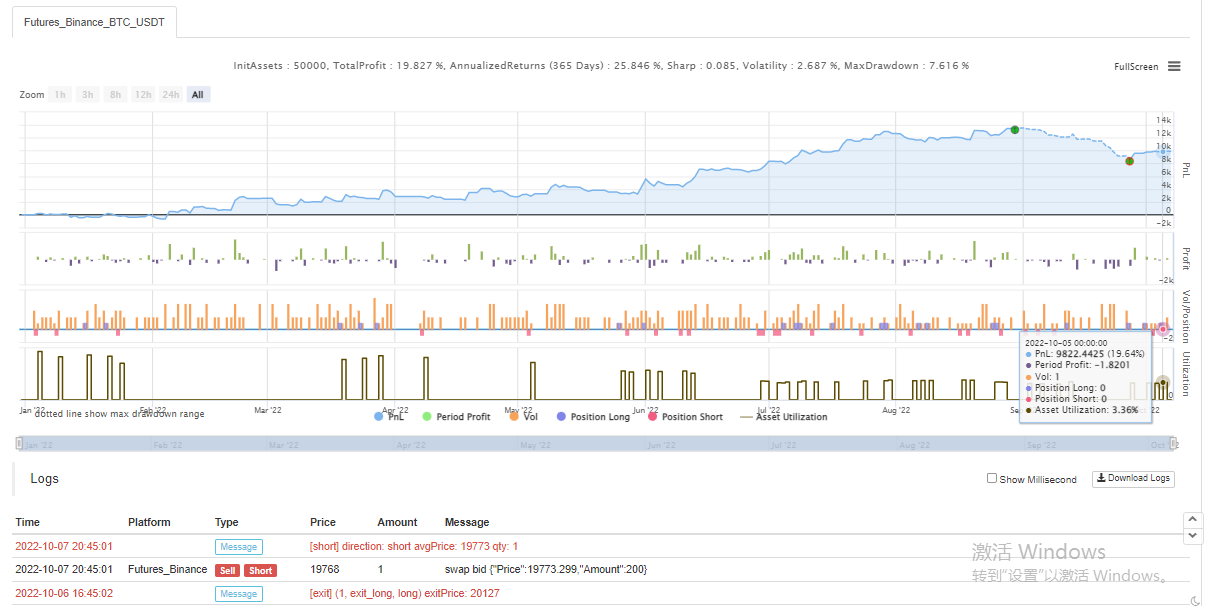
다른 BTC_USDT 영구계약을 해보죠:
BTC에 대한 백테스트 결과도 매우 수익성이 높았습니다.
전략:https://www.fmz.com/strategy/385745
트렌드를 파악하기 위해 이 거래 방법은 비교적 신뢰할 수 있는 것으로 보입니다. 이 아이디어에 따라 디자인을 계속 최적화 할 수 있습니다. 이 기사에서 우리는 이중 이동 평균 전략의 아이디어를 알게 될뿐만 아니라 유튜브에서 베테랑의 전략을 처리하고 배우는 방법을 배웠습니다. 좋습니다, 위의 전략 코드는 단지 내 벽돌과 가죽입니다, 백테스트 결과는 특정 실제 봇 결과를 나타내지 않으며 전략 코드, 디자인은 참조만을위한 것입니다. 지원에 감사드립니다, 다음 번에 다시 만나요!
- 암호화폐 시장의 근본 분석을 정량화: 데이터를 스스로 이야기하도록!
- 동전圈의 기초적인 양적 연구 - 더 이상 모든
선생님들을 믿지 말고, 데이터를 객관적으로 이야기하십시오! - 양적 거래의 필수 도구 - 발명자 양적 데이터 탐색 모듈
- 모든 것을 마스터 - FMZ에 대한 소개 트레이딩 터미널의 새로운 버전 (TRB 중재 소스 코드)
- FMZ의 새로운 거래 단말기 소개 (TRB 리비트 소스 추가)
- FMZ 퀀트: 암호화폐 시장에서 공통 요구 사항 설계 예제 분석 (II)
- 80 줄의 코드에서 고주파 전략으로 뇌 없는 판매봇을 이용하는 방법
- FMZ 정량화: 암호화폐 시장의 일반적인 요구 디자인 사례 분석 (II)
- 80줄의 코드의 고주파 전략으로 뇌 없는 로봇을 파는 방법
- FMZ Quant: 암호화폐 시장에서 공통 요구 사항 디자인 예의 분석 (I)
- FMZ 정량화: 암호화폐 시장의 일반적인 요구 디자인 사례 분석 (1)