디지털 화폐 선물 다종 ATR 전략 (교습)
저자:리디아, 창작: 2022-11-08 10:34:22, 업데이트: 2023-09-15 20:55:33
최근, 우리 플랫폼 사용자 중 일부는 MyLanguage 전략을 자바스크립트 전략으로 이식하기를 기대하고 있으며, 이는 많은 최적화 아이디어를 유연하게 추가 할 수 있습니다. 심지어는 전략을 다종 버전으로 확장합니다. MyLanguage 전략은 일반적으로 트렌드 전략이며, 그 중 많은 것이 폐쇄 가격 모델을 기반으로 실행됩니다. 전략 요청 교환의 API 인터페이스는 매우 빈번하지 않으며, 다종 전략 버전으로 이식하기에 적합합니다. 이 기사에서는 간단한 MyLanguage 전략을 예로 삼고 간단한 자바스크립트 언어 버전으로 이식합니다. 주요 목적은 교육 및 지원 연구입니다. 실제 봇을 만들고 싶다면 몇 가지 세부 사항을 추가해야 할 수 있습니다 (구청 가격, 양률 정확도, 주문 양률 제어, 자산별 순서 표시, 상태 정보 등을 표시), 또한 실제 봇 테스트가 필요할 수 있습니다.
MyLanguage의 전략 이식
TR:=MAX(MAX((H-L),ABS(REF(C,1)-H)),ABS(REF(C,1)-L));
ATR:=EMA(TR,LENGTH2);

MIDLINE^^EMA((H + L + C)/3,LENGTH1);
UPBAND^^MIDLINE + N*ATR;
DOWNBAND^^MIDLINE - N*ATR;


BKVOL=0 AND C>=UPBAND AND REF(C,1)<REF(UPBAND,1),BPK;
SKVOL=0 AND C<=DOWNBAND AND REF(C,1)>REF(DOWNBAND,1),SPK;

BKVOL>0 AND C<=MIDLINE,SP(BKVOL);
SKVOL>0 AND C>=MIDLINE,BP(SKVOL);
// stop loss
// stop loss
C>=SKPRICE*(1+SLOSS*0.01),BP;
C<=BKPRICE*(1-SLOSS*0.01),SP;
AUTOFILTER;
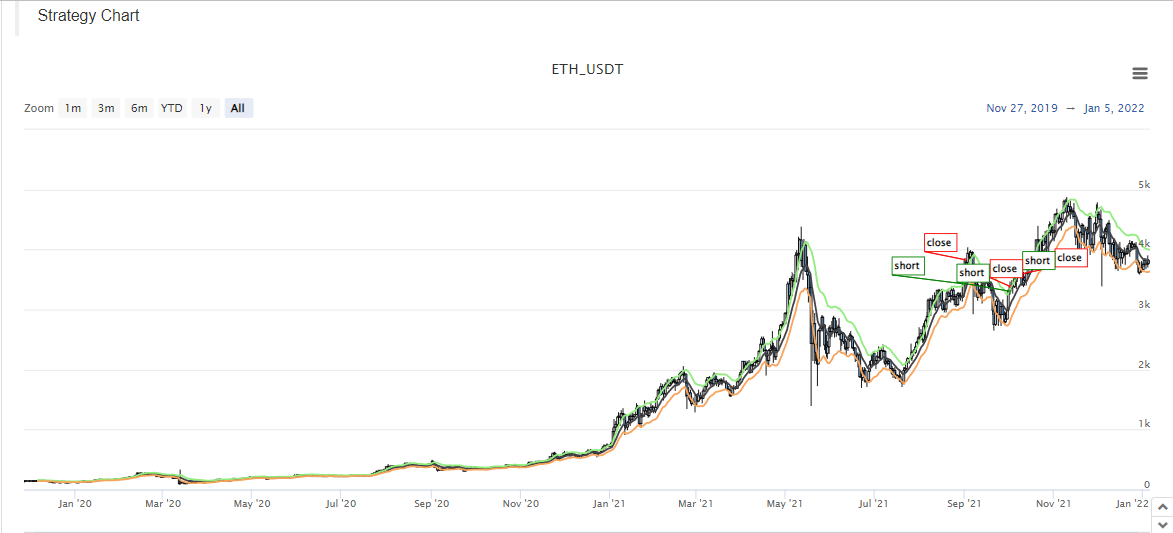
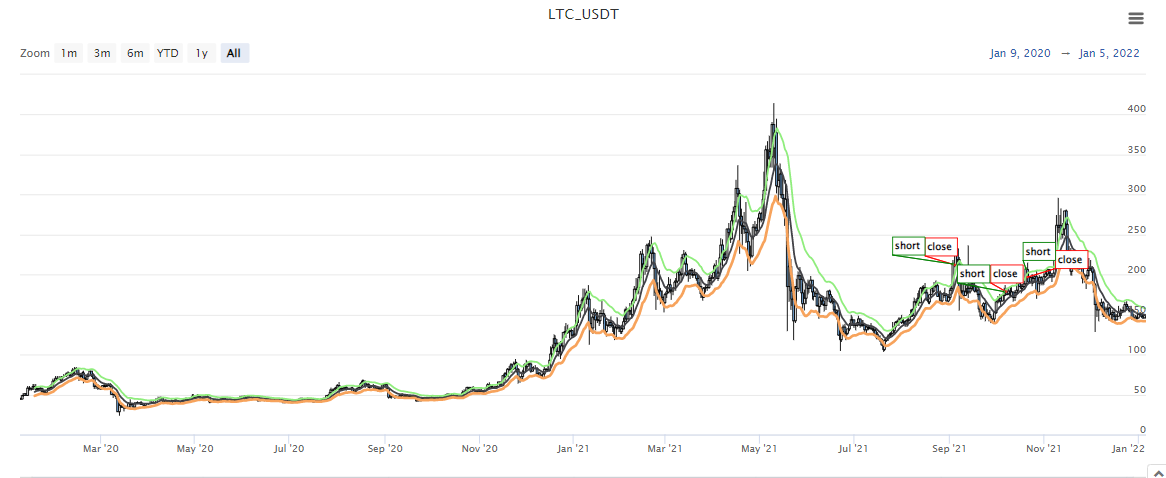
이 전략의 거래 논리는 간단합니다. 먼저 매개 변수에 따라 ATR을 계산하고 K-라인 BAR의 최고, 최저 및 폐쇄 가격의 평균을 계산하고 평균 데이터에 따라 EMA 지표를 계산합니다. 마지막으로 ATR과 계수 N을 매개 변수에서 결합하여 upBand와 downBand를 계산합니다.
오픈 및 판매 포지션은 종료 가격에 기반합니다. 상위 띠를 넘어서면 긴 포지션을 열고 오픈 포지션을 판매합니다. 하위 띠를 넘어서면 짧은 포지션을 열고 오픈 포지션을 판매합니다. 닫기 가격이 중간선에 도달하면 포지션이 닫히고 닫기 가격이 중지 손실 가격에 도달하면 포지션도 닫힐 것입니다 (SLOSS에 따르면 SLOSS는 1, 즉 0.01, 즉 1%입니다). 이 전략은 폐쇄 가격 모델로 실행됩니다.
MyLanguage의 전략적 요구사항과 아이디어를 이해한다면, 우리는 그것들을 이식하기 시작할 수 있습니다.
이식 및 설계 전략 프로토타입
전략 프로토타입 코드는 1~200줄에 달하는 것이 많지 않다. 전략 작성 아이디어를 배우는 것을 촉진하기 위해, 코멘트는 전략 코드에 직접 작성된다.
// parse params parameters, and parse strings as objects
var arrParam = JSON.parse(params)

// this function creates a chart configuration
function createChartConfig(symbol, atrPeriod, emaPeriod, index) {   // symbol : trading pair, atrPeriod : ATR parameter period , emaPeriod : EMA parameter period, exchange object index corresponding to index
    var chart = {
        __isStock: true,
        extension: {
                layout: 'single',
                height: 600,
        },
        title : { text : symbol},
        xAxis: { type: 'datetime'},
        series : [
            {
                type: 'candlestick',    // K-line data series
                name: symbol,
                id: symbol + "-" + index,
                data: []
            }, {
                type: 'line',           // EMA
                name: symbol + ',EMA:' + emaPeriod,
                data: [],
            }, {
                type: 'line',           // upBand
                name: symbol + ',upBand' + atrPeriod,
                data: []
            }, {
                type: 'line',           // downBand
                name: symbol + ',downBand' + atrPeriod,
                data: []
            }, {
                type: 'flags',
                onSeries: symbol + "-" + index,
                data: [],
            }
        ]
    }
    return chart
}

// main Logic
function process(e, kIndex, c) {    // e is the exchange object, exchanges [0]..., kIndex is the K-line data series in the chart, and c is the chart object
    // obtain K-line data
    var r = e.GetRecords(e.param.period)
    if (!r || r.length < e.param.atrPeriod + 2 || r.length < e.param.emaPeriod + 2) {
        // if the K-line data length is insufficient, return
        return
    }

    // calculate ATR indicators
    var atr = TA.ATR(r, e.param.atrPeriod)
    var arrAvgPrice = []
    _.each(r, function(bar) {
        arrAvgPrice.push((bar.High + bar.Low + bar.Close) / 3)
    })
    // calculate EMA indicators
    var midLine = TA.EMA(arrAvgPrice, e.param.emaPeriod)
    // calculate upBand and downBand
    var upBand = []
    var downBand = []
    _.each(midLine, function(mid, index) {
        if (index < e.param.emaPeriod - 1 || index < e.param.atrPeriod - 1) {
            upBand.push(NaN)
            downBand.push(NaN)
            return
        }
        upBand.push(mid + e.param.trackRatio * atr[index])
        downBand.push(mid - e.param.trackRatio * atr[index])
    })

    // draw the chart
    for (var i = 0 ; i < r.length ; i++) {
        if (r[i].Time == e.state.lastBarTime) {
            // update
            c.add(kIndex, [r[i].Time, r[i].Open, r[i].High, r[i].Low, r[i].Close], -1)
            c.add(kIndex + 1, [r[i].Time, midLine[i]], -1)
            c.add(kIndex + 2, [r[i].Time, upBand[i]], -1)
            c.add(kIndex + 3, [r[i].Time, downBand[i]], -1)
        } else if (r[i].Time > e.state.lastBarTime) {
            // add
            e.state.lastBarTime = r[i].Time
            c.add(kIndex, [r[i].Time, r[i].Open, r[i].High, r[i].Low, r[i].Close])
            c.add(kIndex + 1, [r[i].Time, midLine[i]])
            c.add(kIndex + 2, [r[i].Time, upBand[i]])
            c.add(kIndex + 3, [r[i].Time, downBand[i]])
        }
    }

    // check the position
    var pos = e.GetPosition()
    if (!pos) {
        return
    }
    var holdAmount = 0
    var holdPrice = 0
    if (pos.length > 1) {
        throw "long and short positions are checked at the same time!"
    } else if (pos.length != 0) {
        holdAmount = pos[0].Type == PD_LONG ? pos[0].Amount : -pos[0].Amount
        holdPrice = pos[0].Price
    }

    if (e.state.preBar == -1) {
        e.state.preBar = r[r.length - 1].Time
    }
    // check the signal
    if (e.state.preBar != r[r.length - 1].Time) {   // closing price model
        if (holdAmount <= 0 && r[r.length - 3].Close < upBand[upBand.length - 3] && r[r.length - 2].Close > upBand[upBand.length - 2]) {   // the closing price cross over the upBand
            if (holdAmount < 0) {   // hold a short positions, close them
                Log(e.GetCurrency(), "close short positions", "#FF0000")
                $.CoverShort(e, e.param.symbol, Math.abs(holdAmount))
                c.add(kIndex + 4, {x: r[r.length - 2].Time, color: 'red', shape: 'flag', title: 'close', text: "close short positions"})
            }
            // open long positions
            Log(e.GetCurrency(), "open long positions", "#FF0000")
            $.OpenLong(e, e.param.symbol, 10)
            c.add(kIndex + 4, {x: r[r.length - 2].Time, color: 'red', shape: 'flag', title: 'long', text: "open long positions"})
        } else if (holdAmount >= 0 && r[r.length - 3].Close > downBand[downBand.length - 3] && r[r.length - 2].Close < downBand[downBand.length - 2]) {  // the closing price cross down the downBand
            if (holdAmount > 0) {   // hold long positions, close them
                Log(e.GetCurrency(), "close long positions", "#FF0000")
                $.CoverLong(e, e.param.symbol, Math.abs(holdAmount))
                c.add(kIndex + 4, {x: r[r.length - 2].Time, color: 'green', shape: 'flag', title: 'close', text: "close long positions"})
            }
            // open short positions
            Log(e.GetCurrency(), "open short positions", "#FF0000")
            $.OpenShort(e, e.param.symbol, 10)
            c.add(kIndex + 4, {x: r[r.length - 2].Time, color: 'green', shape: 'flag', title: 'short', text: "open short positions"})
        } else {
            // close positions
            if (holdAmount > 0 && (r[r.length - 2].Close <= holdPrice * (1 - e.param.stopLoss) || r[r.length - 2].Close <= midLine[midLine.length - 2])) {   // Hold a long position, the closing price is less than or equal to the midline, stop loss at the opening price
                Log(e.GetCurrency(), "trigger midline or stop loss, close long positions", "#FF0000")
                $.CoverLong(e, e.param.symbol, Math.abs(holdAmount))
                c.add(kIndex + 4, {x: r[r.length - 2].Time, color: 'green', shape: 'flag', title: 'close', text: "close long positions"})
            } else if (holdAmount < 0 && (r[r.length - 2].Close >= holdPrice * (1 + e.param.stopLoss) || r[r.length - 2].Close >= midLine[midLine.length - 2])) {  // Hold a short position, the closing price is greater than or equal to the midline, stop loss at the opening price
                Log(e.GetCurrency(), "trigger midline or stop loss, close short positions", "#FF0000")
                $.CoverShort(e, e.param.symbol, Math.abs(holdAmount))
                c.add(kIndex + 4, {x: r[r.length - 2].Time, color: 'red', shape: 'flag', title: 'close', text: "close short positions"})
            }
        }
        e.state.preBar = r[r.length - 1].Time
    }
}

function main() {
    var arrChartConfig = []
    if (arrParam.length != exchanges.length) {
        throw "Parameters and exchange objects do not match!"
    }
    var arrState = _G("arrState")
    _.each(exchanges, function(e, index) {
        if (e.GetName() != "Futures_Binance") {
            throw "The exchange is not supported!"
        }
        e.param = arrParam[index]
        e.state = {lastBarTime: 0, symbol: e.param.symbol, currency: e.GetCurrency()}
        if (arrState) {
            if (arrState[index].symbol == e.param.symbol && arrState[index].currency == e.GetCurrency()) {
                Log("restore:", e.state)
                e.state = arrState[index]
            } else {
                throw "The restored data does not match the current settings!"
            }
        }
        e.state.preBar = -1   // initial setting -1
        e.SetContractType(e.param.symbol)
        Log(e.GetName(), e.GetLabel(), "set contracts:", e.param.symbol)
        arrChartConfig.push(createChartConfig(e.GetCurrency(), e.param.atrPeriod, e.param.emaPeriod, index))
    })
    var chart = Chart(arrChartConfig)
    chart.reset()

    while (true) {
        _.each(exchanges, function(e, index) {
            process(e, index + index * 4, chart)
            Sleep(500)
        })
    }
}

function onexit() {
    // record e.state
    var arrState = []
    _.each(exchanges, function(e) {
        arrState.push(e.state)
    })
    Log("record:", arrState)
    _G("arrState", arrState)
}
전략 매개 변수
var params = '[{
        "symbol" : "swap",    // contract code
        "period" : 86400,     // K-line period, 86,400 seconds is a day
        "stopLoss" : 0.07,    // stop loss factor, 0.07 or 7%
        "atrPeriod" : 10,     // ATR indicator parameters
        "emaPeriod" : 10,     // EMA indicator parameters
        "trackRatio" : 1,     // upBand and downBand coefficients
        "openRatio" : 0.1     // The reserved opening percentage, which is not supported for now
    }, {
        "symbol" : "swap",
        "period" : 86400,
        "stopLoss" : 0.07,
        "atrPeriod" : 10,
        "emaPeriod" : 10,
        "trackRatio" : 1,
        "openRatio" : 0.1
    }]'
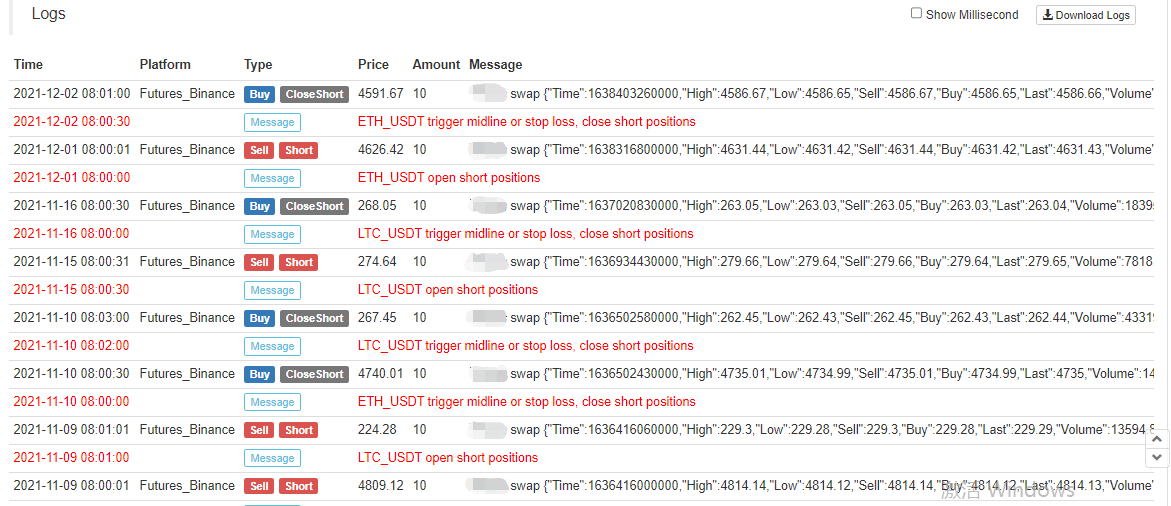
백테스트 스크린샷:
전략 소스 코드:https://www.fmz.com/strategy/339344
전략은 백테스팅 및 학습 연구용입니다. 직접 수정, 최적화 및 실제 봇을 참조하십시오.
- 암호화폐 시장의 근본 분석을 정량화: 데이터를 스스로 이야기하도록!
- 동전圈의 기초적인 양적 연구 - 더 이상 모든
선생님들을 믿지 말고, 데이터를 객관적으로 이야기하십시오! - 양적 거래의 필수 도구 - 발명자 양적 데이터 탐색 모듈
- 모든 것을 마스터 - FMZ에 대한 소개 트레이딩 터미널의 새로운 버전 (TRB 중재 소스 코드)
- FMZ의 새로운 거래 단말기 소개 (TRB 리비트 소스 추가)
- FMZ 퀀트: 암호화폐 시장에서 공통 요구 사항 설계 예제 분석 (II)
- 80 줄의 코드에서 고주파 전략으로 뇌 없는 판매봇을 이용하는 방법
- FMZ 정량화: 암호화폐 시장의 일반적인 요구 디자인 사례 분석 (II)
- 80줄의 코드의 고주파 전략으로 뇌 없는 로봇을 파는 방법
- FMZ Quant: 암호화폐 시장에서 공통 요구 사항 디자인 예의 분석 (I)
- FMZ 정량화: 암호화폐 시장의 일반적인 요구 디자인 사례 분석 (1)