전략에 멀티 차트 지원을 추가하는 법을 가르쳐
저자:리디아, 창작: 2022-12-26 11:28:50, 업데이트: 2023-09-20 09:52:47
전략에 멀티 차트 지원을 추가하는 법을 가르쳐
특히 트렌드 전략을 작성할 때, 때때로 다양한 지표의 트리거 조건으로 혼란을 겪을 수 있다. 이 시점에서 분석 및 시청을 위해 데이터를 시각화하는 것이 시급하다. 전략에 단일 차트를 추가할 때,
여기 참조를 위한 예가 있습니다. 나는 샘플 코드 라인 하나씩에 대해 언급 할 것입니다. 코드를 읽고 끝낼 때, 당신은 전략에 차트 지원을 추가하는 새로운 이해가있을 것입니다.
/*backtest
start: 2019-07-01 00:00:00
end: 2019-08-24 00:00:00
period: 1h
exchanges: [{"eid":"Futures_OKCoin","currency":"BTC_USD"}]
args: [["IsSynthesisDayKL",true]]
*/

var chart0 = {
    __isStock: true,
    // /*
    extension: {
            layout: 'single',
            height: 300,
    },
    // */
    title : { text : 'Daily K-line chart'},
    xAxis: { type: 'datetime'},
    series : [
        {
            type: 'candlestick',
            name: 'r',
            id: 'r',
            data: []
        }
    ]
}

var chart1 = {
    __isStock: true,
    // /*
    extension: {
            layout: 'single',
            height: 300,
    },
    // */
    title : { text : 'EMA'},
    xAxis: { type: 'datetime'},
    series : [
        {
            type: 'candlestick',
            name: 'r1',
            id: 'r1',
            data: []
        }, {
            type: 'line',
            name: 'chart1_EMA1',
            data: [],
        }, {
            type: 'line',
            name: 'chart1_EMA2',
            data: []
        }
    ]
}

var chart2 = {
    __isStock: true,
    // /*
    extension: {
            layout: 'single',
            height: 300,
    },
    // */
    title : { text : 'MACD'},
    xAxis: { type: 'datetime'},
    yAxis : [
        {
            title: {text: 'price'},
            opposite: false
        }, {
            title:{text: "Indicator axis"},
            opposite: true,
        }
    ],
    series : [
        {
            type: 'candlestick',
            name: 'r2',
            id: 'r2',
            data: []
        }, {
            type: 'line',
            yAxis: 1,
            name: 'dif',
            data: []
        }, {
            type: 'line',
            yAxis: 1,
            name: 'dea',
            data: []
        }
    ]
}

function CreatePlotter (e, chart) {
    var obj = {}                      // Declare an empty object for adding methods in the following code, and finally return this object, that is, the constructed drawing object.

    obj.e = e                         // The reference to the exchange object passed by the parameter is assigned to a property of the obj object.
    obj.params = {}                   // Constructed parameters
    obj.params.EMA_param1 = 5         // We preset the parameters of some indicators on the chart to be used in the calculation of the indicator, for example, an EMA indicator line parameter.
    obj.params.EMA_param2 = 20        // The second EMA indicator line parameters, usually small parameters are called fast lines, large parameters are called slow lines.
    obj.params.MACD_fast = 12         // MACD parameter
    obj.params.MACD_slow = 26         // MACD parameter
    obj.params.MACD_sig = 9           // MACD parameter

    obj.runTime = {}                  // Used to store some data during runtime.
    obj.runTime.arrPreBarTime = [0, 0, 0]    // Store the timestamp of the previous bar of each K-line data for comparison.

    obj.GetAllRecords = function () {              // A method of the drawing object, used to get the K-line data, our example is used to display three charts at the same time, so, the function get three different periods of K-line data at the same time.
        obj.r = _C(obj.e.GetRecords, PERIOD_H1)    // The K-line data of the first chart, which is the 1-hour level K-line data.
        Sleep(1000)
        obj.r1 = _C(obj.e.GetRecords, PERIOD_M15)  // The K-line data of the second chart, which is the 15-minute level K-line data.
        Sleep(1000)
        obj.r2 = _C(obj.e.GetRecords, PERIOD_D1)   // The K-line data of the third chart, which is the daily level K-line data.
    }

    obj.Run = function () {                        // Execute the functions of drawing objects.
        obj.Plot()                                 // Execute the specific drawing code.
    }

    obj.CalcMACD = function (r, fast, slow, sig) {       // MACD indicator calculation function, return MACD indicator data.
        if (r.length <= Math.max(fast, slow, sig)) {
            return false
        }
        return TA.MACD(r, fast, slow, sig)
    }


    obj.Plot = function () {                   // Focus section with specific drawing code.
        obj.GetAllRecords()                    // Before each plot, update all K-line data first.
        var arr = [obj.r, obj.r1, obj.r2]      // Put all K-line data in an array and traverse it.
        var arrKIndex = [0, 1, 4]              // Indexing of K-line data series in chart objects.
        for (var i = 0; i < arr.length; i++) { // Traversal operations
            for (var j = 0; j < arr[i].length; j++) {
                if (arr[i][j].Time == obj.runTime.arrPreBarTime[i]) {    // When the last bar of the K-line data is not updated, we only update the data and do not add it. Note that when the chart.add function is called, the last parameter uses -1, which means that the data is updated and not added.
                    chart.add(arrKIndex[i], [arr[i][j].Time, arr[i][j].Open, arr[i][j].High, arr[i][j].Low, arr[i][j].Close], -1)

                   if (i == 1) {    // Update the EMA indicator data in the second chart.
                        var nowR = arr[i].slice(0, j + 1)
                        var ema1 = TA.EMA(nowR, obj.params.EMA_param1)
                        var ema2 = TA.EMA(nowR, obj.params.EMA_param2)
                        if (obj.r2.length <= obj.params.EMA_param1 || obj.r2.length <= obj.params.EMA_param2 || isNaN(ema1[j]) || isNaN(ema2[j])) {
                            continue
                        }

                        chart.add(2, [arr[i][j].Time, ema1[ema1.length - 1]], -1)
                        chart.add(3, [arr[i][j].Time, ema2[ema2.length - 1]], -1)
                    } else if (i == 2) {     // Update the MACD indicator data in the third chart
                        var nowR = arr[i].slice(0, j + 1)
                        var macd = obj.CalcMACD(nowR, obj.params.MACD_fast, obj.params.MACD_slow, obj.params.MACD_sig)
                        if (!macd) {
                            continue
                        }

                        var dif = macd[0]
                        var dea = macd[1]
                        chart.add(5, [arr[i][j].Time, dif[dif.length - 1]], -1)
                        chart.add(6, [arr[i][j].Time, dea[dea.length - 1]], -1)
                    }
                } else if (arr[i][j].Time > obj.runTime.arrPreBarTime[i]) {   // When the last bar of the current K-line data is larger than the last bar timestamp recorded previously, it indicates that a new bar has been generated for the K-line. At this time, a new bar and a new indicator data point should be added.
                    obj.runTime.arrPreBarTime[i] = arr[i][j].Time             // Update the record of the last bar timestamp for the next comparison. If the next timestamp is the same, data will not be added unless a new bar is generated.
                    chart.add(arrKIndex[i], [arr[i][j].Time, arr[i][j].Open, arr[i][j].High, arr[i][j].Low, arr[i][j].Close])
                    if (i == 1) {
                        var nowR = arr[i].slice(0, j + 1)
                        var ema1 = TA.EMA(nowR, obj.params.EMA_param1)
                        var ema2 = TA.EMA(nowR, obj.params.EMA_param2)
                        if (nowR.length <= obj.params.EMA_param1 || nowR.length <= obj.params.EMA_param2 || isNaN(ema1[ema1.length - 1]) || isNaN(ema2[ema2.length - 1])) {
                            continue
                        }

                        chart.add(2, [arr[i][j].Time, ema1[ema1.length - 1]])
                        chart.add(3, [arr[i][j].Time, ema2[ema2.length - 1]])
                    } else if (i == 2) {
                        var nowR = arr[i].slice(0, j + 1)
                        var macd = obj.CalcMACD(nowR, obj.params.MACD_fast, obj.params.MACD_slow, obj.params.MACD_sig)
                        if (!macd) {
                            continue
                        }

                        var dif = macd[0]
                        var dea = macd[1]
                        chart.add(5, [arr[i][j].Time, dif[dif.length - 1]])
                        chart.add(6, [arr[i][j].Time, dea[dea.length - 1]])
                    }
                }
            }
        }
    }
    obj.Plot()

    return obj
}

function main () {
    var chart = Chart([chart0, chart1, chart2])
    chart.reset()

    exchange.SetContractType("quarter")
    var plotter = CreatePlotter(exchange, chart)
    while (true) {
        plotter.Run()
        Sleep(1000)
    }
}
우리는main기능:
function main () {                                  // Strategy entry function, of course, this strategy does not do anything, there are no transactions, just drawing charts.
    var chart = Chart([chart0, chart1, chart2])     // chart0, chart1, chart2 are pre-declared chart configuration objects, call the Chart function is to load the chart configuration, return a chart control object chart.
    chart.reset()                                   // Call the reset method of the chart control object chart to reset the chart.

    exchange.SetContractType("quarter")             // The backtest configuration is OKX futures, so here to set the contract, the contract is set to quarter.
    var plotter = CreatePlotter(exchange, chart)    // Call the CreatePlotter function to generate the plotter object -- plotter.
    while (true) {
        plotter.Run()                               // Execute drawing object plotter member function Run to draw.
        Sleep(1000)                                 // The drawing object plotter is responsible for "how to draw", and the chart control object chart is responsible for specific drawing. The former is implemented by our code, and the latter is the control object returned by the underlying API function of the system.
    }
}
다음으로, 우리는 어떻게CreatePlotter이 함수는 도면 객체를 만들 때 도면 함수를 구현합니다.var plotter=CreatePlotter(exchange, chart), 그림 객체 플롯터를 구성할 때 교환과 차트를 전달한다. 전자는 K-라인 데이터를 얻기 위해 사용된다 (exchange.GetRecords를 호출함으로써), 후자는 차트를 조작하고 차트에 데이터를 추가하는 데 사용됩니다.
이 줄거리의 가장 중요한 부분은Plot코드에 댓글이 적혀있어요.
백테스트 작업:
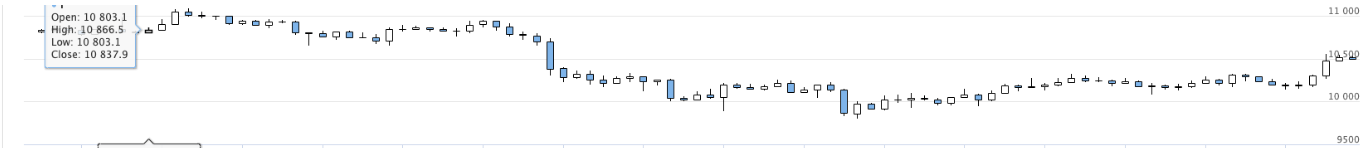
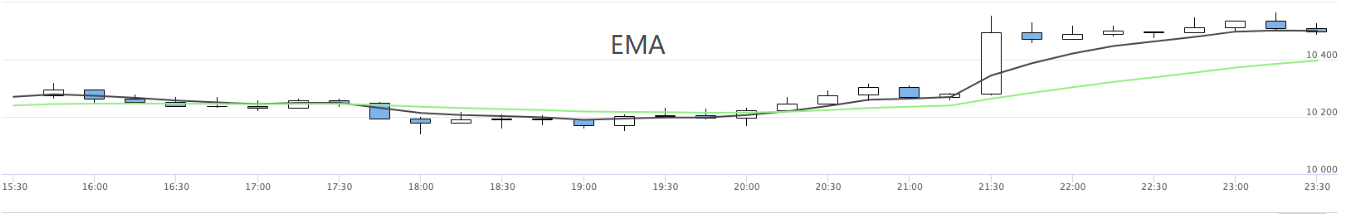
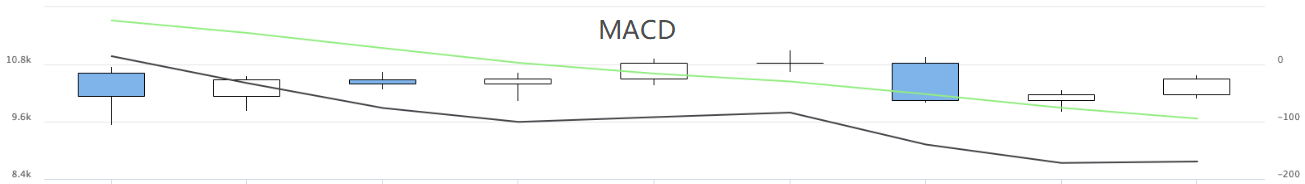
이렇게 하면 여러 가지 전략 차트를 표시할 수 있습니다.
관련
- 암호화폐 시장의 근본 분석을 정량화: 데이터를 스스로 이야기하도록!
- 동전圈의 기초적인 양적 연구 - 더 이상 모든
선생님들을 믿지 말고, 데이터를 객관적으로 이야기하십시오! - 양적 거래의 필수 도구 - 발명자 양적 데이터 탐색 모듈
- 모든 것을 마스터 - FMZ에 대한 소개 트레이딩 터미널의 새로운 버전 (TRB 중재 소스 코드)
- FMZ의 새로운 거래 단말기 소개 (TRB 리비트 소스 추가)
- FMZ 퀀트: 암호화폐 시장에서 공통 요구 사항 설계 예제 분석 (II)
- 80 줄의 코드에서 고주파 전략으로 뇌 없는 판매봇을 이용하는 방법
- FMZ 정량화: 암호화폐 시장의 일반적인 요구 디자인 사례 분석 (II)
- 80줄의 코드의 고주파 전략으로 뇌 없는 로봇을 파는 방법
- FMZ Quant: 암호화폐 시장에서 공통 요구 사항 디자인 예의 분석 (I)
- FMZ 정량화: 암호화폐 시장의 일반적인 요구 디자인 사례 분석 (1)
더 많은