기울기 적응 이동 평균
저자:차오장, 날짜: 2022-05-31 18:07:34태그:AMA
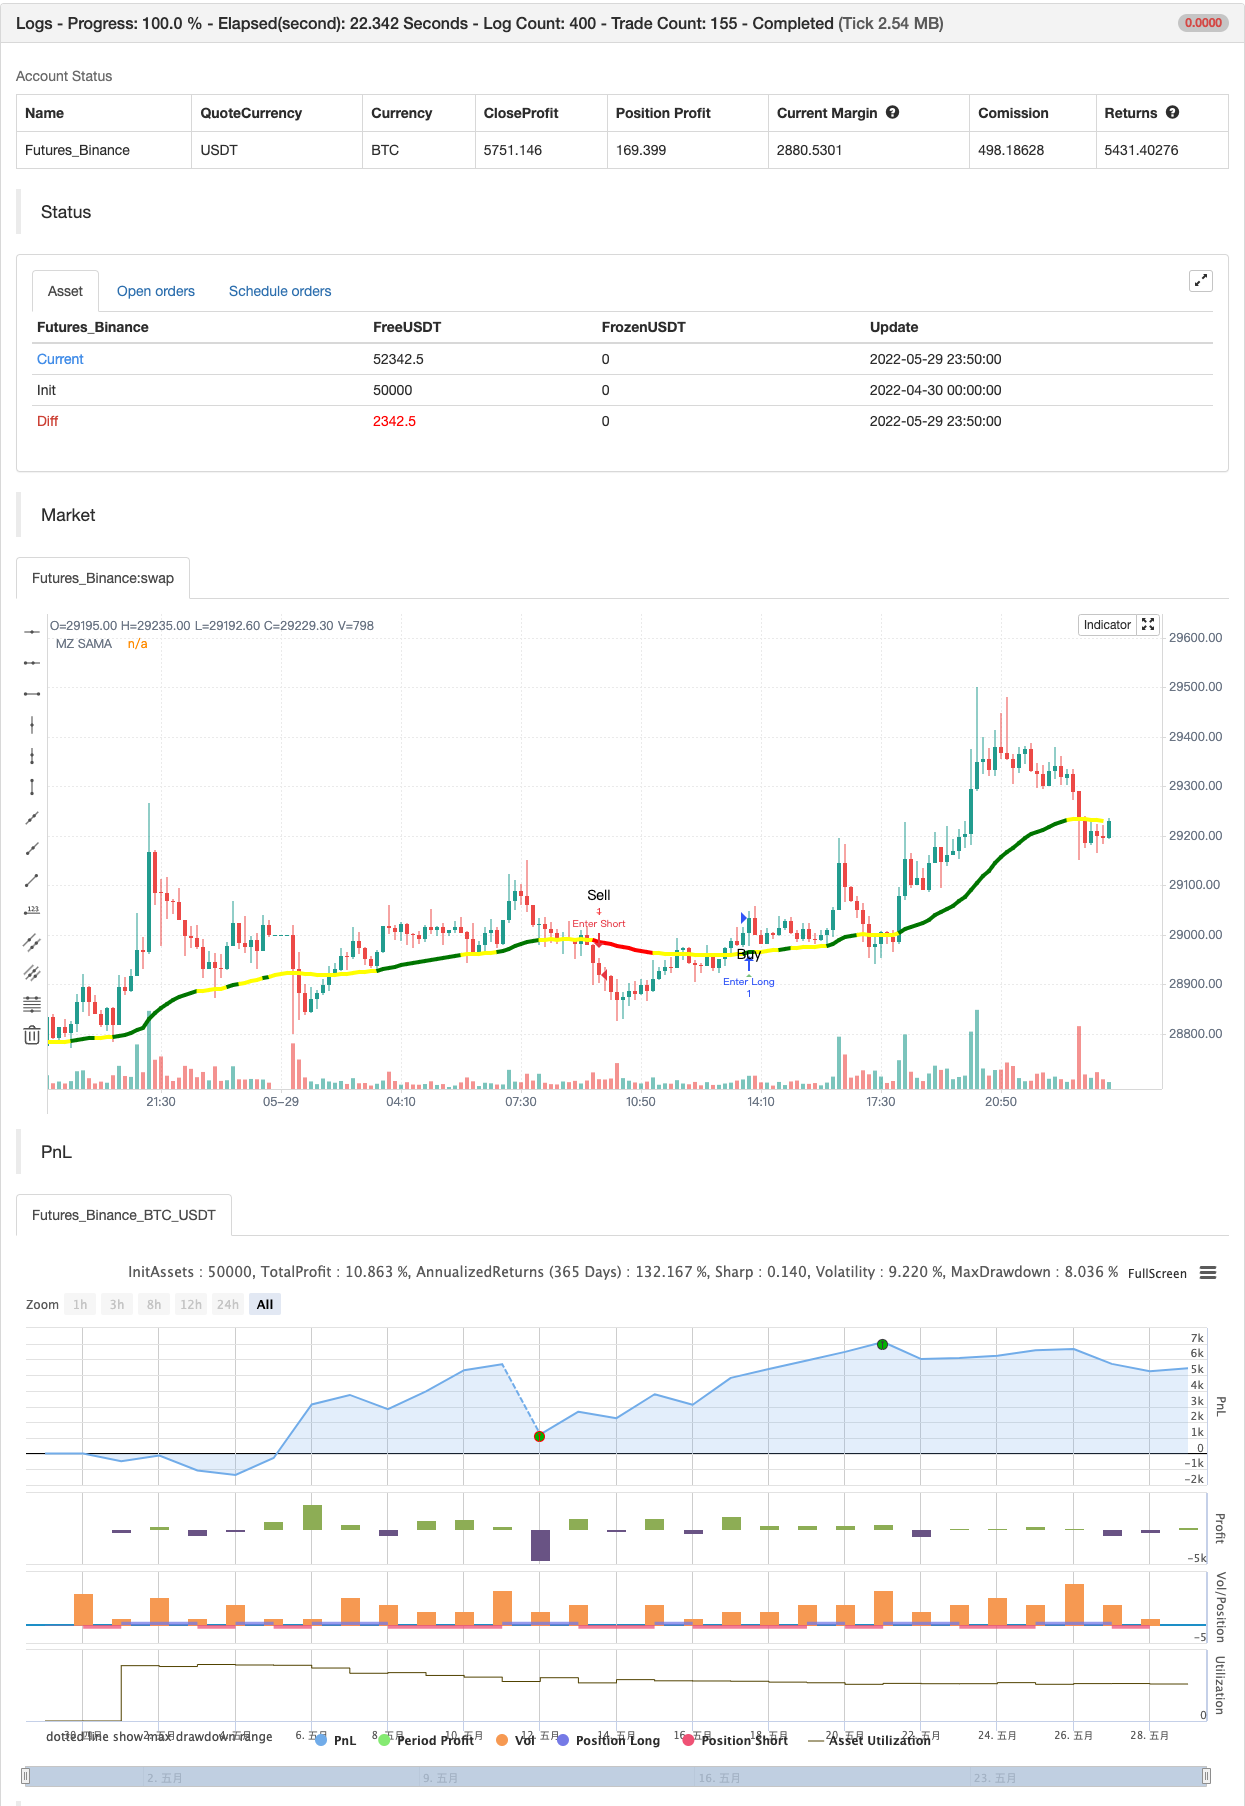
소개
이 스크립트는
트렌드 탐지 녹색 색: 가격 동력을 가진 강한 상승 추세 빨간색: 강한 하향 추세 노란 색: 시장은 불안정하고, 옆으로 움직이고, 또는 고집하고 있습니다. 새로운 입장을 취하는 것을 피하는 것이 더 낫습니다.
기본 설정 AMA 길이는 200입니다 (1H 이상의 시간 프레임에 더 좋습니다) 작은 길이는 6 주요 길이는 14 기울기 기간은 초기 범위의 25와 34로 설정됩니다. 통합은 항상 17 아래입니다. 경보 구매/판매 알레르트는 기울기가 통합/부진 영역에서 벗어날 때 계속됩니다. 절대 알레르트 타이밍에서 가장 좋은 입력이 있지만 다른 거래는 트렌드 상태에 따라 중간에서 시작할 수 있습니다.
백테스트
/*backtest
start: 2022-04-30 00:00:00
end: 2022-05-29 23:59:00
period: 10m
basePeriod: 1m
exchanges: [{"eid":"Futures_Binance","currency":"BTC_USDT"}]
*/

// This source code is subject to the terms of the Mozilla Public License 2.0 at https://mozilla.org/MPL/2.0/
// © MightyZinger

//@version=5

indicator('Slope Adaptive Moving Average (MZ SAMA)', shorttitle='MZ SAMA', overlay=true)

/////////////////////////////////////////////////////////////////////
/////////////////////////////////////////////////////////////////////
/////                        MZ SAMA                           //////
/////////////////////////////////////////////////////////////////////
/////////////////////////////////////////////////////////////////////

chartResolution = input.timeframe('', title='Chart Resolution')
src = input.source(close, 'Source')

// Length Inputs
string grp_1 = 'SAMA Length Inputs'
length = input(200, title='Adaptive MA Length', group = grp_1) // To check for Highest and Lowest value within provided period
majLength = input(14, title='Major Length', group = grp_1)     // For Major alpha calculations to detect recent price changes
minLength = input(6, title='Minor Length', group = grp_1)      // For Minor alpha calculations to detect recent price changes

// Slope Inputs
string grp_2 = 'Slope and Dynamic Coloring Parameters'
slopePeriod = input.int(34, title='Slope Period', group = grp_2)
slopeInRange = input.int(25, title='Slope Initial Range', group = grp_2)
flat = input.int(17, title='Consolidation area is when slope below:', group = grp_2)
bull_col = input.color(color.green, 'Bull Color  ', inline='dyn_col', group = grp_2)
bear_col = input.color(color.red, 'Bear Color  ', inline='dyn_col', group = grp_2)
conc_col = input.color(color.yellow, 'Reversal/Consolidation/Choppiness Color  ', inline='dyn_col', group = grp_2)

showSignals = input.bool(true, title='Show Signals on Chart', group='Plot Parameters')

//Slope calculation Function to check trend strength i.e. consolidating, choppy, or near reversal

calcslope(_ma, src, slope_period, range_1) =>
    pi = math.atan(1) * 4
    highestHigh = ta.highest(slope_period)
    lowestLow = ta.lowest(slope_period)
    slope_range = range_1 / (highestHigh - lowestLow) * lowestLow
    dt = (_ma[2] - _ma) / src * slope_range
    c = math.sqrt(1 + dt * dt)
    xAngle = math.round(180 * math.acos(1 / c) / pi)
    maAngle = dt > 0 ? -xAngle : xAngle
    maAngle

//MA coloring function to mark market dynamics

dynColor(_flat, slp, col_1, col_2, col_r) =>
    var col = color.new(na,0)
    // Slope supporting bullish uprtrend color
    col := slp > _flat ? col_1:
    // Slope supporting bearish downtrend color
         slp <= -_flat ? col_2:
    // Reversal/Consolidation/Choppiness color
         slp <= _flat and slp > -_flat ? col_r : col_r
    col

//AMA Calculations

ama(src,length,minLength,majLength)=>
    minAlpha = 2 / (minLength + 1)
    majAlpha = 2 / (majLength + 1)

    hh = ta.highest(length + 1)
    ll = ta.lowest(length + 1)

    mult = hh - ll != 0 ? math.abs(2 * src - ll - hh) / (hh - ll) : 0
    final = mult * (minAlpha - majAlpha) + majAlpha

    final_alpha = math.pow(final, 2) 		// Final Alpha calculated from Minor and Major length along with considering Multiplication factor calculated using Highest / Lowest value within provided AMA overall length
    var _ama = float(na)
    _ama := (src - nz(_ama[1])) * final_alpha + nz(_ama[1])
    _ama

// SAMA Definition
sama = request.security(syminfo.tickerid, chartResolution, ama(src,length,minLength,majLength))

// Slope Calculation for Dynamic Coloring
slope = calcslope(sama, src, slopePeriod, slopeInRange)

// SAMA Dynamic Coloring from slope
sama_col = request.security(syminfo.tickerid, chartResolution, dynColor(flat, slope, bull_col, bear_col, conc_col))

// SAMA Plot
plot(sama, 'MZ SAMA', sama_col, 4)


// BUY & SELL CONDITIONS AND ALERTS
_up = sama_col == bull_col
_downn = sama_col == bear_col
_chop = sama_col == conc_col
buy  = _up and not _up[1]
sell = _downn and not _downn[1]
chop_zone = _chop and not _chop[1]

_signal() =>
    var sig = 0
    if buy and sig <= 0
        sig := 1
    if sell and sig >= 0
        sig := -1
    sig

sig = _signal()

longsignal  = sig ==  1 and (sig !=  1)[1]
shortsignal = sig == -1 and (sig != -1)[1]

// Plotting Signals on Chart
atrOver = 1 * ta.atr(5)   // Atr to place alert shape on chart
plotshape(showSignals and longsignal  ? (sama - atrOver) : na , style=shape.triangleup, color=color.new(color.green, 30), location=location.absolute, text='Buy', size=size.small)
plotshape(showSignals and shortsignal ? (sama + atrOver): na , style=shape.triangledown, color=color.new(color.red, 30), location=location.absolute, text='Sell', size=size.small)

// Signals Alerts
alertcondition(longsignal, "Buy",  "Go Long" )
alertcondition(shortsignal, "Sell", "Go Short")
alertcondition(chop_zone, "Chop Zone", "Possible Reversal/Consolidation/Choppiness")

if longsignal
    alert("Buy at" + str.tostring(close), alert.freq_once_per_bar_close)
if shortsignal
    alert("Sell at" + str.tostring(close), alert.freq_once_per_bar_close)


if longsignal
    strategy.entry("Enter Long", strategy.long)
else if shortsignal
    strategy.entry("Enter Short", strategy.short)
관련
더 많은